3727
On the Importance of Using High-Resolution Atlases for Voxel-Based Morphometry of High-Resolution MRI Data: A Case-Control Study on Essential Tremor1School of Health Sciences, Purdue University, West Lafayette, IN, United States, 2Department of Radiology and Imaging Sciences, Indiana University School of Medicine, Indianapolis, IN, United States, 3Department of Radiology, Weill Cornell Medicine, New York, NY, United States, 4Department of Neurology, Yale School of Medicine, New Haven, CT, United States, 5Department of Chronic Disease Epidemiology, Yale School of Public Health, New Haven, CT, United States, 6Center for Neuroepidemiology and Clinical Neurological Research, Yale School of Medicine, New Haven, CT, United States
Synopsis
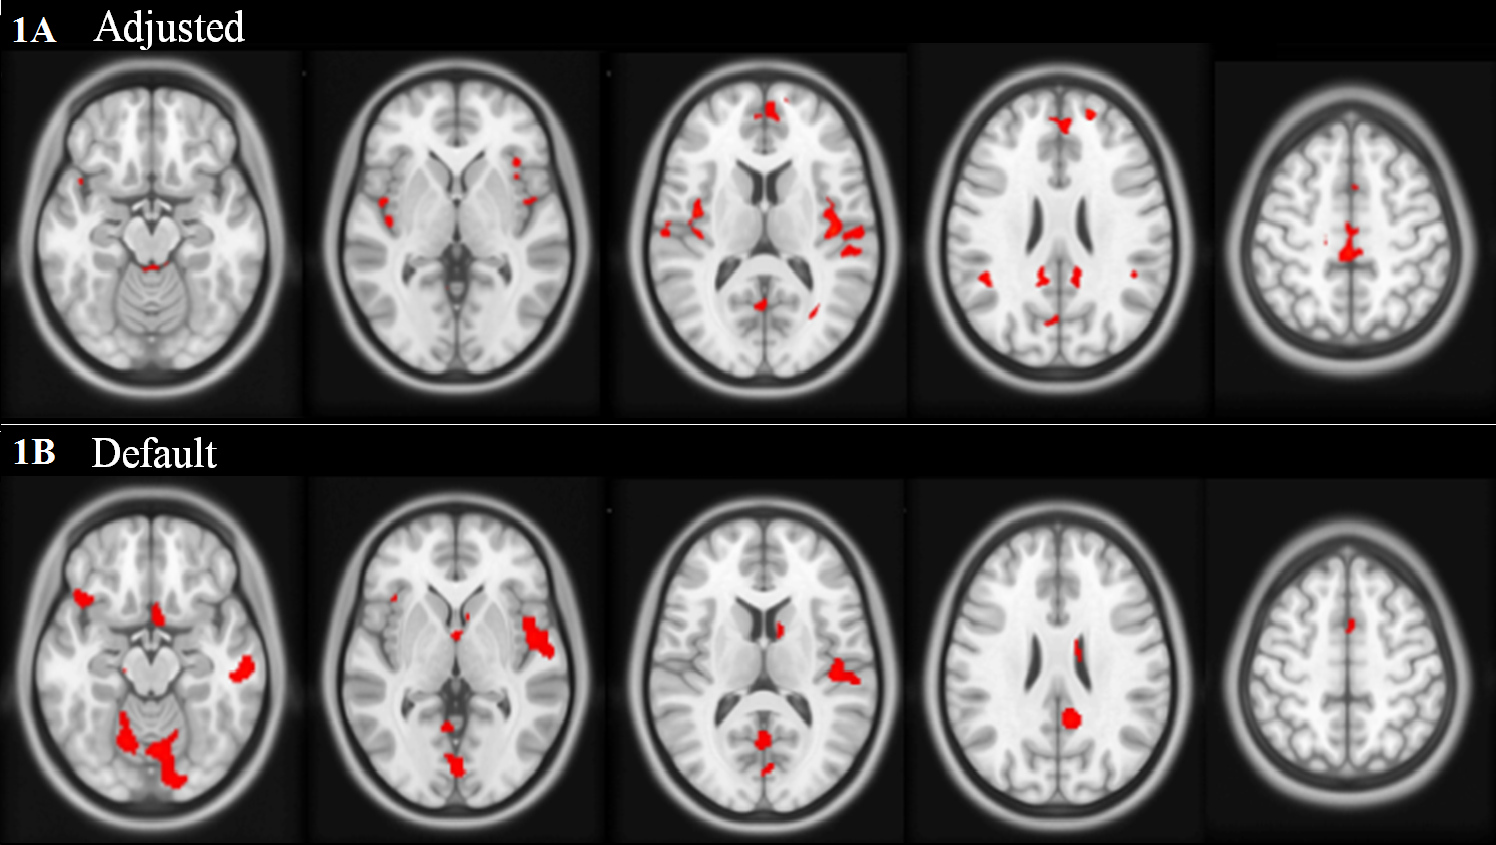
The use of a high resolution atlas for segmentation and normalization greatly improves the accuracy of voxel-based morphometry analysis of magnetic resonance images. An adjusted method including the high resolution atlas was compared to the default method with the standard resolution atlas in a case-control study on essential tremor to demonstrate the impact of higher resolution segmentation. After multiple comparison correction using extent cluster thresholding, the adjusted method showed bilaterally consistent results, while the default method showed some false positive results in peripheral regions of the brain. A high resolution atlas should be used to segment equally high resolution images.
Introduction
The measurement of gray matter (GM) volume loss has the potential to greatly aid in the diagnosis and tracking of disease progression for neurodegenerative diseases such as essential tremor (ET). Although standard processing procedures for measuring GM volume with Voxel-Based Morphometry (VBM) in Statistical Parametric Mapping (SPM) are outlined and updated by the authors1–3, they have not been updated to accommodate the recent advances in image quality. With the advent of higher resolution images, some modifications are needed to the standard processing methods in SPM to take advantage of the improved data resolution.Methods
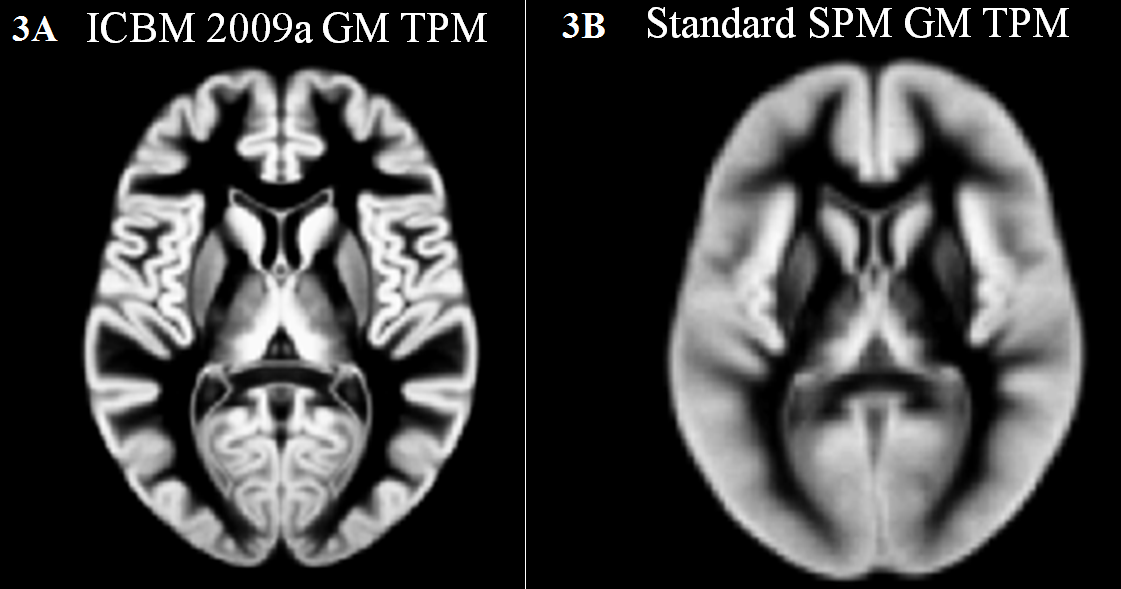
Magnetic Resonance Imaging (MRI) was acquired on 27 ET cases presenting with head tremor and 36 control subjects. MRI data was acquired on a 3T Siemens Tim Trio scanner (Siemens Healthcare, Erlangen, Germany) with a 32-channel head coil. For brain tissue segmentation, high resolution MPRAGE images were acquired (TR/TE/TI = 2300/2.91/900 ms, flip angle = 9°, bandwidth = 240 Hz/pixel, voxel size: 1.0 mm x 1.0 mm x 1.2 mm, GRAPPA = 2). Image processing was performed with the SPM12 software. Three VBM processing methods were performed on the same subject groups: Adjusted, Default, and DARTEL. Adjusted utilized the “old segment” and “old normalize” algorithms for their abilities to select alternate tissue probability maps (TPMs) and registration atlases. The ICBM (International Consortium for Brain Mapping) 2009a4,5 3D T1-weighted atlas and included TPMs were selected for their high resolution (1x1x1 mm3), which matches the resolution of the 3D T1-weighted images acquired in this study. Tissue maps were resampled to 1x1x1 mm3 resolution after segmentation. Additionally, the smoothing kernel was reduced to 4x4x4 mm3 FWHM to improve the detectability of GM volume loss, while still sufficiently improving signal to noise for statistical comparisons.6 Default used the same “old segment” and “old normalize” algorithms, but were run with all default settings intact, specifically with the standard SPM MNI atlas (MNI152). Tissue maps were resampled to 2x2x2 mm3 resolution and smoothed by an 8x8x8 mm3 FWHM kernel. This method represents how SPM would perform if no processing variables were changed upon starting the analysis. DARTEL used the processing algorithm recommended by SPM with all default values intact according to the VBM Tutorial.7 Multiple comparison correction was performed using extent cluster thresholding, which has been widely used in fMRI as a means of multiple comparison correction, which minimizes type I and type II errors.6,8,9Results
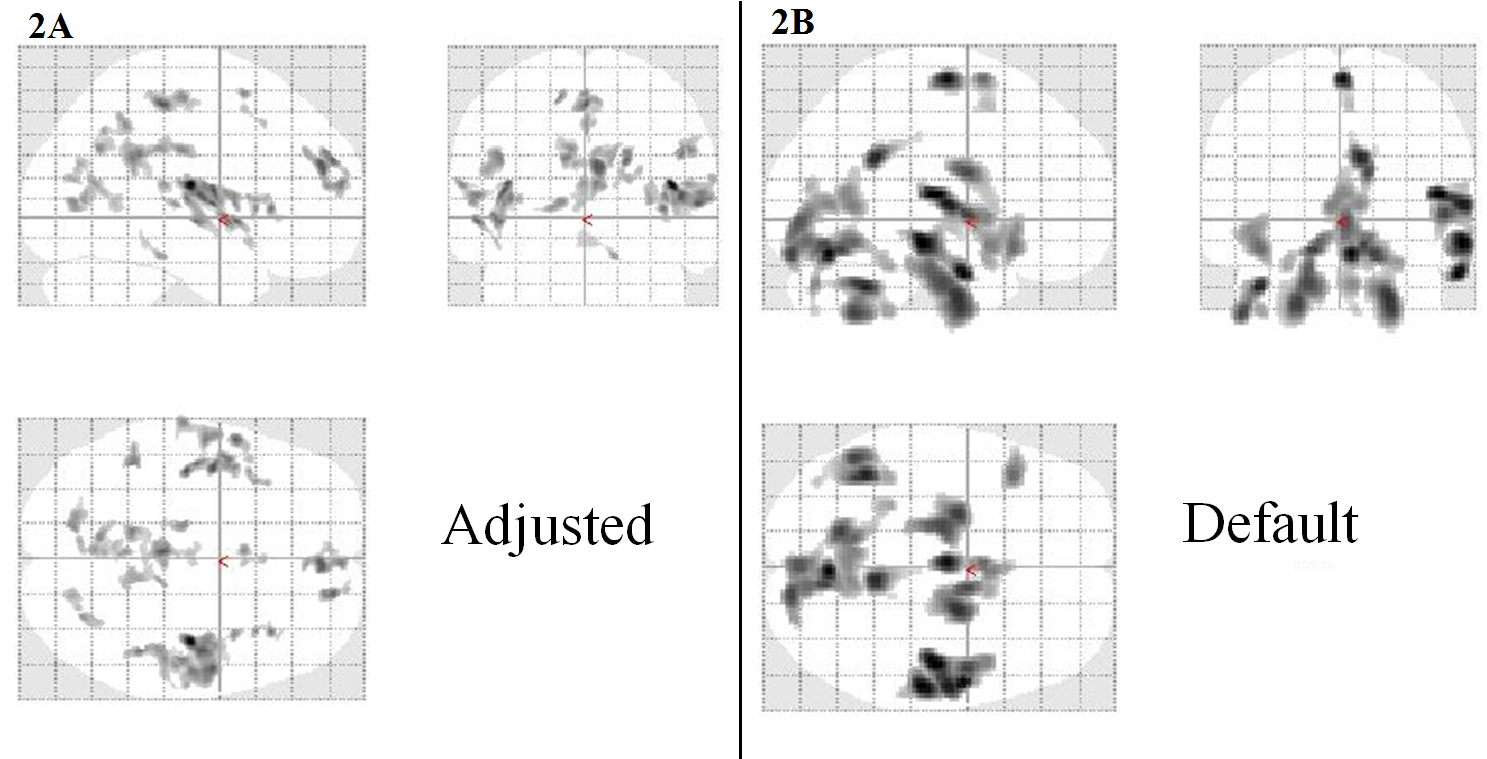
Adjusted and Default showed statistically significant GM volume loss in ET vs controls with a cluster corrected p-value < 0.05. Default showed a few similar regions as Adjusted, but also showed many significant clusters in boundary, cerebellar, and brain stem regions, typically associated with false positive results as they are often poorly registered compared to the cerebrum. Results are shown on axial slices of the ICBM 2009a atlas in figure 1 and in the SPM “glass brain” in figure 2. For example, Adjusted presented GM volume loss in the bilateral insula, whereas Default did not. DARTEL showed no significant results after multiple comparison correction.Discussion
Although the Adjusted and Default results are similar, the differences are important to note. Adjusted has a much higher resolution for the significant clusters compared to Default. This is due to the comparisons being performed on 1x1x1 vs 2x2x2 mm3 voxels, therefore, an 8 fold increase in resolution of statistical comparisons. The resolution of the GM TPMs can be easily seen in figure 3. This higher resolution comparison eliminates some partial volume effects and allows for a more precise measurement of GM volume, which in turn leads to more consistent detection. Cluster correction should be used on any VBM method in SPM, as it has been shown that FDR and Bonferroni corrections are too stringent. This is especially important as each voxel is, of course, not independent from the surrounding voxels. Cluster correction discards random Type I errors in single or even small clusters of voxels, while assuming that true positive results will be clustered together to show regions of volume change.6,8,9Conclusion
The Adjusted results have been deemed most accurate, as the regions of GM volume loss are not in boundary or cerebellar regions and are mostly bilateral as predicted. Default was shown to be similar to Adjusted, but presented with more seemingly false positive results. The inclusion of a high resolution atlas greatly improves the accuracy and detectability of GM volume loss in a disease population.Acknowledgements
I would like to thank my mentors and collaborators for their help and guidance.
This study was funded by the National Institute of Neurological Disorders and Stroke to E.D.L. (Grant #5R01NS085136).
References
1. Ashburner J, Friston KJ. Voxel-Based Morphometry—The Methods. Neuroimage. 2000;11(6):805-821. doi:10.1006/nimg.2000.0582.
2. Ashburner J, Friston KJ. Unified segmentation. Neuroimage. 2005;26(3):839-851. doi:10.1016/j.neuroimage.2005.02.018.
3. Ashburner J. Computational anatomy with the SPM software. Magn Reson Imaging. 2009;27(8):1163-1174. doi:10.1016/j.mri.2009.01.006.
4. Fonov V, Evans A, McKinstry R, Almli C, Collins D. Unbiased nonlinear average age-appropriate brain templates from birth to adulthood. Neuroimage. 2009;47:S102. doi:10.1016/S1053-8119(09)70884-5.
5. Fonov V, Evans AC, Botteron K, Almli CR, McKinstry RC, Collins DL. Unbiased average age-appropriate atlases for pediatric studies. Neuroimage. 2011;54(1):313-327. doi:10.1016/j.neuroimage.2010.07.033.
6. Friston KJ, Holmes a, Poline JB, Price CJ, Frith CD. Detecting activations in PET and fMRI: levels of inference and power. Neuroimage. 1996;4(3 Pt 1):223-235. doi:10.1006/nimg.1996.0074.
7. Ashburner J. VBM Tutorial. www.fil.ion.ucl.ac.uk/~john/misc/VBMclass10.pdf. Published 2010.
8. Friston KJ, Worsley KJ, Frackowiak RSJ, Mazziotta JC, Evans AC. Assessing the significance of focal activations using their spatial extent. Hum Brain Mapp. 1994;1(3):210-220. doi:10.1002/hbm.460010306.
9. Friston KJ, Holmes AP, Worsley KJ, Poline J-B, Frith CD, Frackowiak RS. Statistical parametric maps in functional imaging: a general linear model approach. Hum Brain Mapp. 1995;2:189-210. doi:10.1002/hbm.460020402.
Figures