3725
Tract based spatial statistics analysis of DKI metrics in type 2 diabetes patients1Institute of Neuroscience and Medicine – 4, Medical Imaging Physics, Forschungszentrum Jülich GmbH, Jülich, Germany, 2Department of Neurology, Faculty of Medicine, Aachen, Germany, 3Translational Medicine, RWTH Aachen University, JARA – BRAIN, Aachen, Germany, 4Forschungszentrum Jülich GmbH, Institute of Neuroscience and Medicine – 11, Jülich, Germany, 5Monash Biomedical Imaging, School of Psychological Sciences, Monash University, Melbourne, Victoria, Australia
Synopsis
In addition to cardiovascular risk factors, Type 2 diabetes mellitus (T2DM) is associated with microstructural, structural, functional, and metabolic changes in the brain. Patients with T2DM tend to develop cognitive impairment and dementia. In this study, we report differences between groups of T2DM patients and age-matched healthy volunteers by comparing diffusion tensor and diffusion kurtosis metrics using the tract-based spatial statistics (TBSS) method. We found that all diffusivities are larger and the axonal water fraction is reduced in the T2DM group compared to the controls. This suggests presence of more water in the extra-axonal space.
Introduction
Patients with Type 2 diabetes mellitus (T2DM) tend to develop cerebrovascular complications and exhibit higher risks for stroke, cognitive impairment and dementia.1,2 However, little information is available regarding changes in cerebral structural and functional connectivity, cognitive functions, and tissue microstructural properties in subjects with vascular risk factors. In particular, it is not yet clear, whether there are specific structural changes involved in cases of diabetes, high cholesterol and/or high blood pressure, and what are the underlying mechanisms of association between these factors and vascular cognitive impairment. Recently, diffusion tensor imaging (DTI) and its more advanced extension, diffusion kurtosis imaging (DKI), have shown abnormal increases in diffusivity parameters and decreases in fractional anisotropy (FA) and mean kurtosis (MK) in patients with T2DM compared to healthy controls.3,4,5
The overall aim of this research is to extend current knowledge about brain tissue microstructure in T2DM and to investigate its relation with clinical and cognitive scores, as well as genetic and environmental factors in a large-scale “1000Brains“ study5 using DKI. Here, we report the first results of comparing diffusion tensor and diffusion kurtosis metrics in a subset of T2DM patients and age-matched healthy volunteers with the help of the tract-based spatial statistics (TBSS) method.6Methods
Two groups containing 41 (32M/9F) healthy volunteers of age 63±6.4 and 52 (39M/12F) T2DM patients of age 68±5.9 were selected. Criteria for selection of healthy volunteers were no reported central nervous system disease, non-diabetics, no hypertension, no medication intake, BMI less than 25 and lipid spectra in the normal range. All subjects underwent image acquisition following prior, written informed consent.
In vivo DKI acquisitions were performed at a 3T Siemens MAGNETOM Tim-Trio scanner equipped with body coil for RF transmission and 12-channel phased coil for signal reception. The gradient system provided a maximal gradient strength of 40 mT/m and slew rate of 200 T/m/s. Diffusion-weighted (DW) images were acquired using a double spin-echo EPI pulse sequence. Protocol parameters were: b-values = 0 (10 averages), 1000 (60 directions) and 2700 (120 directions); TR=6300/10900 ms, TE=81/112 ms for b-values 1000 and 2700 respectively, bandwidth=1628 Hz/px. The voxel size was 2.4x2.4x2.4 mm3.
Data preprocessing included subject motion and eddy current distortion corrections7 using FSL. Bias reduction due to rectified background noise was performed using the power images method.8 DKI data analysis was performed using the toolkit ExploreDTI.9 Diffusion tensor (DT) parameters (mean (MD), axial (AD) and radial (RD) diffusivities, FA) and KT parameters (mean (MK), axial (AK) and radial (RK) kurtosis and kurtosis anisotropy (KA)10,11 were subsequently obtained for the whole brain. Furthermore, DKI-derived white matter model (WMM) metrics were also analysed.12 For TBSS, voxel-wise analysis was performed using non-parametric testing with 5000 permutations available in FSL.6Results
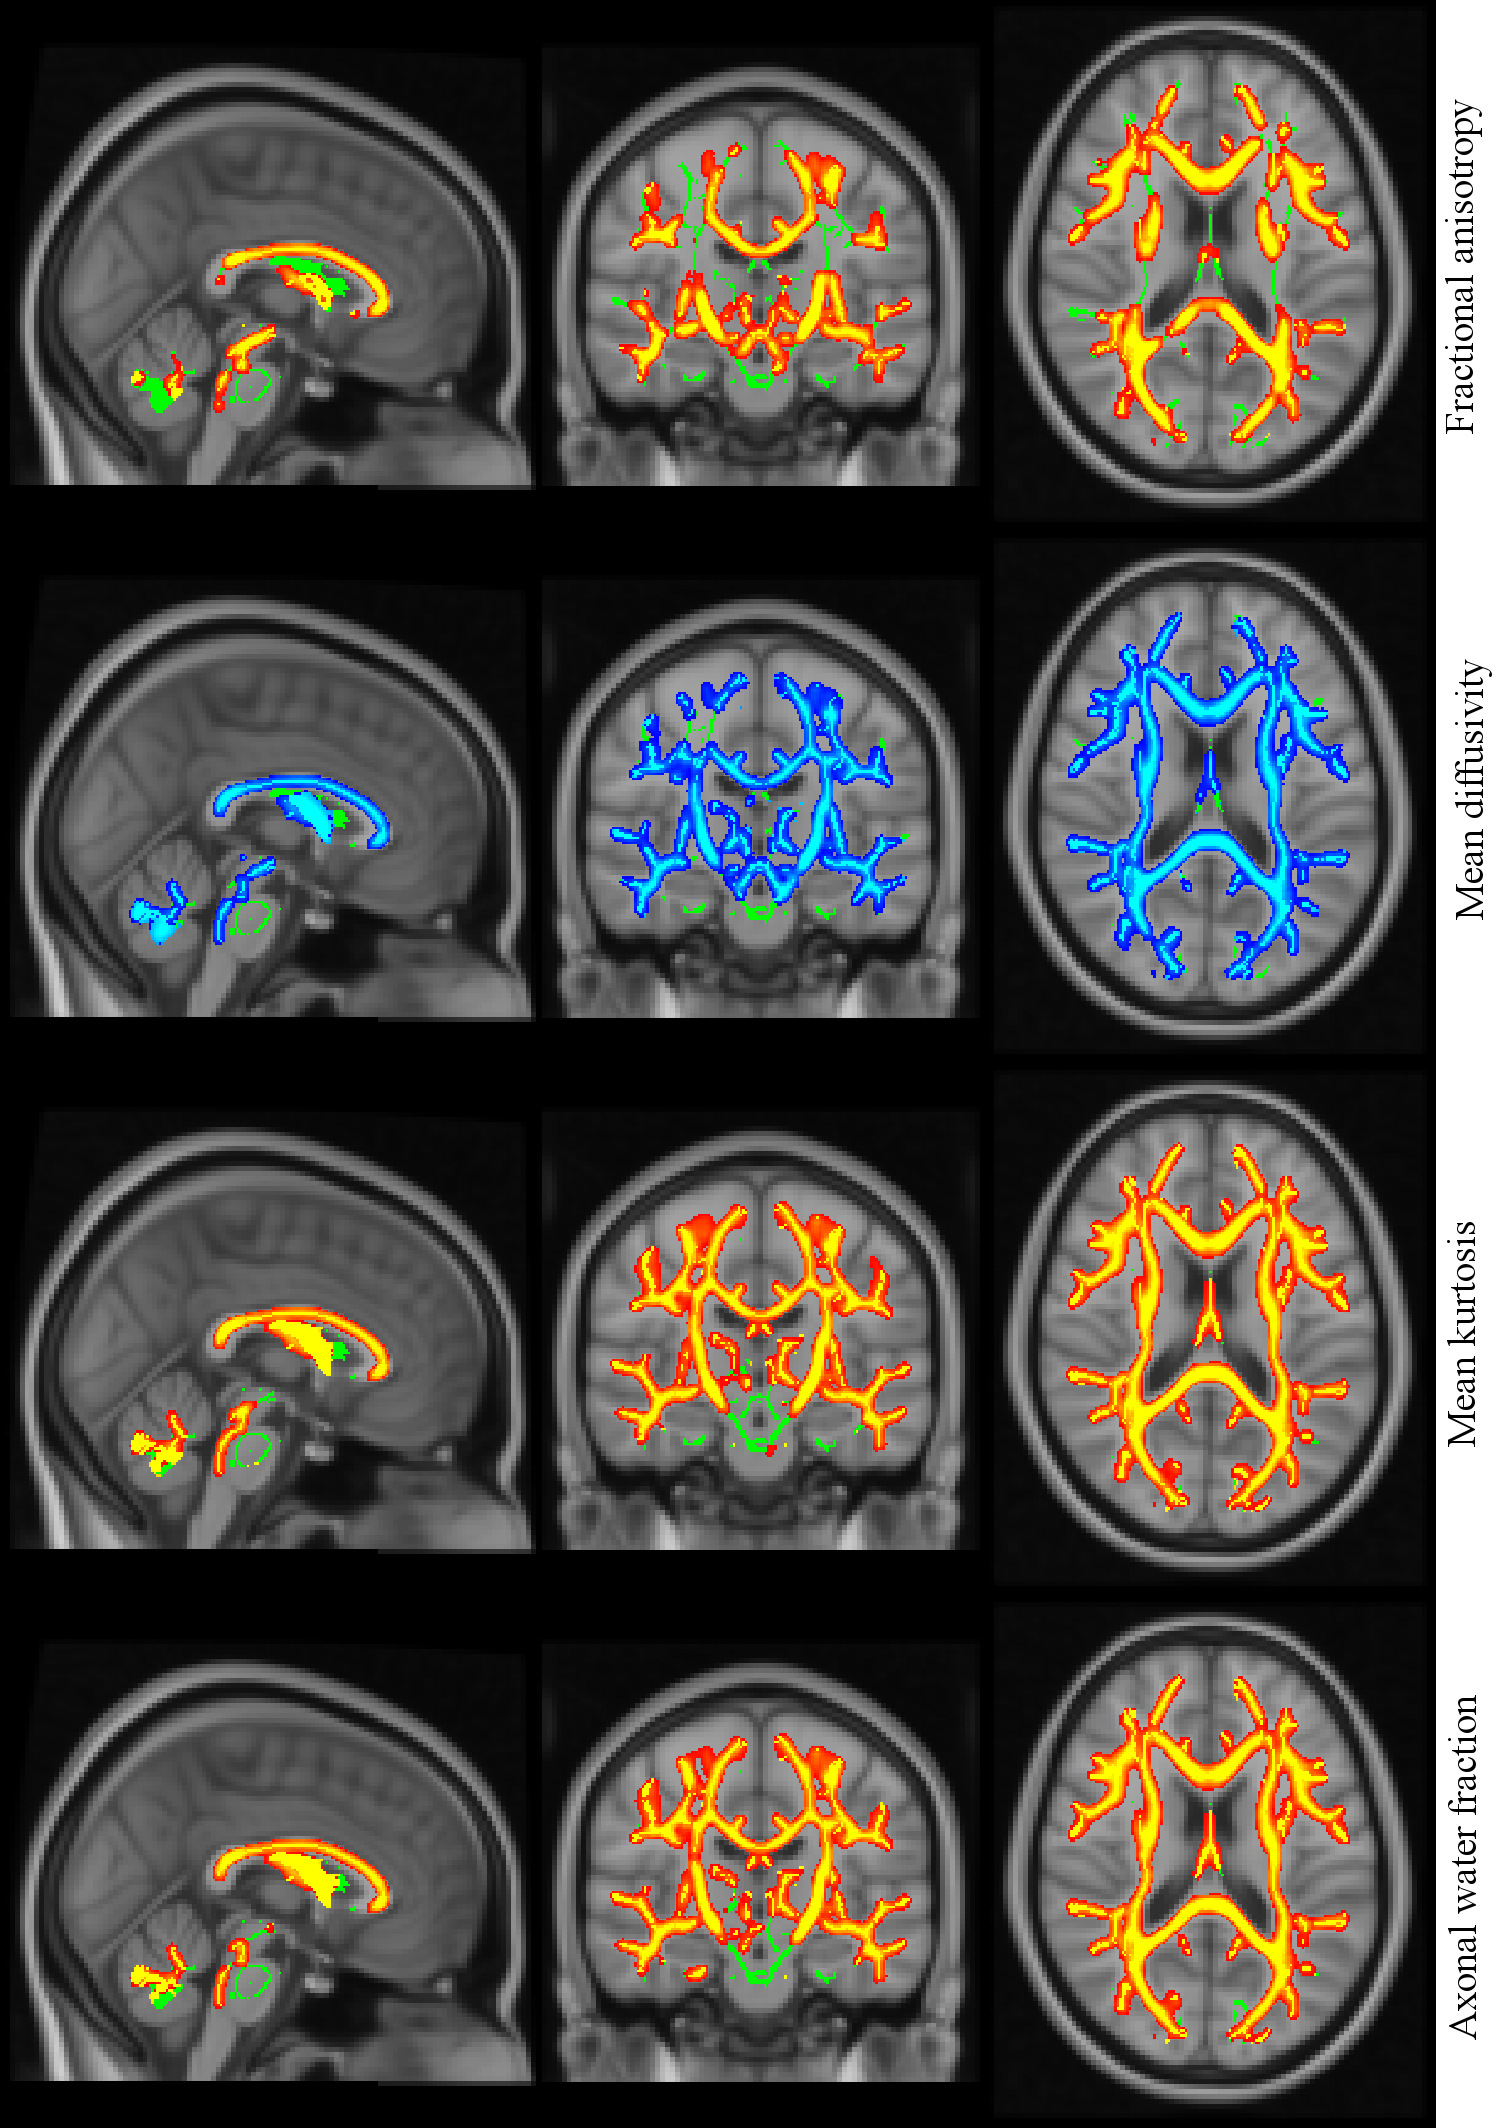
TBSS analysis revealed significant (p<0.05) between-group differences in all DT and DK metrics. Whole-brain skeleton and region of significant differences in some selected parameters, e.g., FA, MK, MD, and axonal water fraction (AWF) overlaid on a T1-weighted brain template are shown in Fig. 1. Between-group FA differences were significantly larger in the healthy group than in T2DM group almost everywhere in the white matter skeleton. Furthermore, widespread between-group differences in MK, MD and AWF metrics were observed nearly everywhere in the whole-brain skeleton. MK and AWF metrics were larger and MD metric was smaller in healthy group than in T2DM group everywhere in the white matter skeleton.
Discussion
We found all diffusivities to be larger in T2DM patients compared to healthy volunteer group in contraposition with FA, which is lower in the T2DM group than in controls. These findings are in line with the literature. 4,13,14 Kurtosis metrics on the other hand all show significantly lower values in the T2DM group than in controls.
While DKI is an empirical method, more specific inferences regarding the biophysical underpinnings can be obtained by connecting DKI parameters to geometrical features of specific cellular organisation, i.e., to biophysical models, such as WMM.13 In particular, our finding of the reduction of AWF in the T2DM group suggests that more water is found in the extra-axonal space. This likely can be due to vasogenic type of cerebral oedema, a shift of water from the intra axonal space to the extra axonal space, which causes local swelling and is most likely a reason for already reported low-grade inflammation in T2DM.15,16
Conclusion
DTI/DKI parameters reveal the potential to provide sensitive biomarkers of systematic abnormalities in global WM of T2DM patients and to enable inferences in underlying biophysical mechanisms.
Acknowledgements
No acknowledgement found.References
[1]. Ergul A. et al.: Cerebrovascular Complications of Diabetes: Focus on Stroke. Endocr Metab Immune Disord Drug Targets, 2012.
[2]. Zhou H. et al.: Progress on diabetic cerebrovascular diseases. Bosn J Basic Med Sci., 2014.
[3]. Xiong Y. et al.: A Diffusion Tensor Imaging Study on White Matter Abnormalities in Patients with Type 2 Diabetes Using Tract-Based Spatial Statistics. Neuroradiology, 2016.
[4]. Hsu JL et. al.: Microstructural white matter abnormalities in type 2 diabetes mellitus: a diffusion tensor imaging study. Neuroimage, 2012.
[5]. Xie Y. et al.: White Matter Microstructural Abnormalities in Type 2 Diabetes Mellitus: A Diffusional Kurtosis Imaging Analysis. Neuroradiology, 2017.
[5]. Caspers S et.al.: Studying variability of human brain aging in a population-based German cohort – Rationale and study concept of 1000BRAINS. Frontiers in Aging Neuroscience, 2014.
[6]. Smith et al.: Tract-based spatial statistics: Voxelwise analysis of multi-subject diffusion data. Neuroimage, 2006.
[7]. Behrens et al.: Characterization and propagation of uncertainty in diffusion-weighted MR imaging. Magn Reson Med., 2003.
[8]. Miller et al.: The use of power images to perform quantitative analysis on low SNR MR images. Magn Reson Imaging, 1993.
[9]. Leemans et al.: ExploreDTI: a graphical toolbox for processing, analyzing, and visualizing diffusion MR data. Mag Reson Med, 2009.
[10]. Grinberg et al.: Diffusion kurtosis metrics as biomarkers of microstructural development: A comparative study of a group of children and a group of adults, Neuroimage, 2017.
[11]. Poot et al.: Optimal experimental design for diffusion kurtosis imaging. IEEE Trans. Med. Imaging, 2010.
[12]. Fieremans et al.: White matter characterization with diffusional kurtosis imaging. Neuroimage, 2011.
[13]. Yu et al.: White matter microstructural abnormalities in amnestic mild cognitive impairment: A meta-analysis of whole-brain and ROI-based studies. Neubiorev, 2017.
[14]. Kelly et al.: Widespread white matter microstructural differences in schizophrenia across 4322 individuals: results from the ENIGMA Schizophrenia DTI Working Group. Mol Psychiatry, 2017.
[15]. Prasad, S. et al.: Diabetes Mellitus and Blood-Brain Barrier Dysfunction: An Overview. J Pharmacovigil, 2014.
[16]. Chung, C. et al.: Inflammation-associated declines in cerebral vasoreactivity and cognition in type 2 diabetes. Neurology, 2015.
Figures