3724
Global Cerebral Metabolic Rate of Oxygen in Older People: Gender Differences1Department of Radiology, University of Pennsylvania, Philadelphia, PA, United States, 2Department of Neurology, University of Pennsylvania, Philadelphia, PA, United States
Synopsis
Cerebral metabolic rate of oxygen (CMRO2) has been reported to vary as a function of age and gender. Here, we re-examined possible gender differences as part of an ongoing study in people over the age of 60 years by means whole-brain MR oximetry. Data corroborate earlier findings that cognitively normal females appear to have higher CMRO2 than their male peers. This difference may be largely due to greater oxygen extraction rather than changes in cerebral blood flow. Possible biological causes of this gender bias will need detailed scrutiny, as do the underlying physiologic assumptions that may impact the results.
INTRODUCTION
There is evidence suggesting that brain oxygen (O2) metabolism increases with age and that the rate of change differs between genders (1). Reported values of venous oxygen saturation (SvO2) and cerebral blood flow rate, CBF (measured with TRUST and phase contrast) were found to be higher in women across all ages, as was CMRO2 (1,2). As part of an ongoing study designed to understand neurocognitive function in cognitively normal older adults and those in the cognitively impaired spectrum, we have measured whole-brain CMRO2 by MR susceptometry and compared the results between gender as well as between cognitively impaired and healthy participants.METHODS
Total cerebral metabolic rate of oxygen (CMRO2) can be estimated from Fick’s principle:
$$CMRO_2=C_a\cdot CBF\cdot (S_aO_2-S_vO_2)\space\space\space\space\space\space\space\space\space\space [1] $$
Here, Ca is the blood O2 carrying capacity in units of µmol O2/dL blood (Ca=59.8 µmol O2/g Hb·[Hb], where [Hb] is the blood hemoglobin concentration in g/dL blood), CBF is cerebral blood flow rate in mL min-1/100g tissue, and SaO2-SvO2 is the arterio-venous difference in oxygen saturation in %HbO2. CMRO2 was quantified by simultaneously measuring SvO2 in the superior sagittal sinus (SSS) via susceptometry-based oximetry and CBF in the arteries supplying the brain (internal carotid and vertebral arteries) with PC-MRI at the neck level (3). Venous oxygen saturation was estimated as:
$$S_vO_2=[1-\frac{2|\Delta\phi|}{\gamma\chi_{do}\Delta TE \cdot{B_0}(\cos^2\theta-1/3)Hct}]\space\space\space\space\space\space\space\space\space\space [2]$$
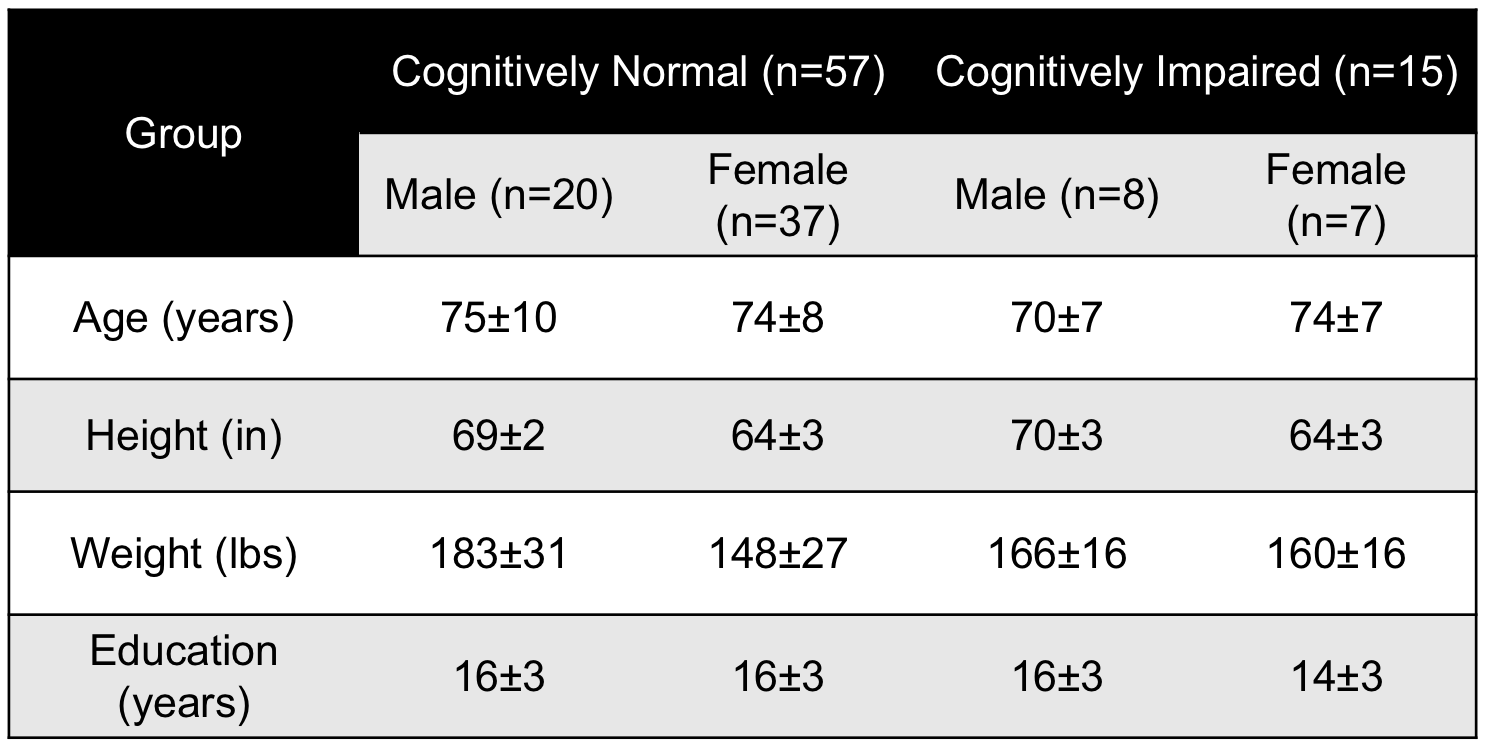
where Δφ is the average phase difference between intravascular blood and the surrounding tissue, χdo is the susceptibility difference between fully deoxygenated and fully oxygenated blood, ΔTE is the inter-echo spacing, θ is the angle of the SSS with respect to B0 and Hct is the hematocrit (4). Data were acquired at 3T (Prisma Siemens) with an OxFlow sequence, which alternates measurement of oxygen saturation in the SSS and flow at the neck level in an interleaved manner. Imaging parameters: TR=35ms, TE1/TE2=3.52/7.04ms, FOV=208×208mm2, voxel size at SSS level=1×1×5mm3, voxel size at neck level=0.85×0.85×5mm3, FASSS=25°, FANECK=20°, VENCNECK=60cm/s, duration 1:06mins. CBF was normalized per 100g of brain tissue, estimated from an MP-RAGE-based measurement of brain volume, which was quantified as the sum of gray and white matter structures (excluding CSF). SaO2 was assumed to be 98% and Hct levels used were population averages (5). Fifty-seven cognitively normal (mean age±SD=74±8years, 28 males) and fifteen cognitively impaired (mean age±SD=74±9years, 7 male) participated in the study (see Table for demographics). All cases were classified based on consensus after annual visits, which include a clinical evaluation and standard psychometric measures as prescribed by the National Alzheimer’s Coordinating Center (NACC). In order to investigate differences in SvO2, CBF and CMRO2 between cognitively impairment groups and gender data were examined using a 2-way ANOVA and post-hoc tests.
RESULTS
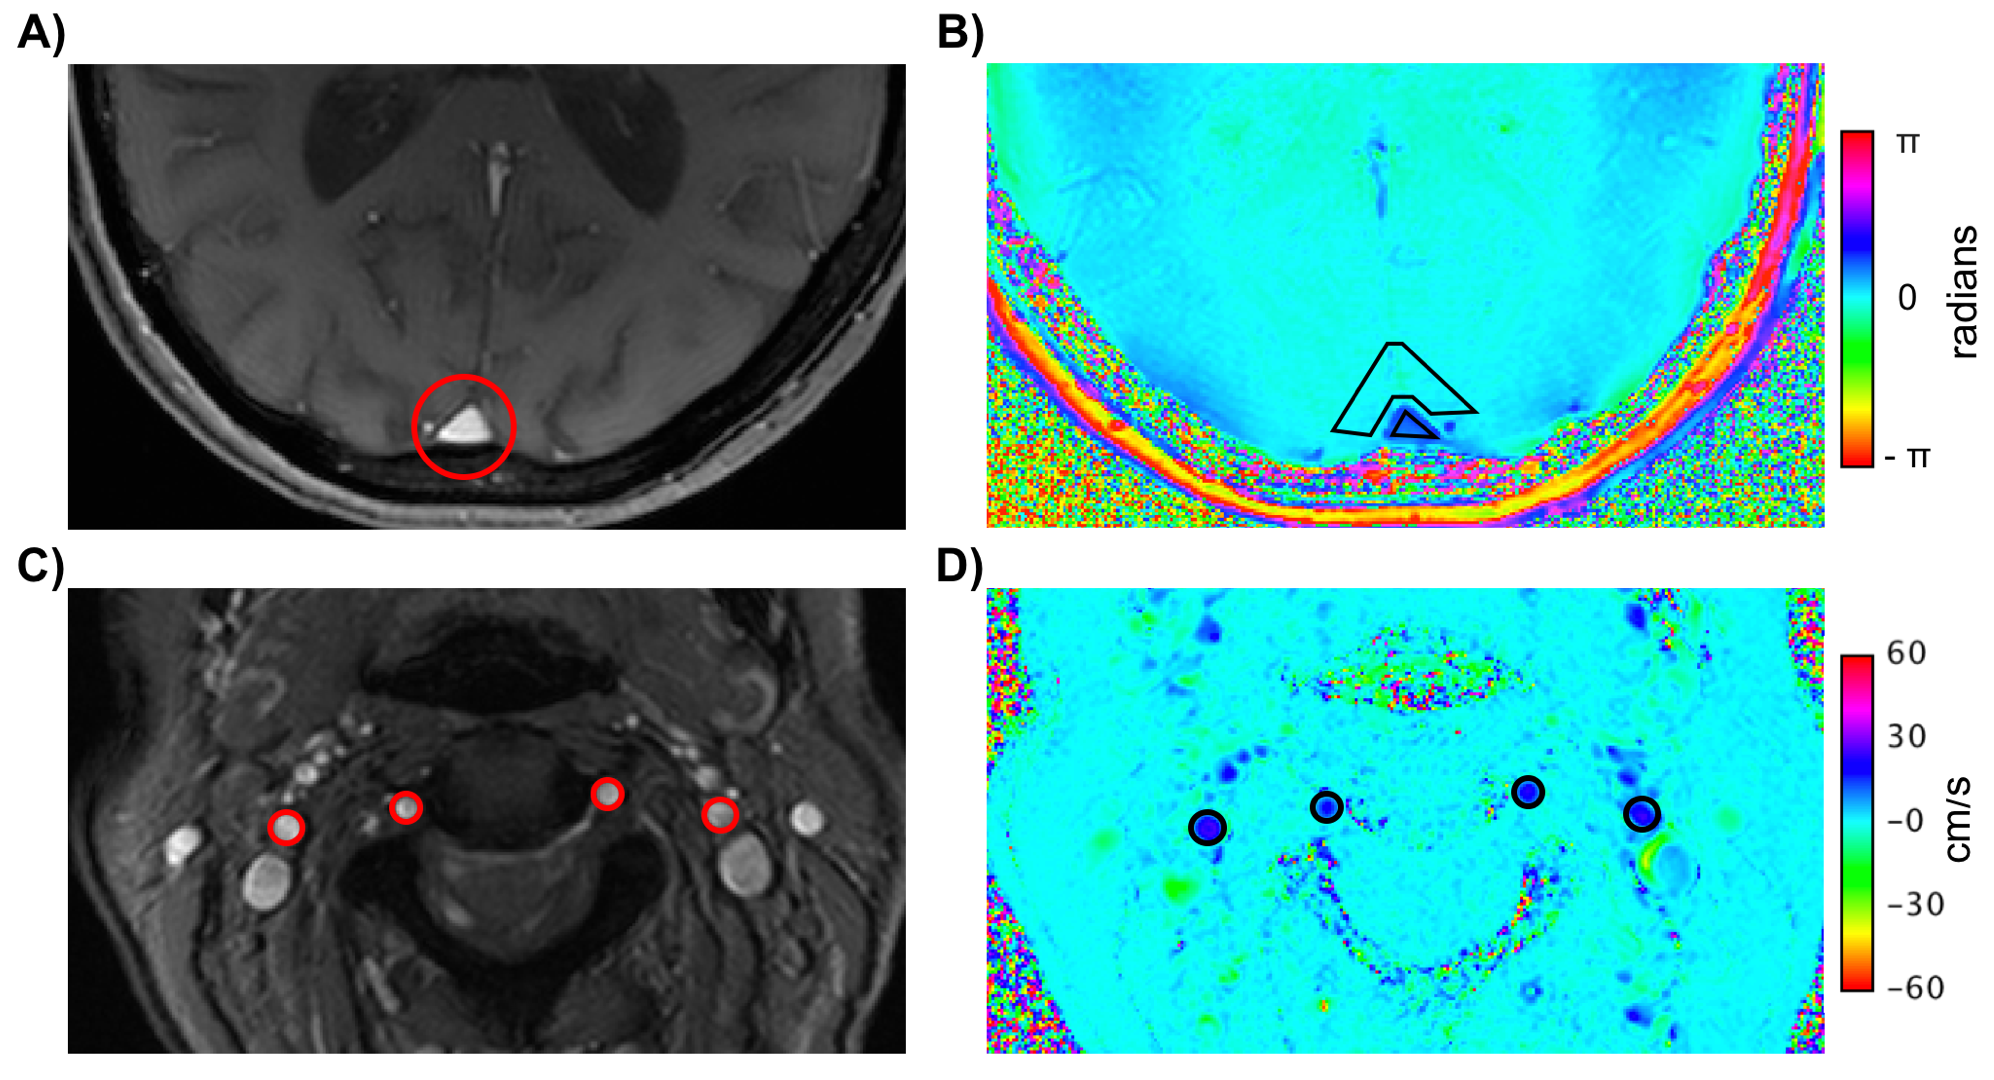
An example dataset is shown in Figure 1. Brain mass was found to be significantly smaller in females than males (1025±111g vs 1113±125g, p=0.008), while CBF values did not differ between genders (45±8.6 vs 44±6.9 mL/100g/min, p=0.6). There was a significant interaction (p<0.033) between gender and group in CMRO2. Post-hoc tests confirmed that in the cognitively normal group CMRO2 was higher in females than in males (99±32 vs 77±36, p=0.022), but not in the cognitively impaired group. No differences were found between cognitively impaired and normal groups. Further, no correlations between any of the measured parameters and age (all R2<0.1, all p>0.7) were observed.DISCUSSION AND CONCLUSIONS
The results presented here suggest older females to have higher CMRO2 than their male peers in agreement with the study by Lu et al (1) (which covered the entire adult age range). Here, we found CBF not to be different between genders for our much narrower subject age range. The observed CMRO2 gender difference appears to be driven by differences in SvO2 (60±12 vs 69±12, F vs M, p=0.078). Of note also is that Lu et al used TRUST (2) while the present study is based on susceptometry. Other distinguishing protocol features relate to hemoglobin concentration, which affects Ca (Eq. 1). Here we used age and gender-specific values (4) rather than regarding the latter as a constant, but it would be preferable to measure Hb concentration individually in future studies. The lack of observed differences in CMRO2 in the present work between cognitively impaired and normal subjects may be due to the wide range of cognitive conditions affecting the former group but also to inadequate power.Acknowledgements
P30-AG010124, RO1 HL122754.References
1. Lu H, Xu F, Rodrigue KM, Kennedy KM, Cheng Y, Flicker B, Hebrank AC, Uh J, Park DC. Alterations in cerebral metabolic rate and blood supply across the adult lifespan. Cerebral Cortex. 2011;21:1426-1434.
2. Lu H, Xu F, Grgac K, Liu P, Qin Q, van Zijl P. Quantitative evaluation of oxygenation in venous vessels using T -relaxation-under-spin-tagging MRI. Magn Reson Med. 2008;60:357-63.
3. Jain V, Langham MC, Wehrli FW. MRI estimation of global brain oxygen consumption rate. J Cereb Blood Flow Metab. 2010;20:1598-1607.
4. Fernandez-Seara MA, Techawiboonwong A, Detre JA, Wehrli FW. MR susceptometry for measuring global brain oxygen extraction. Magn Reson Med. 2006;55:967-73.
5. Mahlknecht U, Kaiser S. Age-related changes in peripheral blood counts in humans. Experimental and Therapeutic Medicine. 2010;1:1019-1025.
Figures