3723
Quantitative MRI comparison of neurological and hepatic forms of Wilson disease1MR-Unit, Dept. Diagnostic and Interventional Radiology, Institute for Clinical and Experimental Medicine, Prague, Czech Republic, 2Dept Neurology and Center of clinical Neuroscience, Charles University, 1st Faculty of Medicine and General University Hospital, Prague, Czech Republic, 3Wellcome Centre for Human Neuroimaging, UCL Institute of Neurology, University College London, London, United Kingdom, 44th Dept. Internal Medicine, Charles University, 1st Faculty of Medicine and General University Hospital, Prague, Czech Republic
Synopsis
We examined 40 patients with neurological and hepatic form of Wilson disease by susceptibility mapping at 3T and T1 and T2 relaxometry at 1.5T and 3T. We were able to distinguish patients with neurological form from hepatic form and healthy controls based on quantitative relaxometry and susceptibility mapping. Higher susceptibility observed in the globus pallidus, putamen, and caudate nucleus in patients with neurological form corresponds to higher iron content while higher susceptibility in the thalamus corresponds rather to demyelination.
Introduction
Wilson disease (WD) is an autosomal recessive disorder caused by mutation of ATP7B characterized by gradual accumulation of copper in the body, especially in the liver and brain. WD exists in two clinical forms: hepatic (hep-WD) that manifests with liver symptoms and neurological (neuro-WD) that manifests primarily with neurological and psychiatric symptoms.
Abnormal cerebral deposition of paramagnetic iron compounds in neuro-WD patients detectable as increased susceptibility in the deep gray matter (DGM) has been described. However, pathological changes in neuro-WD include also demyelination which leads to increased tissue susceptibility and therefore affect tissue iron estimates. Change in T2 relaxation time measured at two magnetic fields was suggested as a sensitive measure of tissue paramagnetic content driven predominantly by ferritin concentration.1 The goal of this study was to compare differences in quantitative susceptibility and field changes of T2 and T1 relaxometry in the DGM nuclei in WD patients with neurological and hepatic form.
Patients & Methods
40 patients with genetically confirmed WD on a stable anti-copper treatment (30 with neuro‑WD: 15f/15m, 28-64 years; 10 with mild hep-WD: 5f/5m, 19-52 years), and 26 healthy controls (14f/12m, 24-68 years) were investigated. All patients were examined using the neurologic subscore of Unified Wilson Disease Rating Scale (UWDRS). In the neuro-WD group, mean disease duration was 17.2 (1-46) years and UWDRS was 22.8 (1-56). In the hep-WD group, mean disease duration was 15.7 (1-27) and UWDRS was 3.2 (0-10).
For MRI, 1.5T and 3T MR scanners with birdcage head coils were used. A standard MRI examination protocol at 3T was supplemented by susceptibility mapping and T1/T2 relaxometry. 1.5T system was used for T1 and T2 relaxometry with the same geometry as at the 3T system.
Relaxometry: a CPMG sequences (TR=3000 ms; 32 echoes with TE step 8.3 ms at 3T and 6.9 ms at 1.5T; voxel size 0.8×0.8×5 mm) for T2 maps calculation were used. T1 maps were measured by Inversion Recovery sequences (3T: TR/TE=5000/1.49 ms; 1.5T: TR/TE=5000/1.51 ms; FA=35°) with 10 values of TI (250-4000 ms) at 3T and 9 TI values (300-4000 ms) at 1.5T. Relaxation maps and times in selected ROIs were calculated using a home-made program VIDI.2 Globus pallidus (GP), putamen (Put), caudate nucleus (CN) and thalamus (Th) in the left and right hemispheres were evaluated.
Quantitative susceptibility mapping: QSM maps were reconstructed from a 3D multi gradient recalled echo (GRE) sequence (TR=40 ms; six TEs between 5.22 and 34.64 ms; FA=15°; voxel resolution = 0.8×0.8×2 mm; BW=450 Hz/pixel). Phase images were reconstructed offline using a virtual reference coil approach.3 Mean QSM values normalized to the occipital white matter reference region were calculated in GP, Put, CN, and Th.
Data were analyzed using PRISM software by multiparametric tests. The p<0.05 was considered significant.
All subjects were informed about the study protocol and signed informed consent approved by the local ethical committee.
Results
Significantly higher susceptibility values were found in all studied regions (GP, Put, CN, Th) in neuro-WD patients compared to controls and hep-WD patients (p<0.02). No difference was found between hep-WD patients and controls.
T2 relaxation time at 3T was significantly lower in neuro-WD group in GP, Put, and CN compared to controls and hep-WD, whereas T2 relaxation time in hep-WD did not differ from controls in any of the observed regions. T1 relaxometry revealed higher T1 values in the thalamus in neuro-WD group compared to both controls and hep-WD patients (p<0.02). No other significant differences were observed.
Field dependent change (1.5T vs. 3T) of T2 relaxation time inversely correlated with quantitative susceptibility in GP across all groups, in Put in controls and hep-WD only, and in CN inverse correlation was only found in the hep-WD group. Field dependent change in T1 relaxation time positively correlated with susceptibility in Th in both patient groups and in the putamen in hep-WD group (Table 1).
Conclusion
We were able to distinguish
neuro-WD patients from hep-WD patients and healthy controls
based on quantitative relaxometry and susceptibility mapping. Higher
susceptibility observed in all DGM nuclei in neuro-WD patients was corroborated by decreased T2 relaxation time in the Gp, Put, and NC, suggesting that it is caused predominantly by higher iron content in
these nuclei. The pattern of quantitative MR metric in the thalamus in the neuro-WD group corresponds rather to demyelination which leads to higher susceptibility due to decreased tissue diamagnetic contribution and to T1 relaxation time prolongation due to lipid loss.
Acknowledgements
The study was supported by Ministry of Health of the Czech Republic: AZV 15-25602A and Institutional support 00023001 IKEM. JAC is supported by core funding from the Wellcome [203147/Z/16/Z].References
1. Bartzokis G, Aravagiri M, Oldendorf WH, et al. Magn Reson Med 1993; 29(4):459-64.
2. Herynek V, Wagnerova D, Hejlova I, et al. J Magn Reson Imaging 2012;35(6):1332-7.
3. Parker DL, Payne A, Todd N, Hadley JR. Magn Reson Med 2014; 72(2): 563-9.
Figures
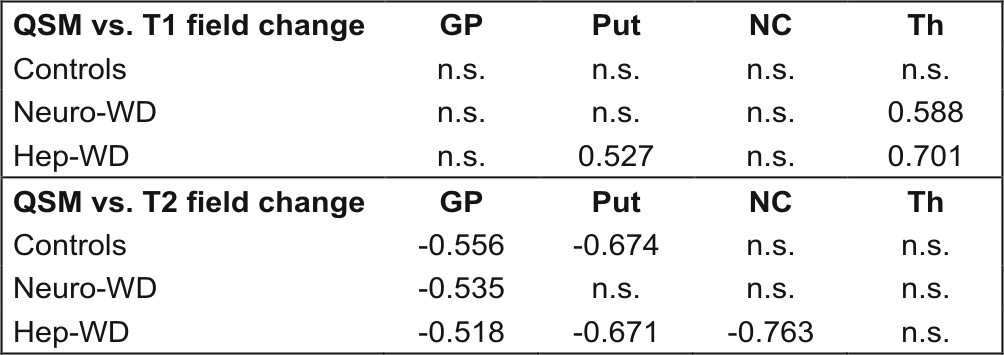
Table. Pearson r coefficients between susceptibility values measured by QSM at 3T and field changes of relaxation times T1 or T2, respectively, in different brain structures.
GP - globus pallidus, Put - putamen, CN - caudate nucleus, Th – thalamus.
r values -0.500 > r > 0.500 were considered significant.