3722
Altered Dynamic Functional Connectivity in the Default Mode Network in Patients with Cirrhosis and Minimal Hepatic Encephalopathy1Fujian Medical University Union Hospital, Fuzhou, China
Synopsis
Altered Dynamic Functional Connectivity in Default Mode Network in Minimal Hepatic Encephalopathy
Introduction
Minimal hepatic encephalopathy (MHE), which is considered the initial phase in the spectrum of hepatic encephalopathy (HE), is characterized by mild neuropsychological and neurophysiological alterations that are not detectable by routine clinical examination [1]. Despite being a subclinical stage, MHE is considered clinically relevant since it reduces a patient’s health-related quality of life, leads to development of overt HE, and is associated with poor outcome [2-4].
Resting-state fMRI studies have demonstrated that MHE patients show altered brain intrinsic functional connectivity (FC), which plays an important role in MHE-related mechanisms. For example, significant FC reduction within the default mode network (DMN) has been revealed in cirrhotic patients with MHE and is associated with cognitive impairment as well as HE development [5]. Furthermore, a correlation was observed between disrupted DMN connectivity and hyperammonemia, which is the core neuropathophysiology of MHE [6]. In addition to abnormalities in the DMN, altered FC has been observed in many other brain intrinsic networks such as attention and visual networks [7]. Also, altered topological properties of whole-brain networks have been revealed in MHE [8].
Although these studies have greatly advanced our understanding of changes in the large-scale functional organization of the brain in MHE, it is notable that all previous findings were obtained using traditional resting-state connectivity analysis, which is based on the implicit assumption that FC during the recording period is relatively static. However, this assumption of stationarity is inconsistent with the fact that the brain is highly dynamic [9]. For example, temporal variations in brain intrinsic FC have been demonstrated by an increasing number of task-related and resting-state functional MRI studies [9; 10]. Thus, static connectivity analysis is not sufficient to evaluate brain functions in both healthy and diseased cases.
Recently, increasing attention has focused on time-varying properties of brain FC. These studies have yielded promising results for extending our understanding of brain function [10; 11] and exploring the neural bases of dysfunction in several neuropsychological diseases such as Alzheimer’s disease [12], schizophrenia [13], and epilepsy [14]. However, the dynamic FC (dFC) characteristics remain largely unknown in MHE patients. In this study, we aimed to identify changes in dFC within the DMN in cirrhotic patients with MHE, which may provide new insight into MHE-related pathophysiology.
Methods
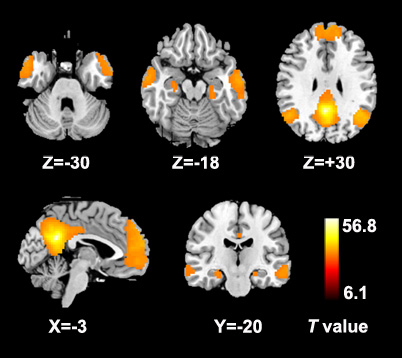
Resting-state functional MRI data were acquired from 20 cirrhotic patients with MHE and 24 healthy controls. DMN seed-regions were defined using seed-based FC analysis (centered on the posterior cingulate cortex (PCC)) (Figure 1). Dynamic FC architecture was calculated using a sliding time-window method. K-means clustering (number of clusters = 2–4) was applied to estimate FC states.Results
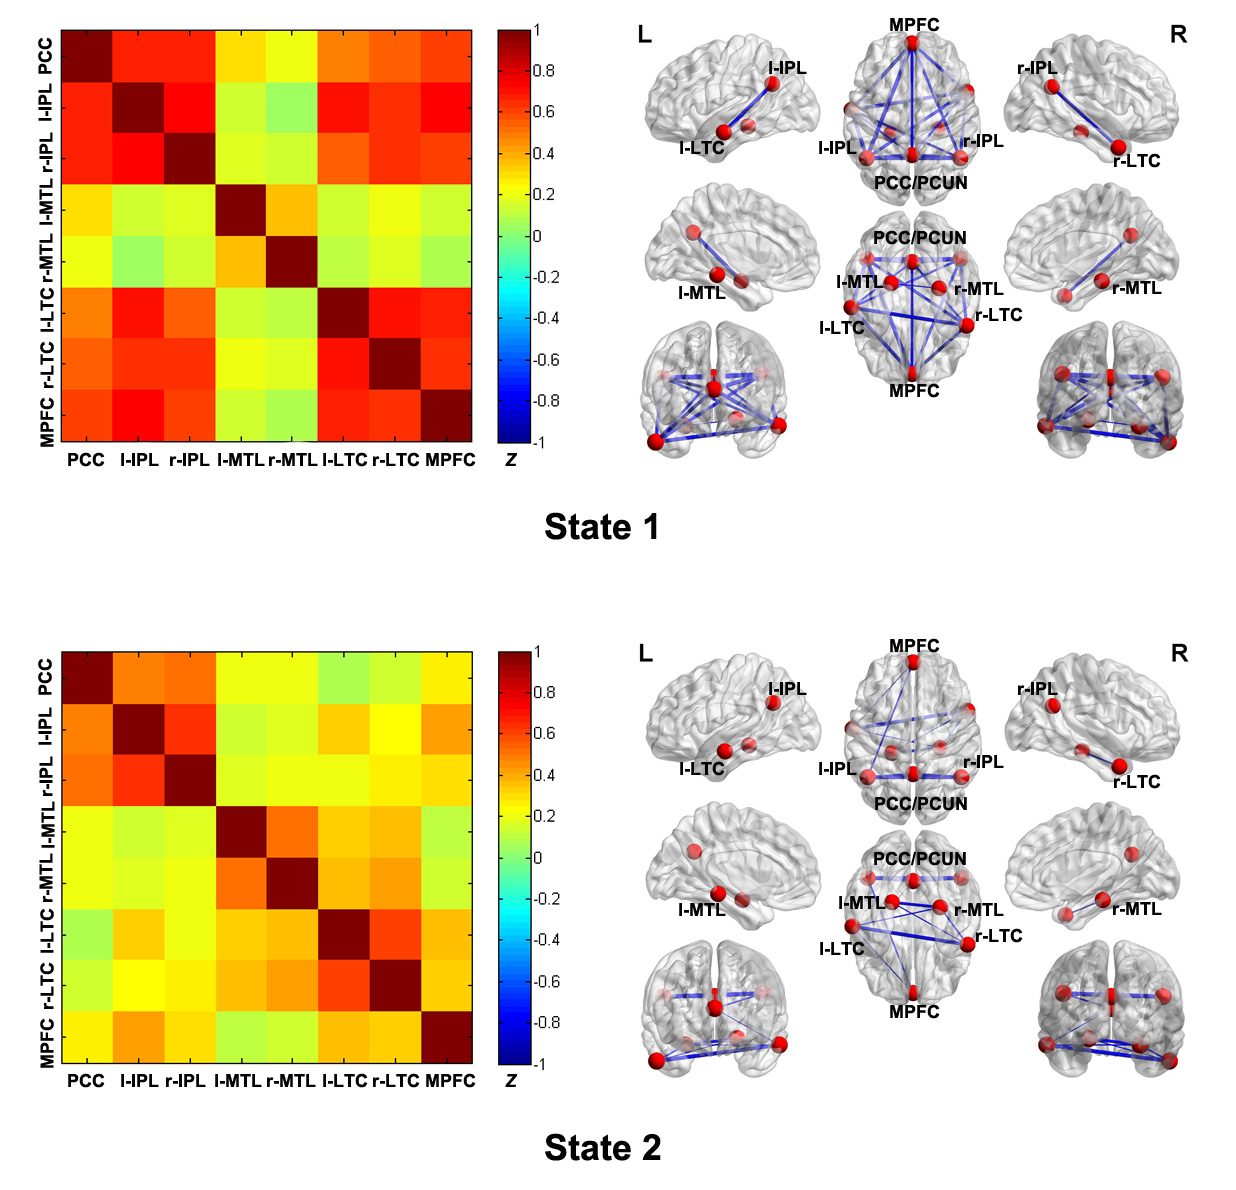
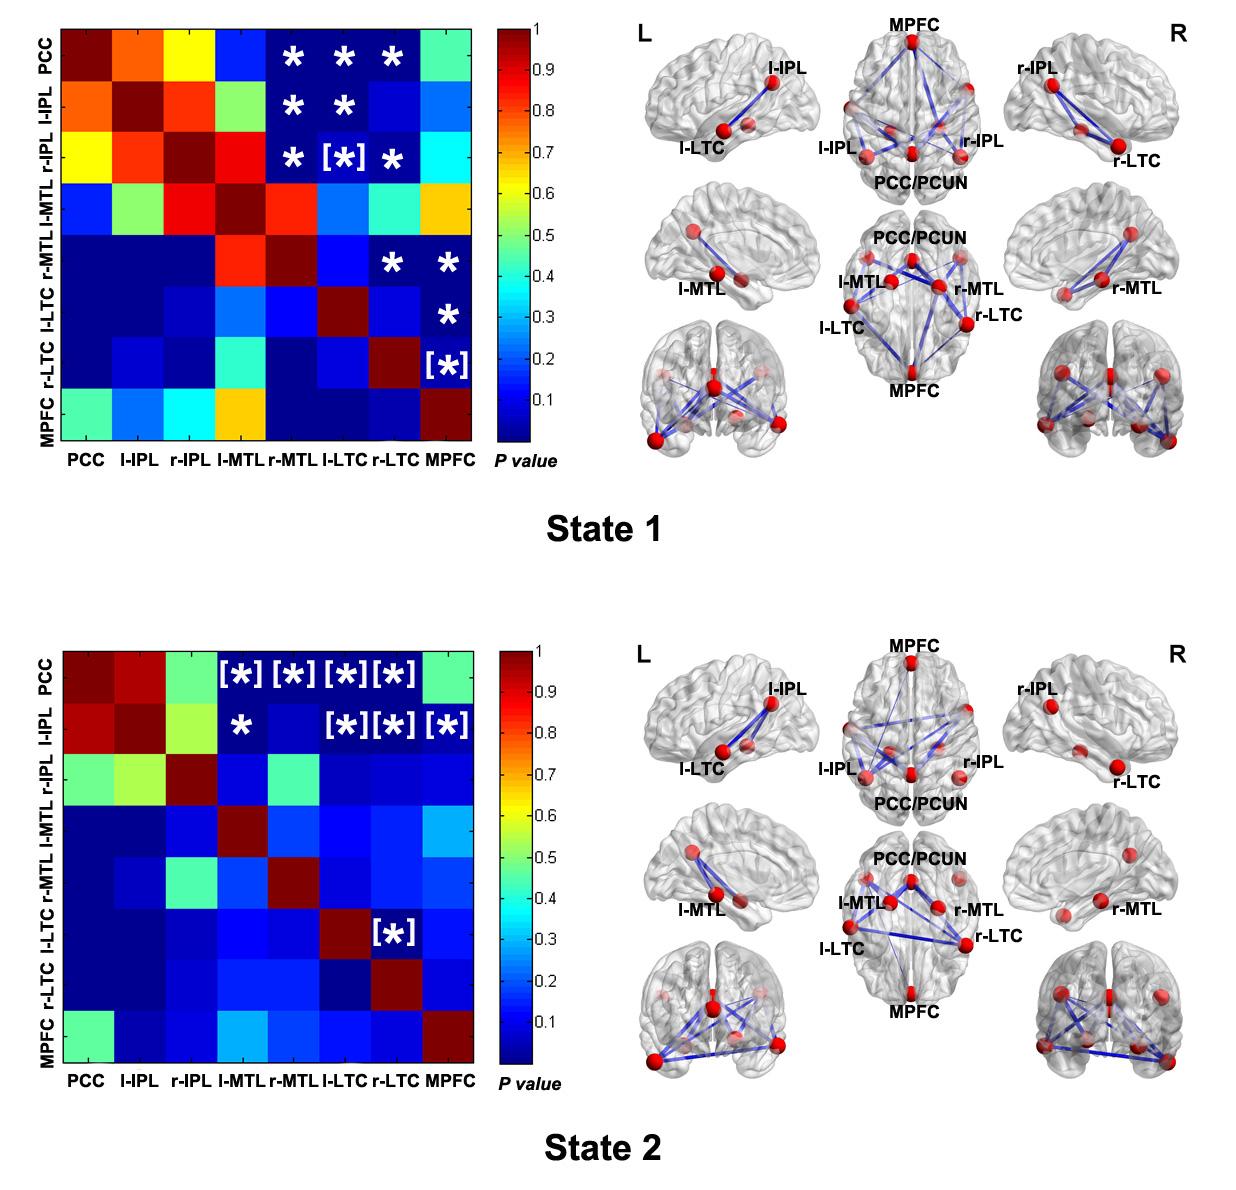
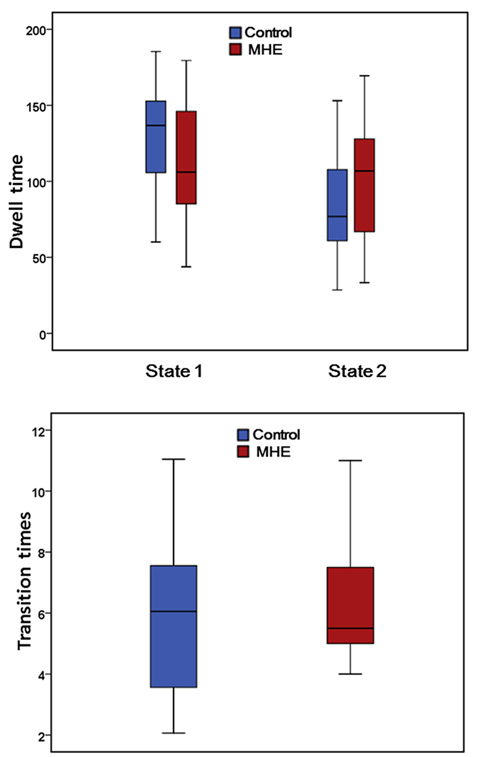
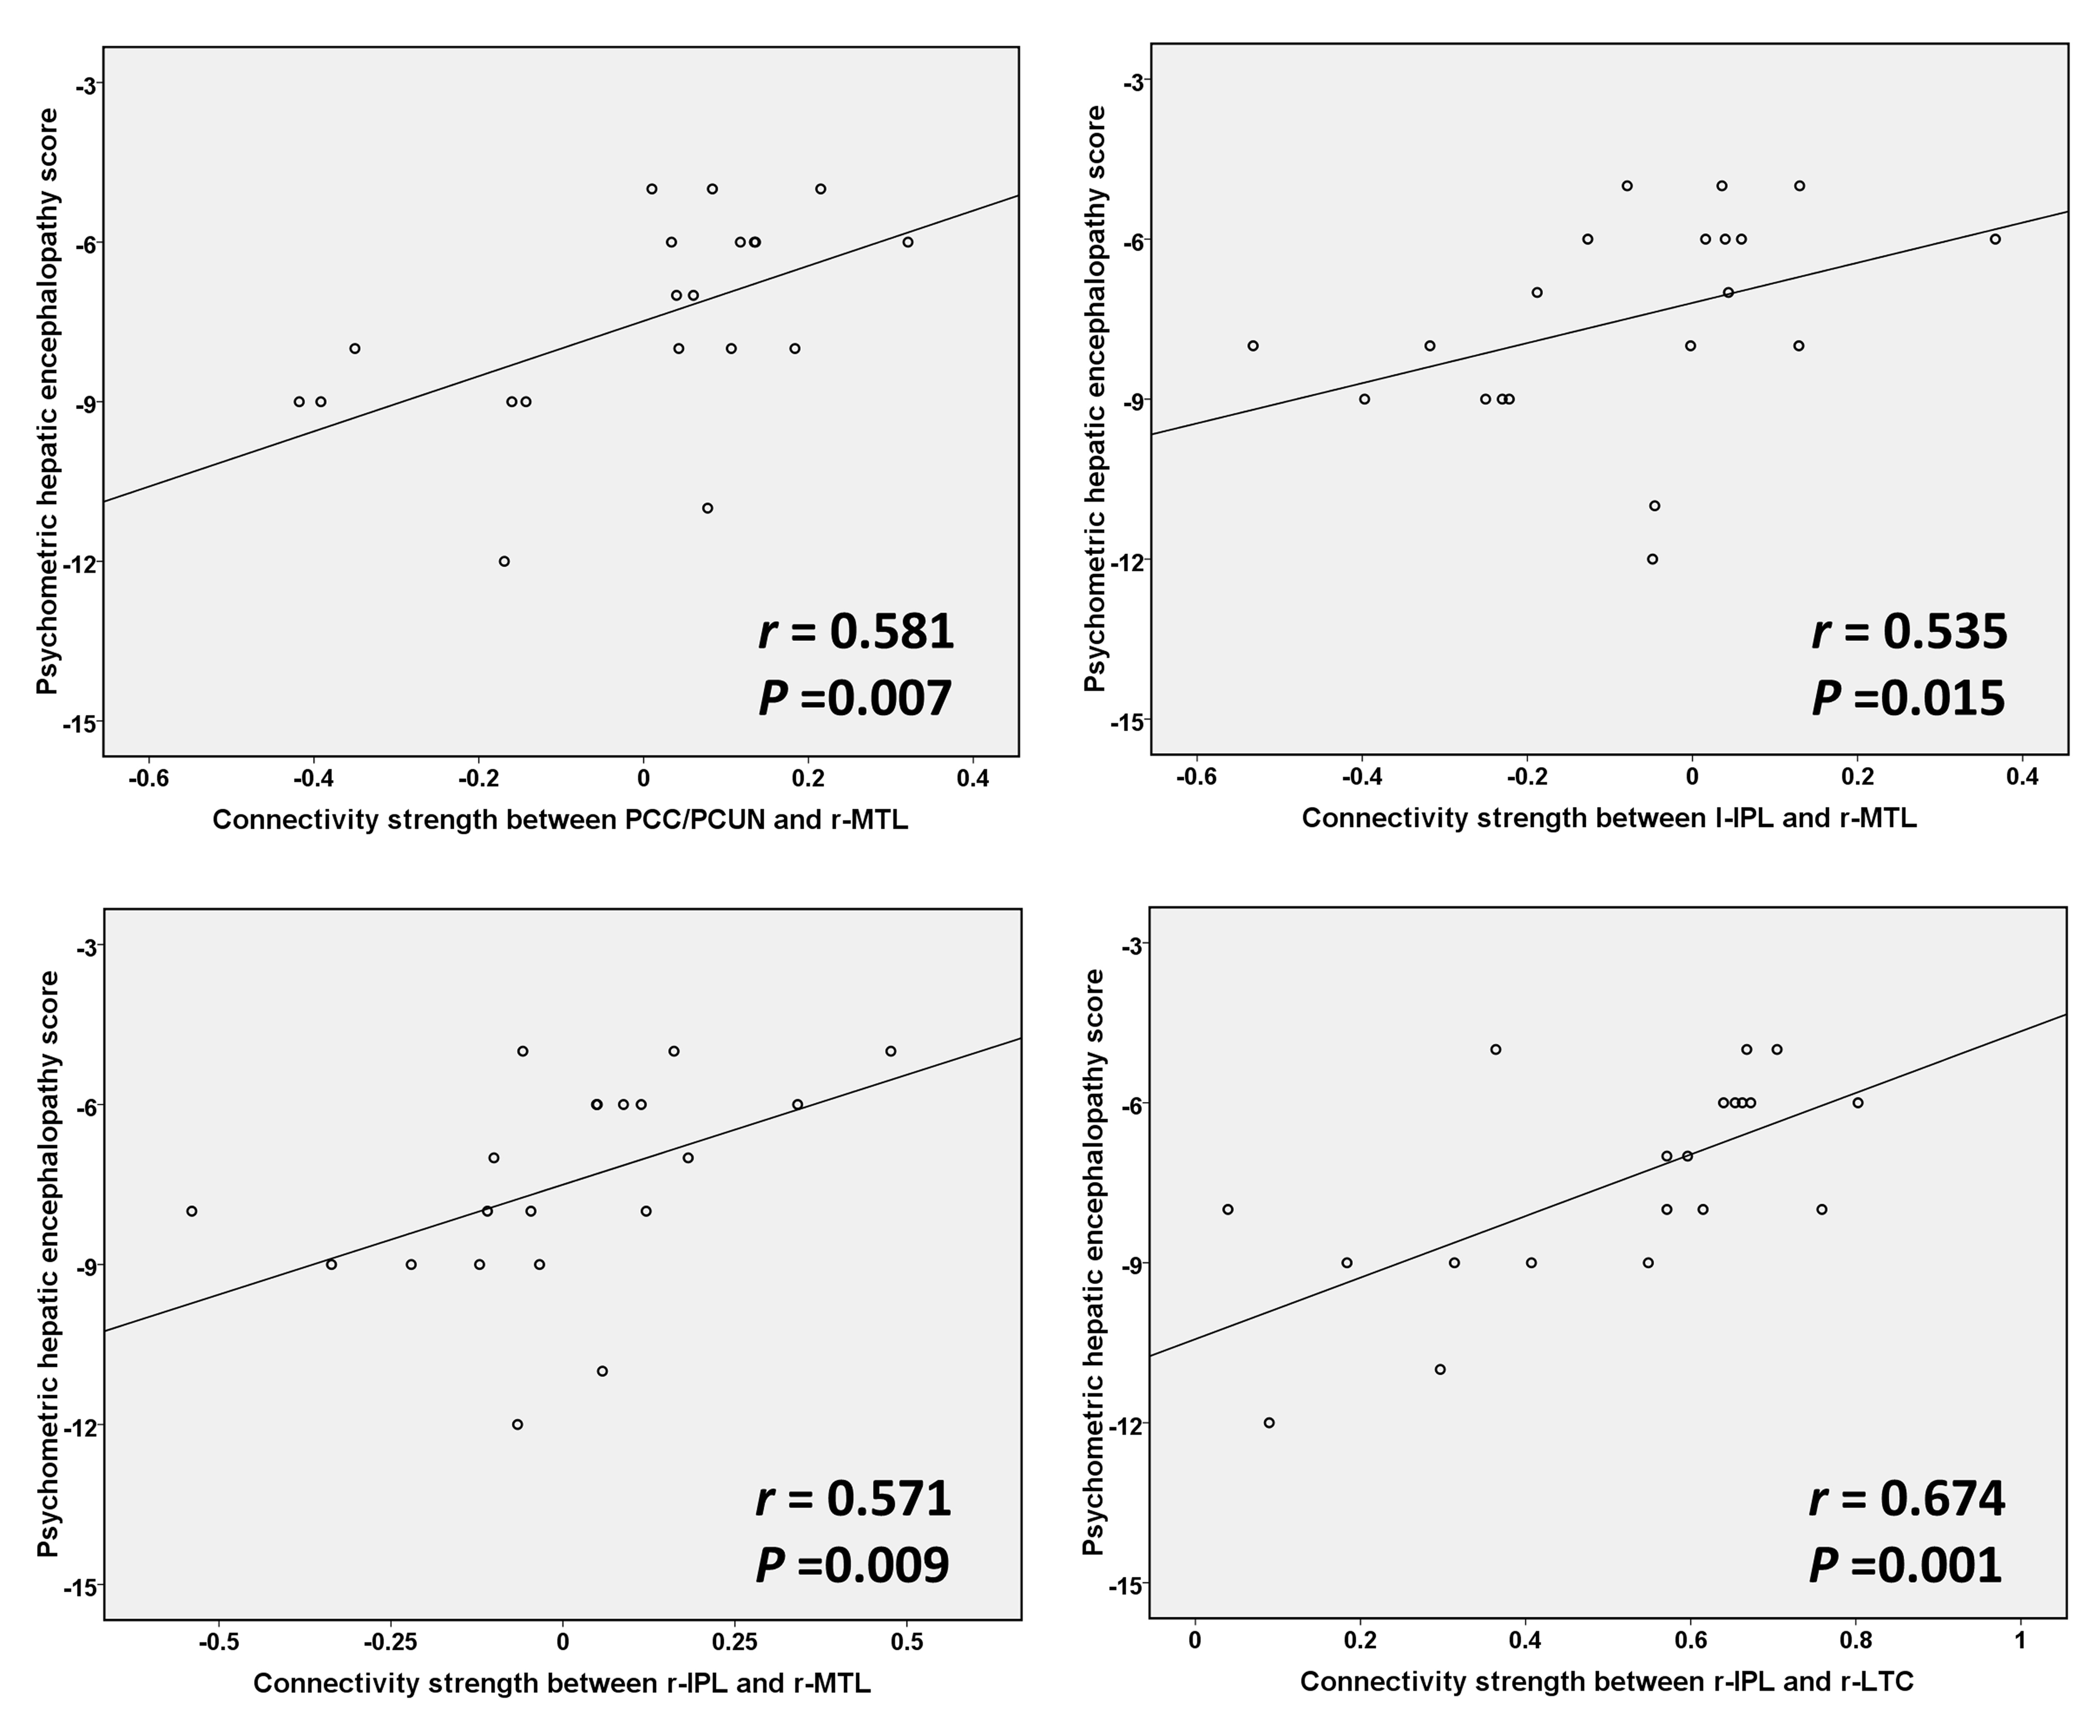
When the number of clusters was 2, MHE patients presented weaker connectivity strengths compared with controls in states 1 and 2. In state 1, decreased FC strength was found between the PCC/precuneus (PCUN) - right medial temporal lobe (MTL)/bilateral lateral temporal cortex (LTC), left inferior parietal lobule (IPL) - right MTL/left LTC, right IPL - right MTL/bilateral LTC, right MTL - right LTC, and medial prefrontal cortex (MPFC) - right MTL/bilateral LTC. In state 2, reduced FC strength was observed between the PCC/PCUN - bilateral MTL/bilateral LTC, left IPL - left MTL/bilateral LTC/MPFC, and left LTC - right LTC (Figures 2-3). Based on the between-group comparison of the dwell time in states, we found that MHE patients seemed to stay in state 2 (in which the subsystems of DMN were less connected) for the longer time, compared with healthy controls (Figure 4). But this trend didn’t reach statistically significant level (P = 0.138). No significant difference in transition times was found between two groups (P = 0.474). Altered connectivities from state 1 were correlated with patient cognitive performance (Figure 5). Similar findings were observed when the number of clusters was set to 3 or 4.Discussion
By utilizing various static connectivity analysis methods, such as independent component analysis (ICA) and seed-based connectivity approach, many studies have consistently revealed a reduction of DMN FC in MHE patients [5; 6; 15; 16]. Our results showed decreased DMN dFC, which extends existing findings and further verifies loss of DMN integrity in MHE. According to previous studies, DMN dysfunction (reflected by altered FC) may be associated with several pathological processes in cirrhosis such as inhibition of cerebral energy metabolism involving DMN-related regions [17] and cerebral edema attributed to metabolic disturbance of ammonia [15].Conclusion
In conclusion, aberrant dynamic DMN connectivity is an additional characteristic of MHE. Disruption of DMN integrity in MHE is associated with patient cognitive impairment. Dynamic connectivity analysis offers a novel paradigm for understanding mechanisms underlying MHE.Acknowledgements
This work was supported by a grant from the National Natural Science Foundation of China (No. 81501450) and a project funded by the China Postdoctoral Science Foundation (No. 2015M580452).References
1.Bajaj JS, Wade JB, Sanyal AJ. Spectrum of neurocognitive impairment in cirrhosis: Implications for the assessment of hepatic encephalopathy. Hepatology. 2009;50:2014-2021.
2. Romero-Gomez M, Boza F, Garcia-Valdecasas MS, et al. Subclinical hepatic encephalopathy predicts the development of overt hepatic encephalopathy. Am J Gastroenterol. 2001;96:2718-2723.
3.Groeneweg M, Quero JC, De Bruijn I, et al. Subclinical hepatic encephalopathy impairs daily functioning. Hepatology. 1998;28:45-49.
4. Dhiman RK, Kurmi R, Thumburu KK, et al. Diagnosis and prognostic significance of minimal hepatic encephalopathy in patients with cirrhosis of liver. Dig Dis Sci. 2010;55:2381-2390.
5. Chen HJ, Jiao Y, Zhu XQ, et al. Brain dysfunction primarily related to previous overt hepatic encephalopathy compared with minimal hepatic encephalopathy: resting-state functional MR imaging demonstration. Radiology. 2013;266:261-270.
6. Qi R, Zhang LJ, Xu Q, et al. Abnormal functional connectivity within the default mode network in patients with HBV-related cirrhosis without hepatic encephalopathy revealed by resting-state functional MRI. Brain Res. 2014;1576:73-80.
7.Qi R, Zhang LJ, Xu Q, et al. Selective impairments of resting-state networks in minimal hepatic encephalopathy. PLoS One. 2012;7:e37400.
8. Hsu TW, Wu CW, Cheng YF, et al. Impaired small-world network efficiency and dynamic functional distribution in patients with cirrhosis. PLoS One. 2012;7:e35266.
9.Hutchison RM, Womelsdorf T, Allen EA, et al. Dynamic functional connectivity: promise, issues, and interpretations. Neuroimage. 2013;80:360-378.
10. Calhoun VD, Miller R, Pearlson G, et al. The chronnectome: time-varying connectivity networks as the next frontier in fMRI data discovery. Neuron. 2014;84:262-274.
11.Allen EA, Damaraju E, Plis SM, et al. Tracking whole-brain connectivity dynamics in the resting state. Cereb Cortex. 2014;24:663-676.
12. Jones DT, Vemuri P, Murphy MC, et al. Non-stationarity in the "resting brain's" modular architecture. PLoS One. 2012;7:e39731.
13.Rashid B, Damaraju E, Pearlson GD, et al. Dynamic connectivity states estimated from resting fMRI Identify differences among Schizophrenia, bipolar disorder, and healthy control subjects. Front Hum Neurosci. 2014;8:897.
14.Liao W, Zhang Z, Mantini D, et al. Dynamical intrinsic functional architecture of the brain during absence seizures. Brain Struct Funct. 2014;219:2001-2015.
15. Lin WC, Hsu TW, Chen CL, et al. Connectivity of default-mode network is associated with cerebral edema in hepatic encephalopathy. PLoS One. 2012;7:e36986.
16.Qi R, Zhang LJ, Luo S, et al. Default mode network functional connectivity: a promising biomarker for diagnosing minimal hepatic encephalopathy: CONSORT-compliant article. Medicine (Baltimore). 2014;93:e227.
17. Iversen P, Sorensen M, Bak LK, et al. Low cerebral oxygen consumption and blood flow in patients with cirrhosis and an acute episode of hepatic encephalopathy. Gastroenterology. 2009;136:863-871.
Figures