3719
Hyperpolarized [13C,15N2]urea T2 relaxation changes in acute kidney injury1The MR Research Centre, Department of Clinical Medicine, Aarhus University, Aarhus N, Denmark
Synopsis
BOLD T2* MRI is a surrogate marker of tissue pO2 alterations associated with renal disease, but is limited by perfusion. Hyperpolarized [13C,15N2]urea is an alternative marker of renal function that correlates with normal renal oxygenation. We investigated the correlation between BOLD T2* and 13C-urea T2 in an acute kidney injury (AKI) model. We found that hyperpolarized urea T2 correlates with renal BOLD T2* in the healthy but not in the AKI kidney, and that whole kidney T2 is modulated significantly by the blood volume in addition to oxygen availability. 13C-urea T2 mapping therefore has potential to assist the BOLD estimation.
Purpose
Blood oxygenation level dependent (BOLD) magnetic resonance imaging (MRI) can image the T2* relaxation, as a surrogate marker of tissue pO2 alterations associated with renal disease. However, BOLD is limited by perfusion, vascular and tubular volume fractions, and is considered a semi-quantitative method1. New or improved methods are therefore needed. Hyperpolarized [13C,15N2]urea is an alternative marker of renal function that correlates well with renal oxygenation under normal conditions, while the aberrant renal oxygen consumption in diabetes diminishes this relationship2. Here we investigate the correlation between 1H BOLD MRI and 13C-urea T2 relaxation rate in an acute kidney injury (AKI) rat model.Materials and methods
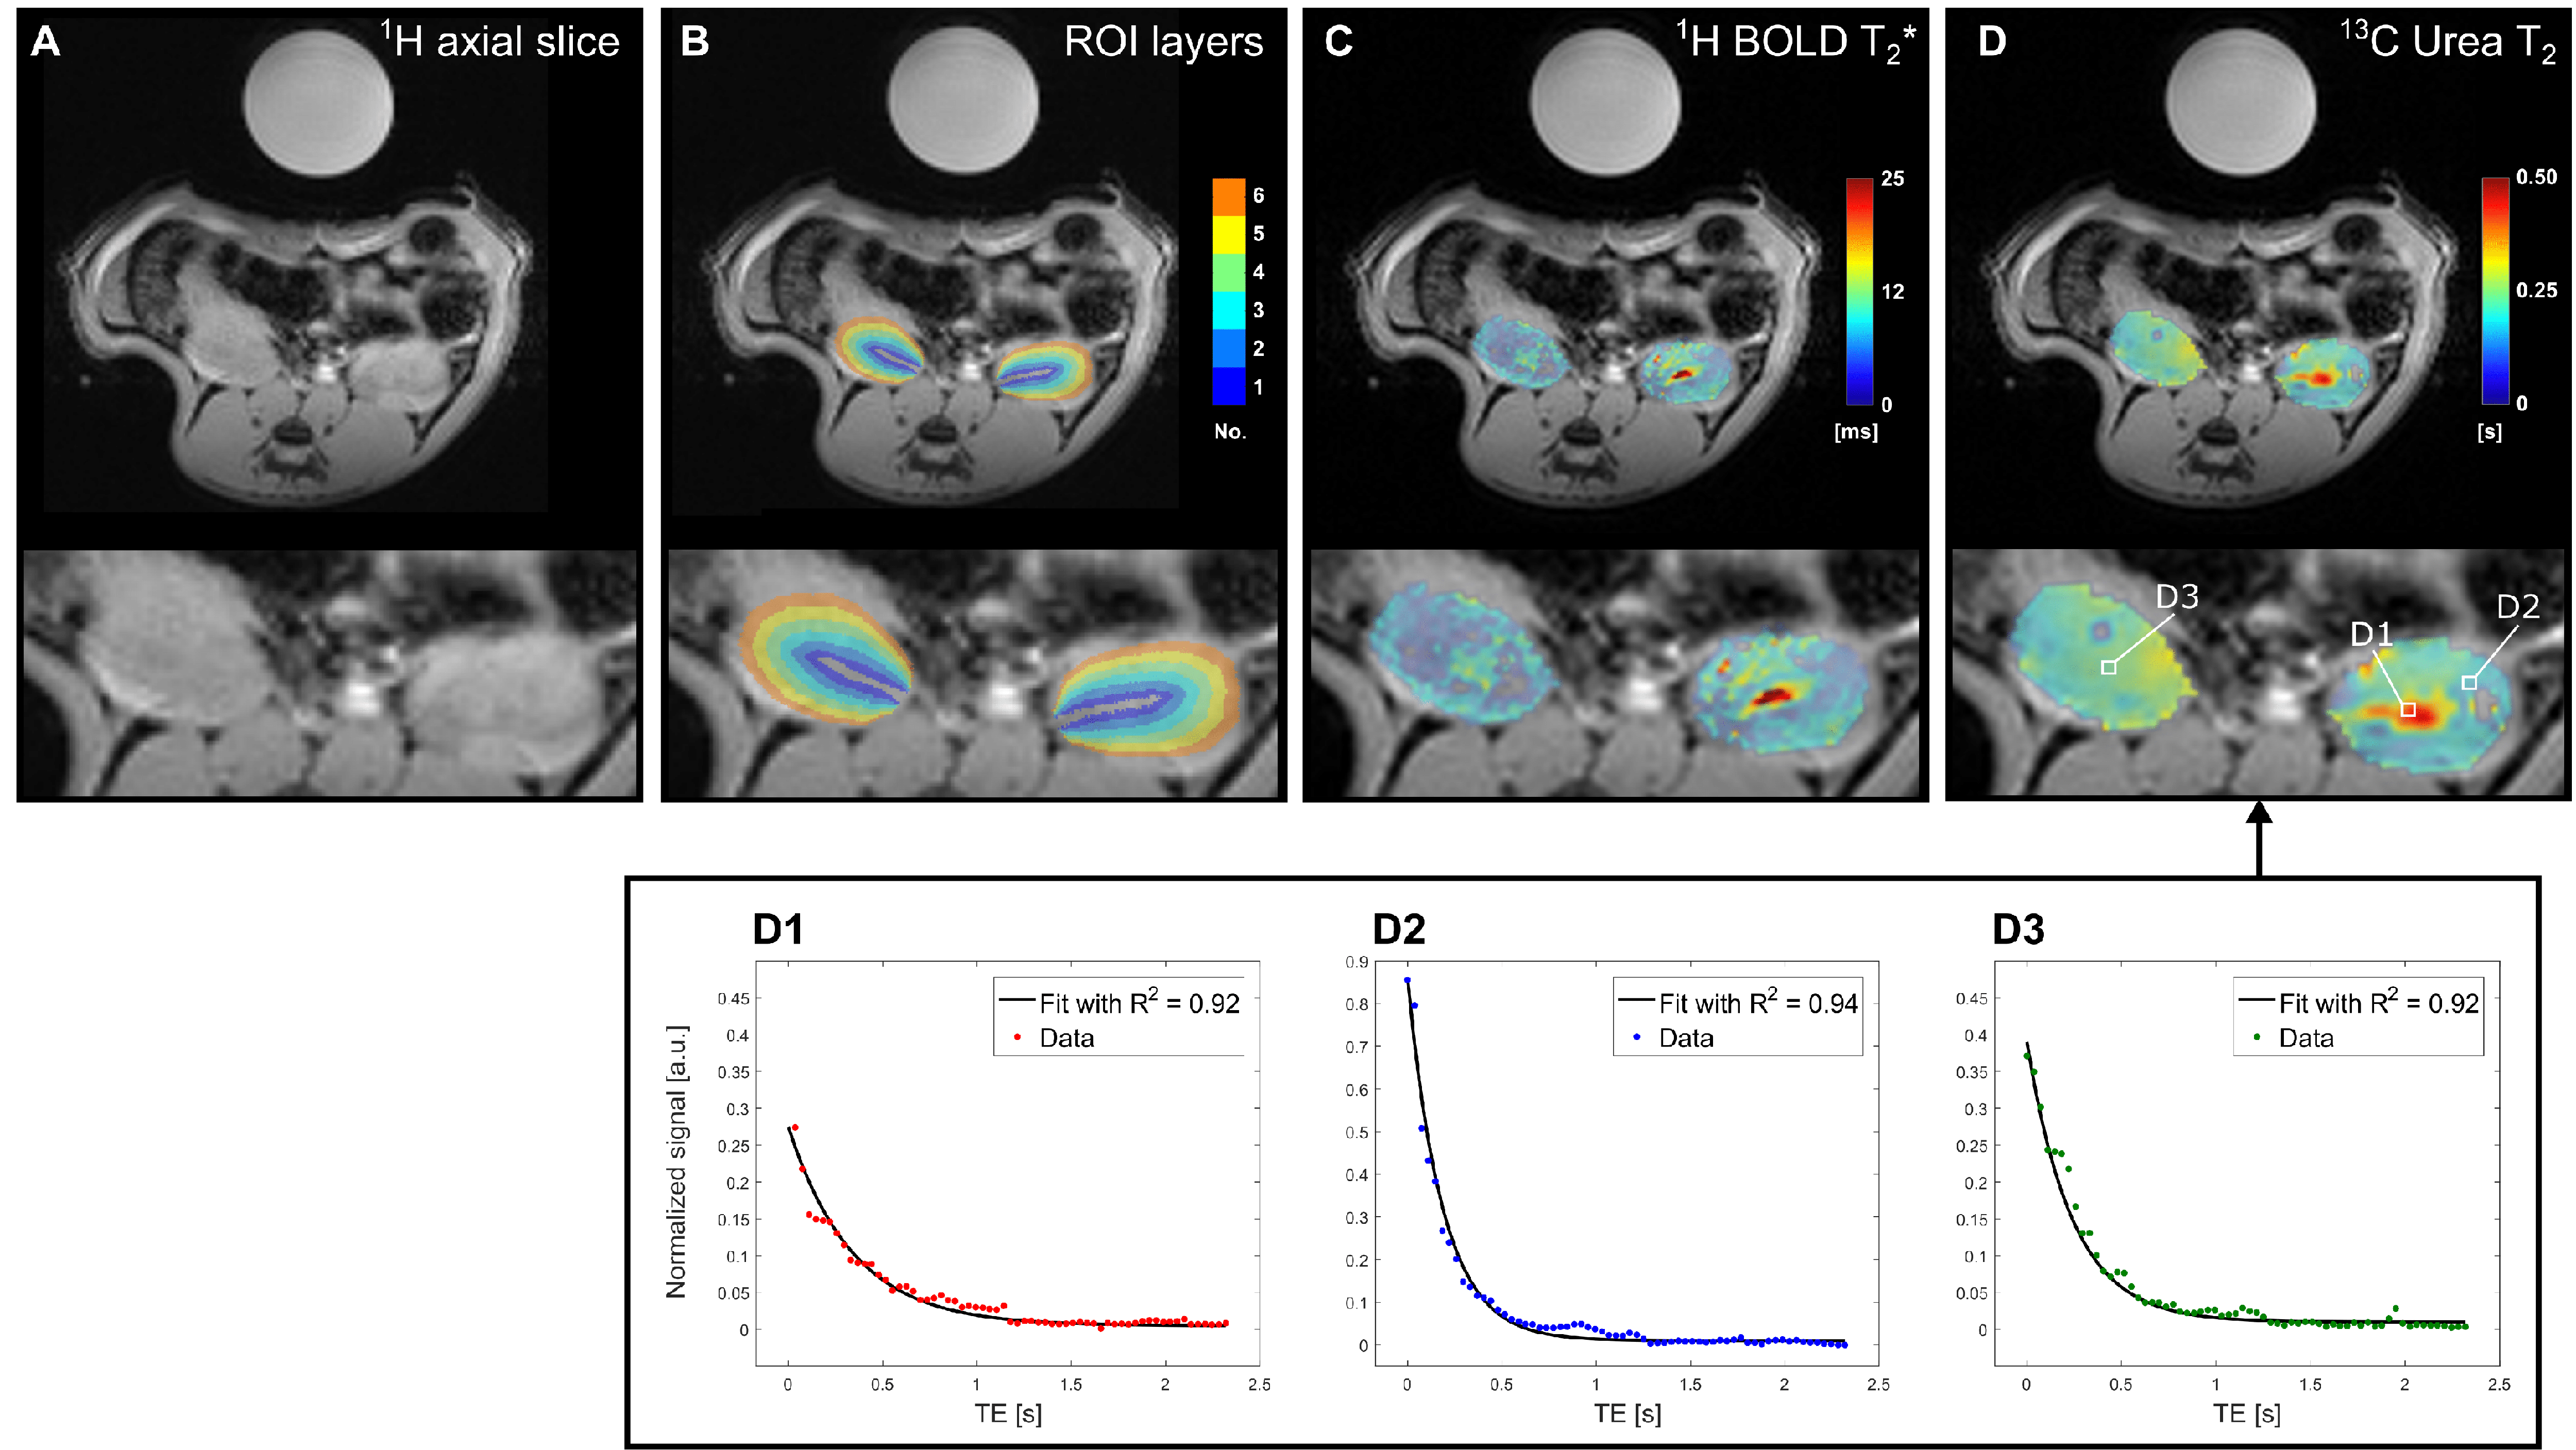
Six male (278±11 g) Wistar rats were subjected to unilateral renal ischemia 24 hours before the MRI investigation. Hyperpolarized [13C,15N2]urea samples were prepared using a 5 T SPINLab polarizer (GE Healthcare, Broendby, DK) to a polarization of more than 35%. After dissolution, a 1.0 ml injection volume was transferred to the rats, placed in a 9.4 T pre-clinical MR scanner (Agilent, UK) with a 1H/13C dual-tuned volume coil (Doty scientific, US). 1H BOLD MRI was performed with; TR / TE / ΔTE=150 ms / 2.2 ms / 2.2 ms, FOV / matrix=60x60 mm2 / 128x128, flip-angle=30° and 6 mm slice thickness. Perfusion was estimated by non-contrast flow alternating inversion recovery (FAIR) arterial spin labelling (ASL); TR / TE=4.1 ms / 2.1 ms, TI=110, 180, 310, 510, 860, 1430, 2400 and 4000 ms, FOV / matrix=60x60 mm2 / 128x128, flip-angle=8° and 20 mm slice thickness. Label and control images were acquired with TI=1300 ms. Hyperpolarized 13C-urea T2 mapping was performed with a 2D golden-angle radial approach; TR / TE=3000 ms / 4.6 ms, FOV / matrix=70x70 mm2 / 64x512, flip-angle=90°/180° and 10 mm slice thickness2. Region of interest (ROI) analysis was performed in Matlab (MathWorks, Natick, MA, US) using ROI segmentation analysis3. Each whole kidney ROI was divided into six equidistantly spaced segment layers using this method, see Figure 1 A. Statistical analysis was performed in GraphPad PRISM (GraphPad Software, Inc. La Jolla, CA, US), p<0.05 was considered statistically significant.Results
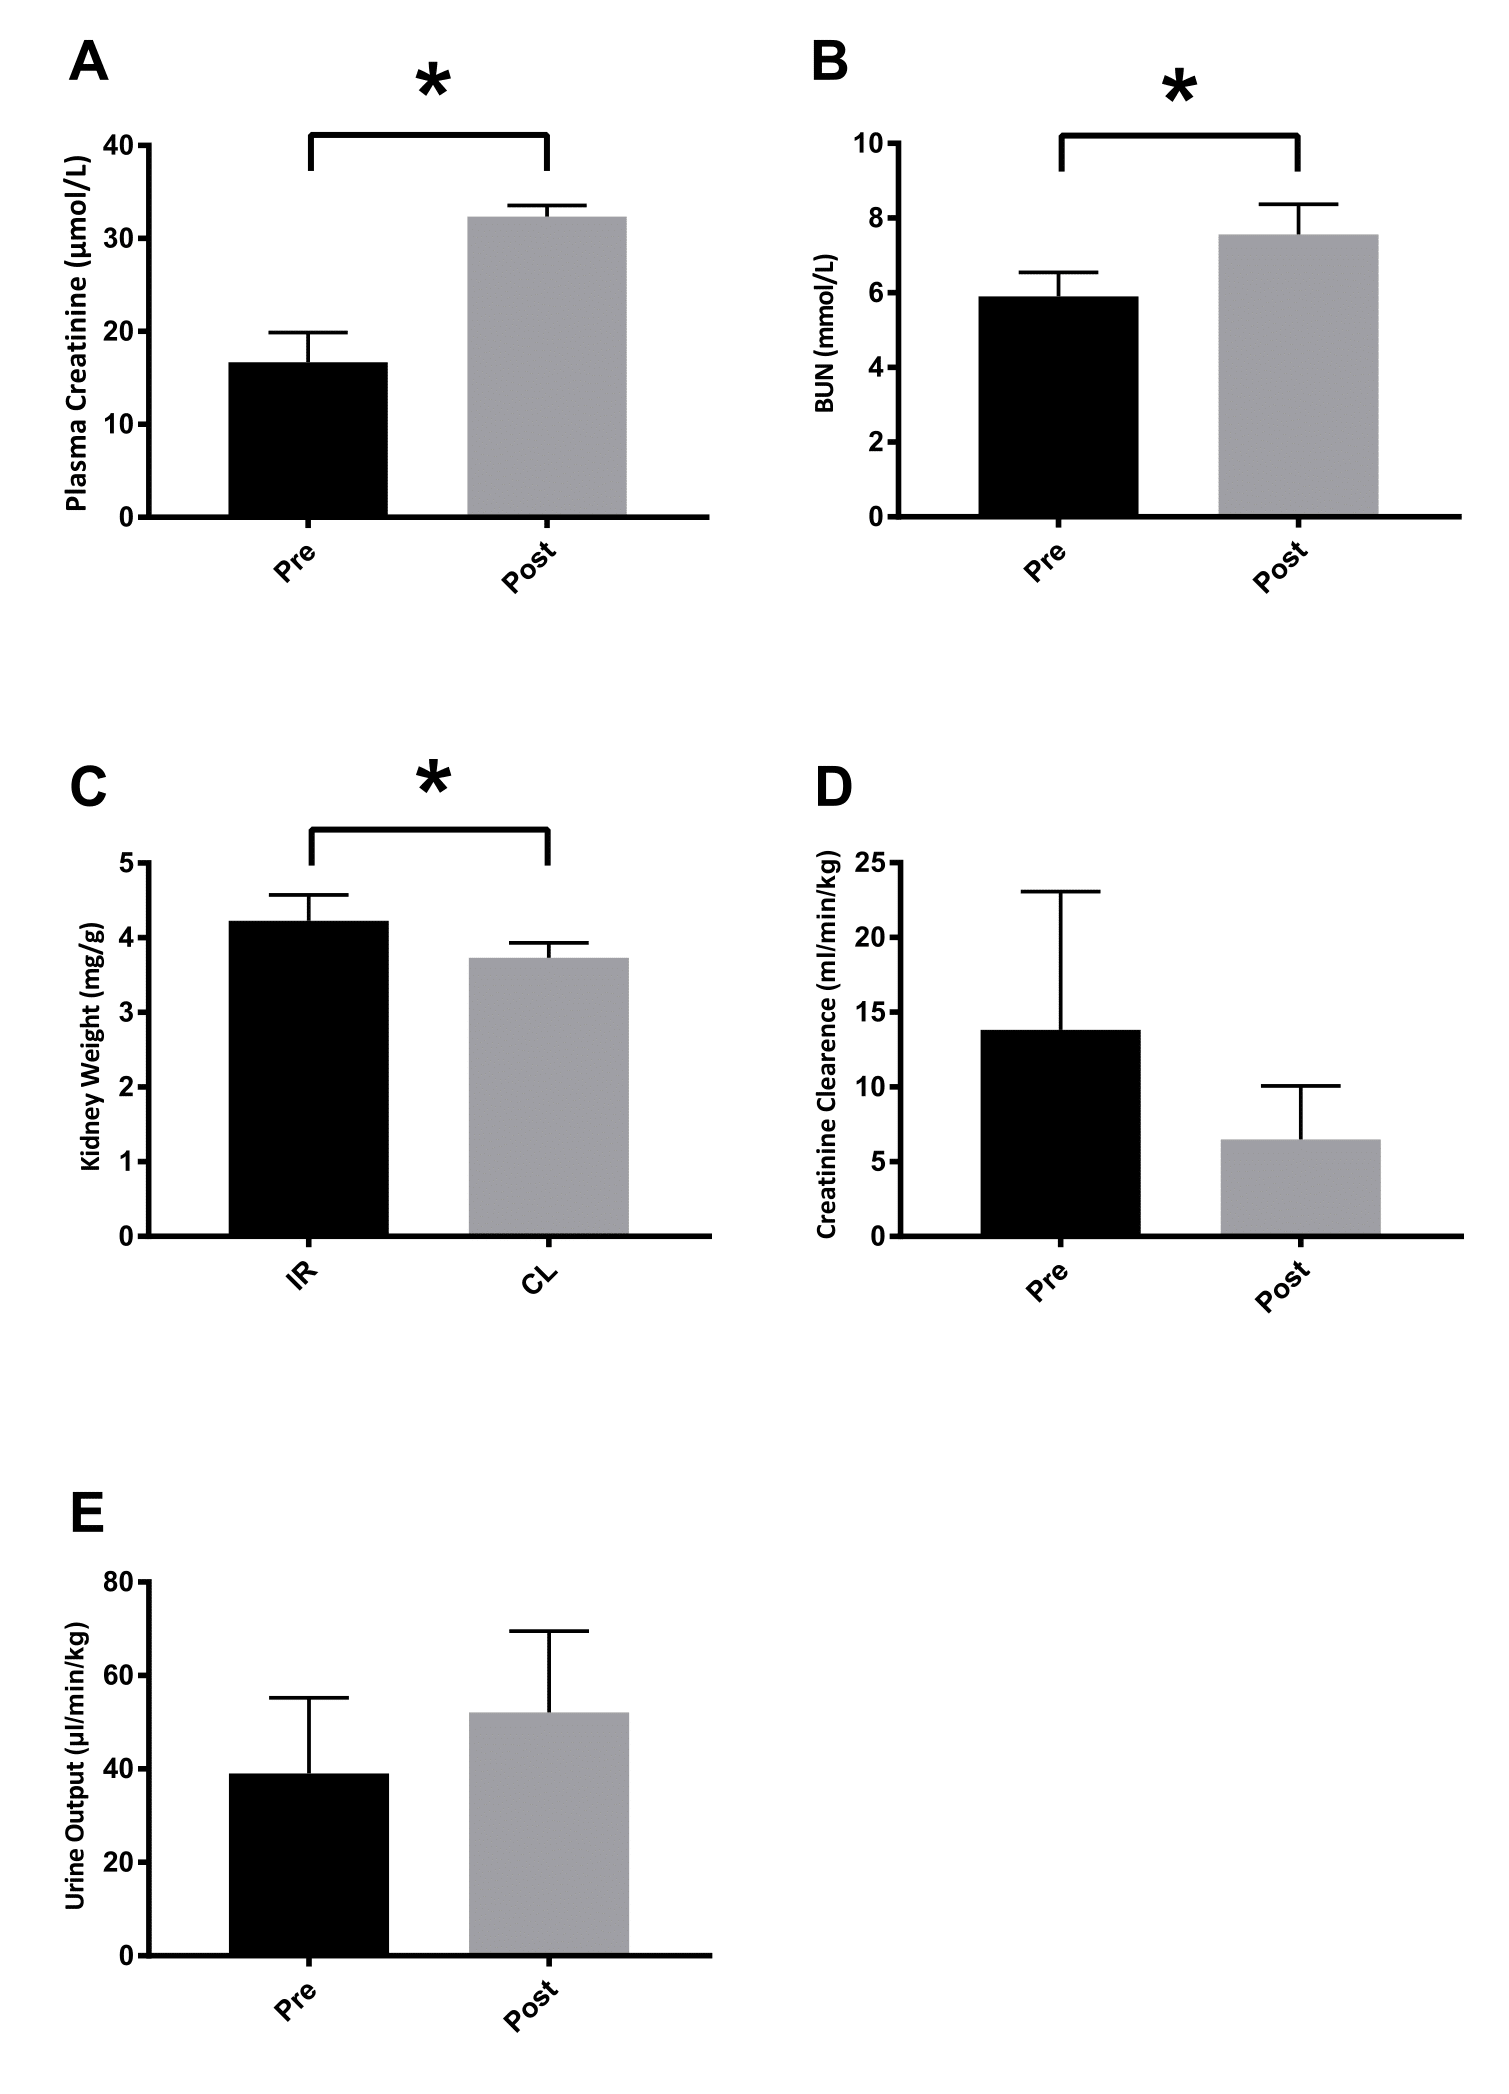
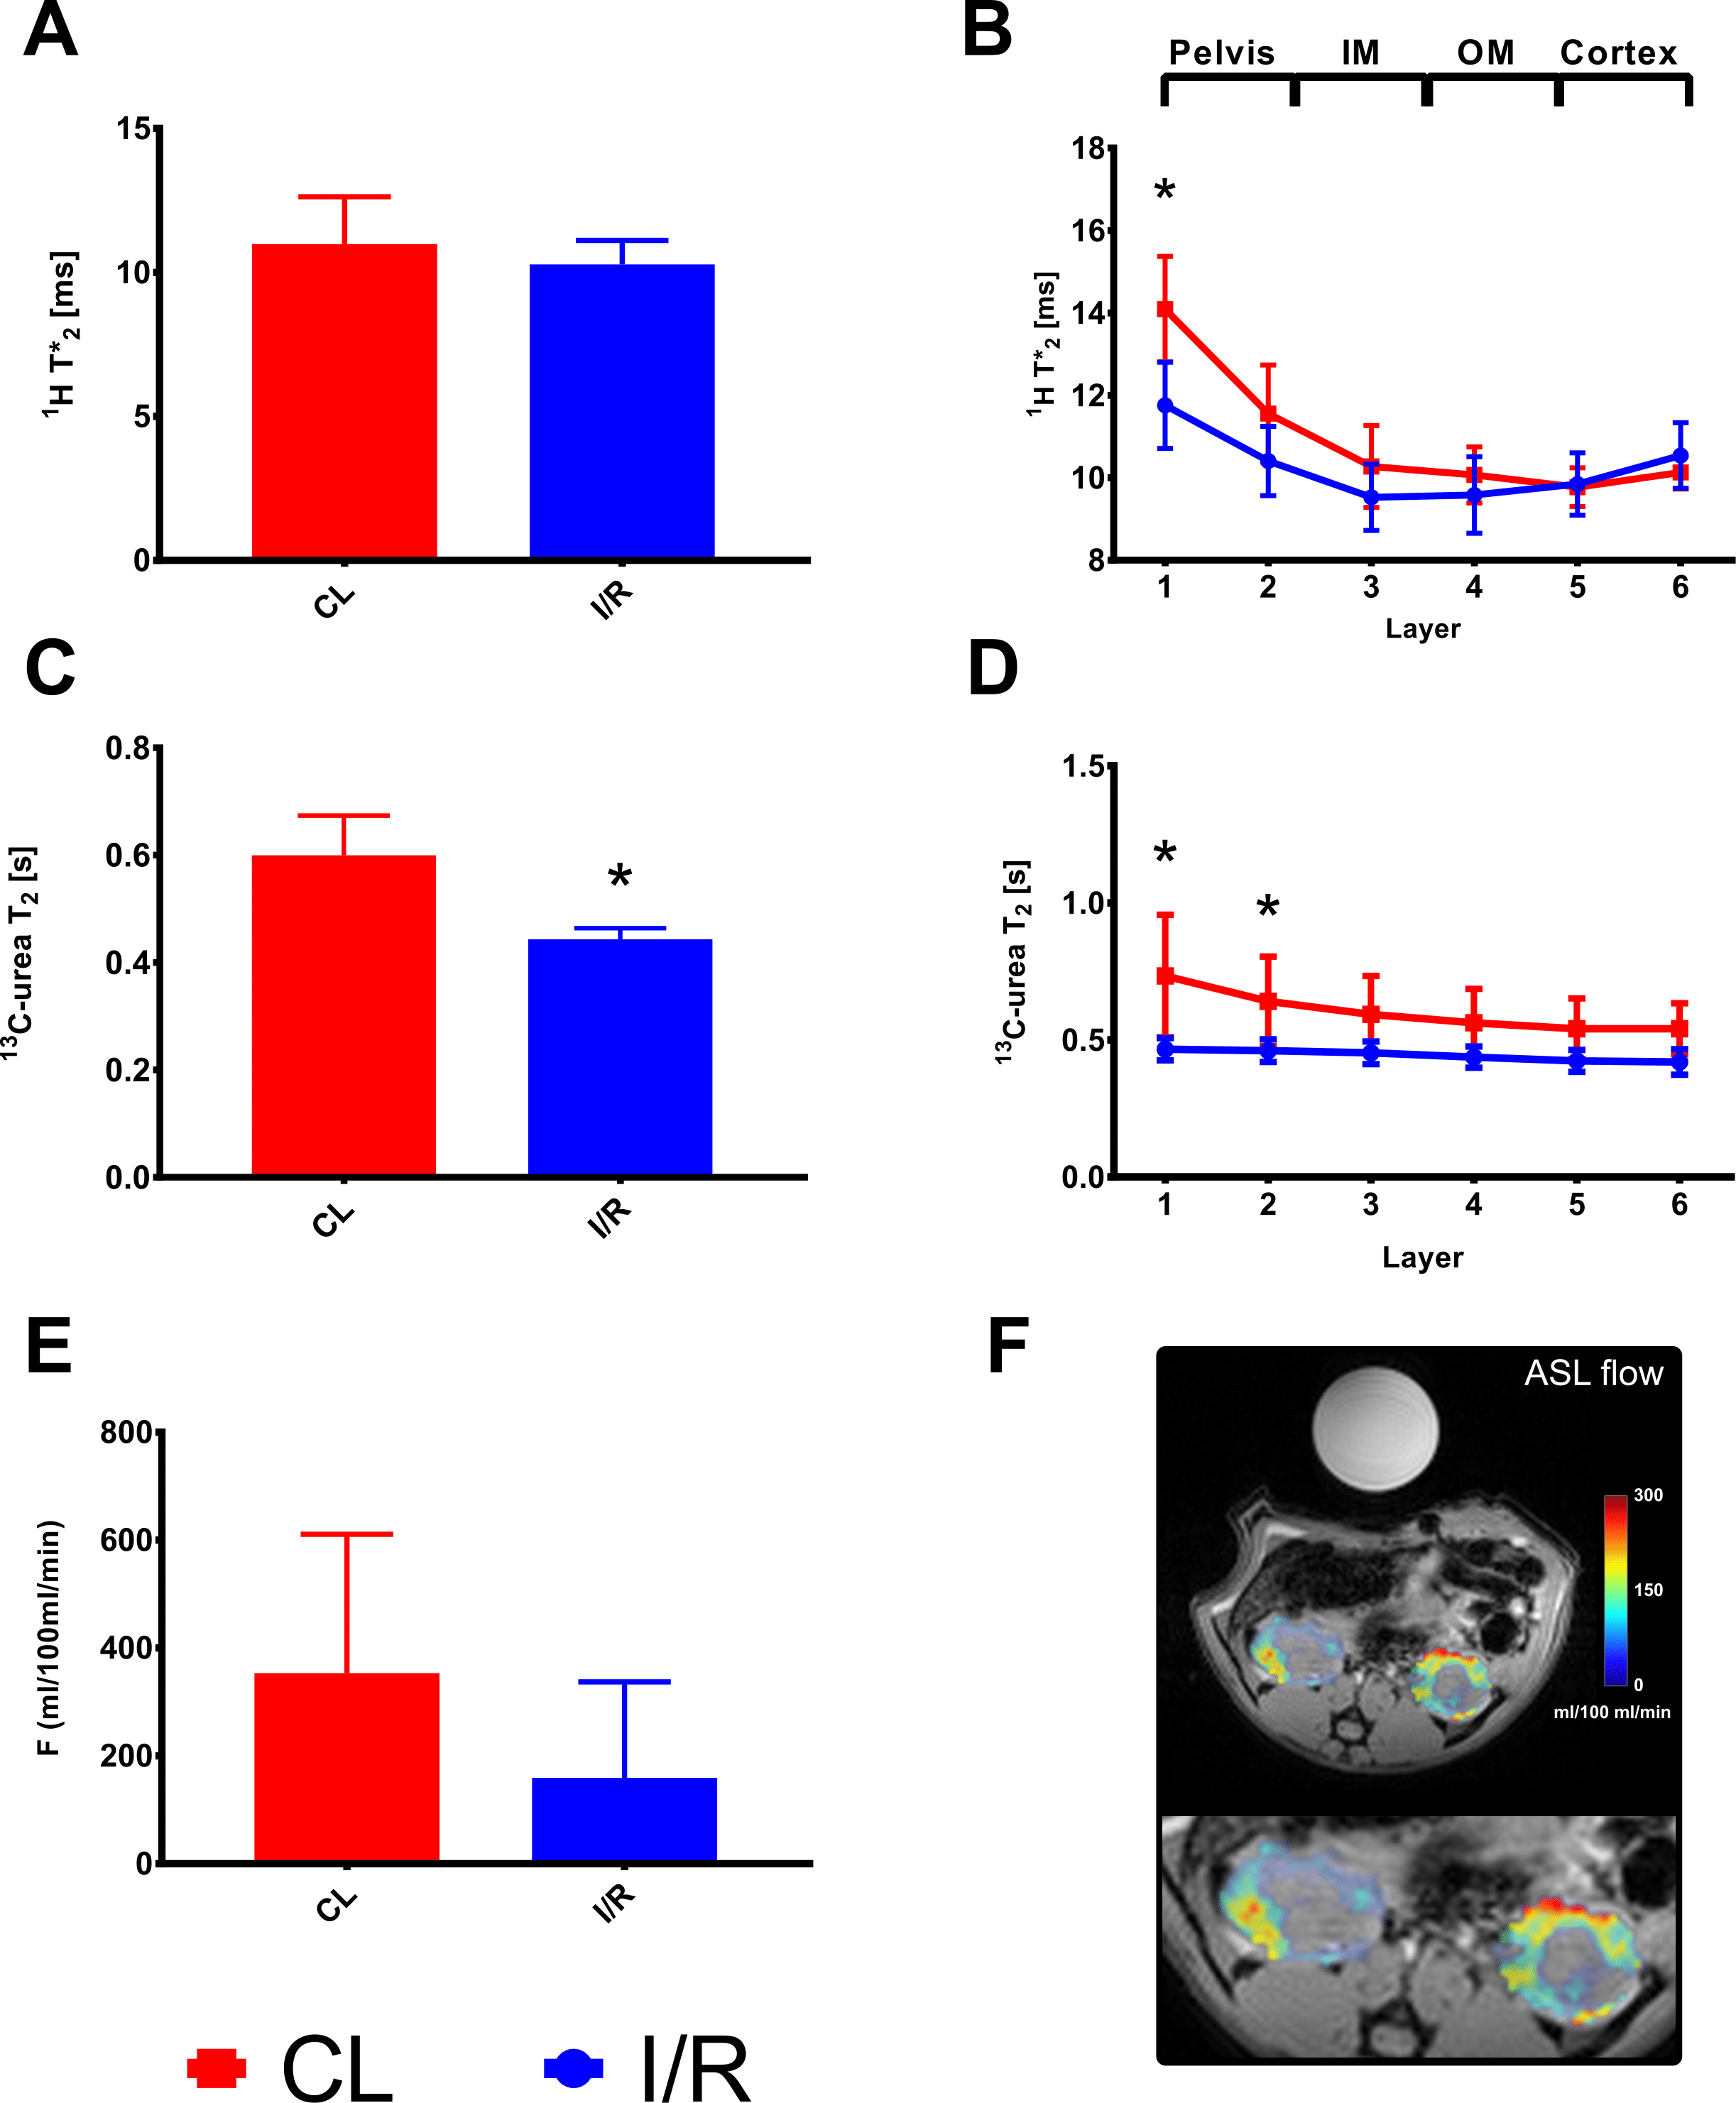
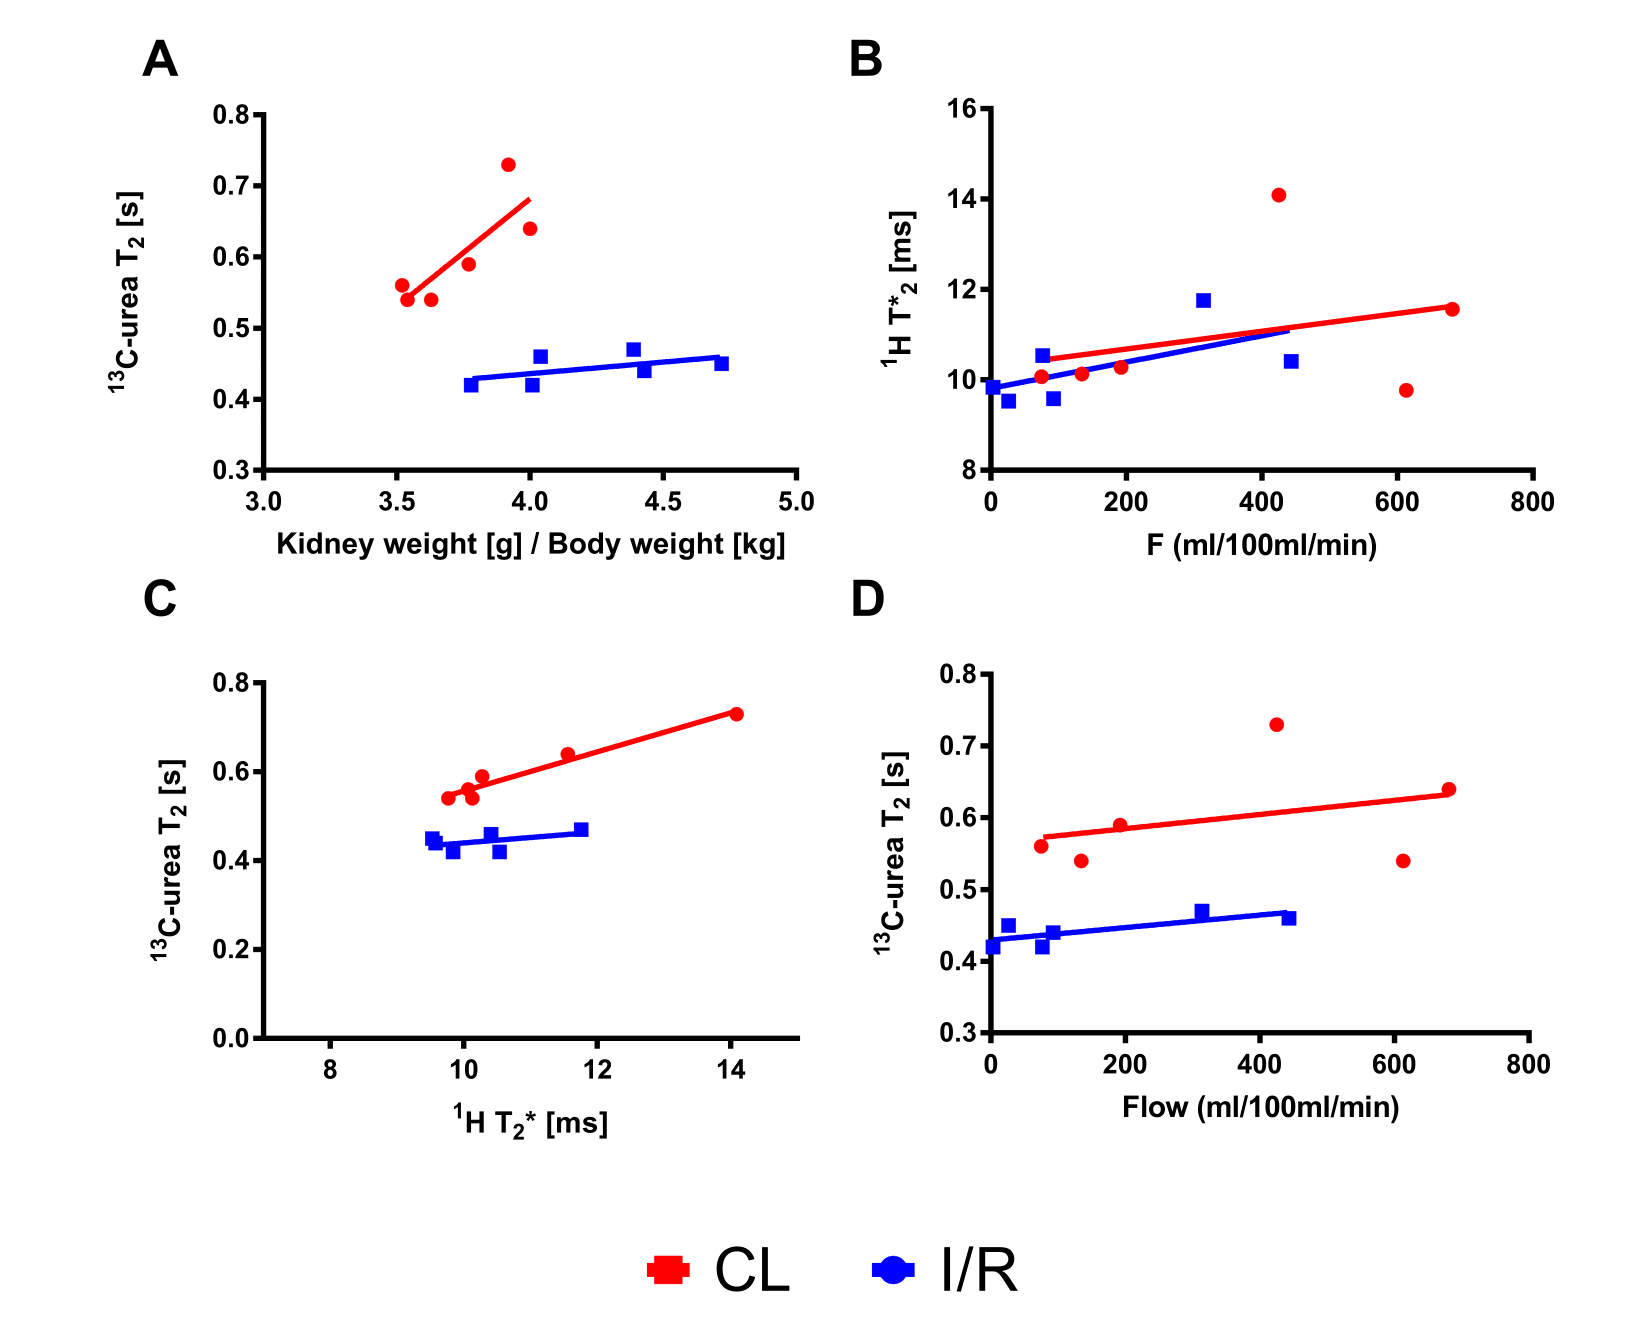
All rats showed clinical signs of AKI with an increased plasma creatinine (p<0.0001) and blood-urea nitrogen (BUN) (p<0.0001), as well as a tendency towards reduced creatinine clearance (p=0.1) and increased urine output (p=0.19). The kidney weight was significantly increased in the post-ischemic kidney 4.2±0.3 mg/g compared to the contralateral kidney 3.7±0.2 mg/g (p=0.02), see Figure 2. Whole kidney 13C-urea T2 significantly decreased 26% (p=0.001) 24 hours after reperfusion. A significantly different (3.7 times steeper, p=0.008) active urea gradient was observed in the contralateral kidney (p=0.008, R2=0.86) compared to the AKI kidney (p=0.0004, R2=0.97). Whole kidney T2* signal (p=0.14) and T2* gradient (p=0.26) was similar between the two. Oxygen availability dependency on 13C-urea T2 was investigated via the correlation between the BOLD and T2 signals; a statistically significant difference (p=0.03) was found in the contralateral kidney (p=0.0001, R2=0.95), and not in the AKI kidney (p=0.31, R2=0.25), see Figure 3. Hypoperfusion was investigated via FAIR-ASL, showing a numerical decreased perfusion of 55% in the AKI kidney, although not statistically significant, compared to the contralateral kidney (p=0.08).Discussion and conclusion
We demonstrate that hyperpolarized [13C,15N2]urea semi-parametric relaxation assessment correlate with renal oxygen tension (T2*) in the healthy kidney, but not in the AKI kidney. The whole kidney T2 relaxation difference between the post-ischemic kidney and the contralateral kidney could originate from either decreased perfusion and/or altered blood volume. Hypoperfusion seems to account for the change in the BOLD signal, while this to a lesser degree is true for 13C-urea T2. Thus, the offset in the correlation between the perfusion and T2 measurements indicates that 13C-urea T2 is modulated significantly by the blood volume in addition to oxygen/hemoglobin availability. Therefore, this novel approach using ultra-fast acquisition for the 13C T2 mapping (less than 3 s) would lend this method to potentially further improve the BOLD estimation.
Acknowledgements
David Christoffer Hansen is acknowledged for his assistance reconstructing the 13C radial data.
Henrik Vestergaard Nielsen is acknowledged for his laboratory assistance.
References
1 Pohlmann, A. et al. (2014) Detailing the relation between renal T2* and renal tissue pO2 using an integrated approach of parametric magnetic resonance imaging and invasive physiological measurements. Investigative Radiology 49, 547-560.
2 Laustsen, C. et al. (2016). Hyperpolarized 13C urea relaxation mechanism reveals renal changes in diabetic nephropathy. Magnetic Resonance in Medicine, 75(2), 515–518.
3 Milani, B. et al. (2016) Reduction of cortical oxygenation in chronic kidney disease: evidence obtained with a new analysis method of blood oxygenation level-dependent magnetic resonance imaging. Nephrology Dialysis Transplantation, [Epub ahead of print].
Figures