3716
Investigating Ferumoxytol as a Relaxation Agent for Hyperpolarized 13C Magnetic Resonance1Radiology and Biomedical Imaging, University of California, San Francisco, San Francisco, CA, United States, 2Zuckerberg San Francisco General Hospital, San Francisco, CA, United States
Synopsis
Hyperpolarized carbon-13 MRI is a powerful emerging molecular imaging technique but it lacks tissue specificity. Selective relaxation of hyperpolarized signals by targeted gadolinium chelates has been explored to increase specificity. However, gadolinium agents have very low 13C relaxivities. We explore the use of the super paramagnetic iron oxide, ferumoxytol, by measuring the transverse and longitudinal relaxivity for two commonly imaged hyperpolarized 13C metabolites, namely [1-13C]pyruvate and [1-13C]lactate in comparison to gadopentetate. Longitudinal relaxivity of ferumoxytol is nearly 30 times higher for 13C compounds than gadopentetate. This enhanced relaxivity is expected to lead to especially low dose requirements in eventual biological translation.
INTRODUCTION
Hyperpolarized (HP) carbon-13 MRI is a powerful emerging technique for monitoring metabolic changes in cancer as well as cardiovascular and metabolic diseases. One drawback of HP MRI is that the signal lacks tissue specificity. To address this limitation, targeted gadolinium-based chelates have been proposed for selectively reducing the 13C T1 in certain tissue compartments (for example, liver or vasculature).1 However, these methods are somewhat limited by the relatively low relaxivities of many gadolinium-based chelates for 13C-based compounds, which can be more than 10 times lower than their relaxivities with water.2,3 Superparamagnetic iron oxide particles (SPIOs) can also be used as relaxation agents, and techniques are available for targeting various tissues. In particular, ferumoxytol is FDA-approved for the treatment of anemia, and currently used off label for blood pool imaging as well as targeted imaging of macrophages.4-7 Therefore, the targeted biodistribution of ferumoxytol could likewise potentially be applied to selectively suppress signal from particular tissue compartments in HP 13C MRI. In this study, we investigated the feasibility of using ferumoxytol as a relaxation agent for HP 13C compounds by measuring the T1 and T2 relaxivities of ferumoxytol for two commonly imaged HP 13C metabolites, namely [1-13C]pyruvate and [1-13C]lactate, making comparison to the commonly-used gadolinium chelate gadopentetate.METHODS
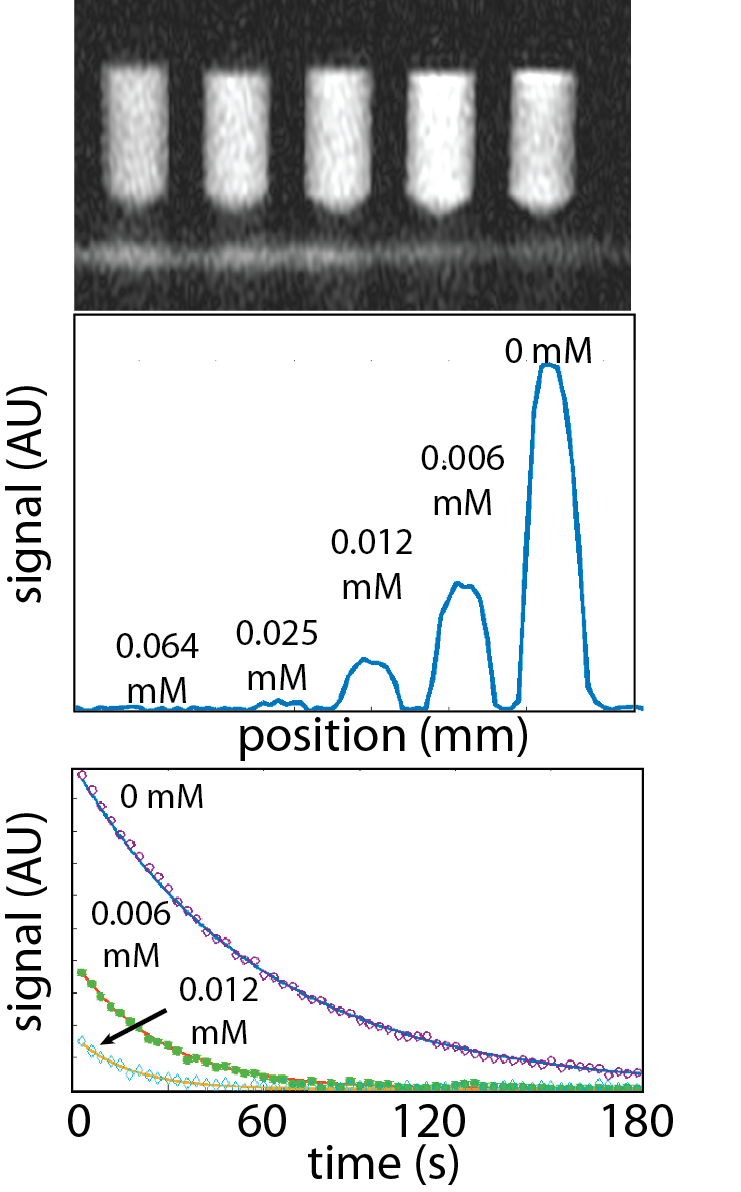
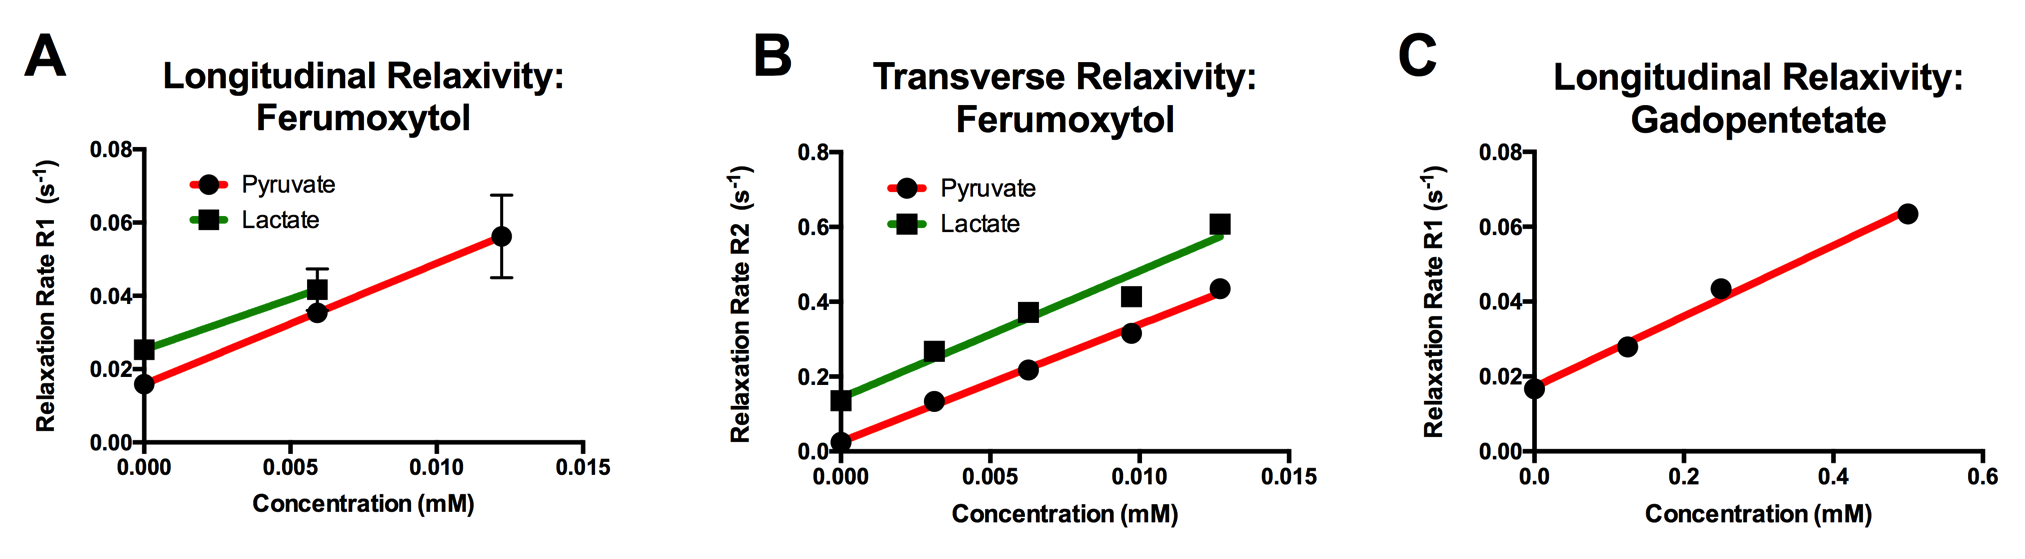
[1-13C]pyruvate and [1-13C]lactate were separately hyperpolarized for approximately 1 hour using a 3.35 T HyperSense Dynamic Nuclear Polarizer as previously described.1 Samples were rapidly dissolved in a superheated aqueous solution for a final concentration of approximately 80 mM HP material. Each dissolved sample was then aliquoted into five vials containing varying concentrations of either ferumoxytol (0-0.0125 mM) or gadopentetate (0-0.5 mM) (Figure 1). The total volume of each sample was approximately 1 mL, yielding net HP pyruvate or lactate concentrations of approximately 24 mM. The samples were then placed inside a dual-tuned 1H/13C quadrature coil and scanned using a 3 T imager (max gradient strength 50 mT/m). For both T1 and T2 measurements, we were able to measure multiple samples at the same time by placing a gradient along the z-axis, therefore encoding the spatial position of each sample by using its frequency. T1 measurements were performed by repeated application of a spoiled gradient echo acquisition, with flip angle 5 degrees and TR of 3 s. 60 data points were acquired for a total imaging time of 180 s. T2 measurements were performed using a CPMG pulse sequence consisting of a 90 degree pulse followed by multiple 180 degree pulses, with TR 10 ms, 4800 echoes, and total measurement time of 48 s. For both sets of measurements, relaxation rates (R1 or R2) were computed by fitting each peak to a decaying exponential (Figure 1). Longitudinal and transverse relaxivity (r1 and r2) were computed by making a linear fit between relaxation rate and concentration of each contrast agent.RESULTS
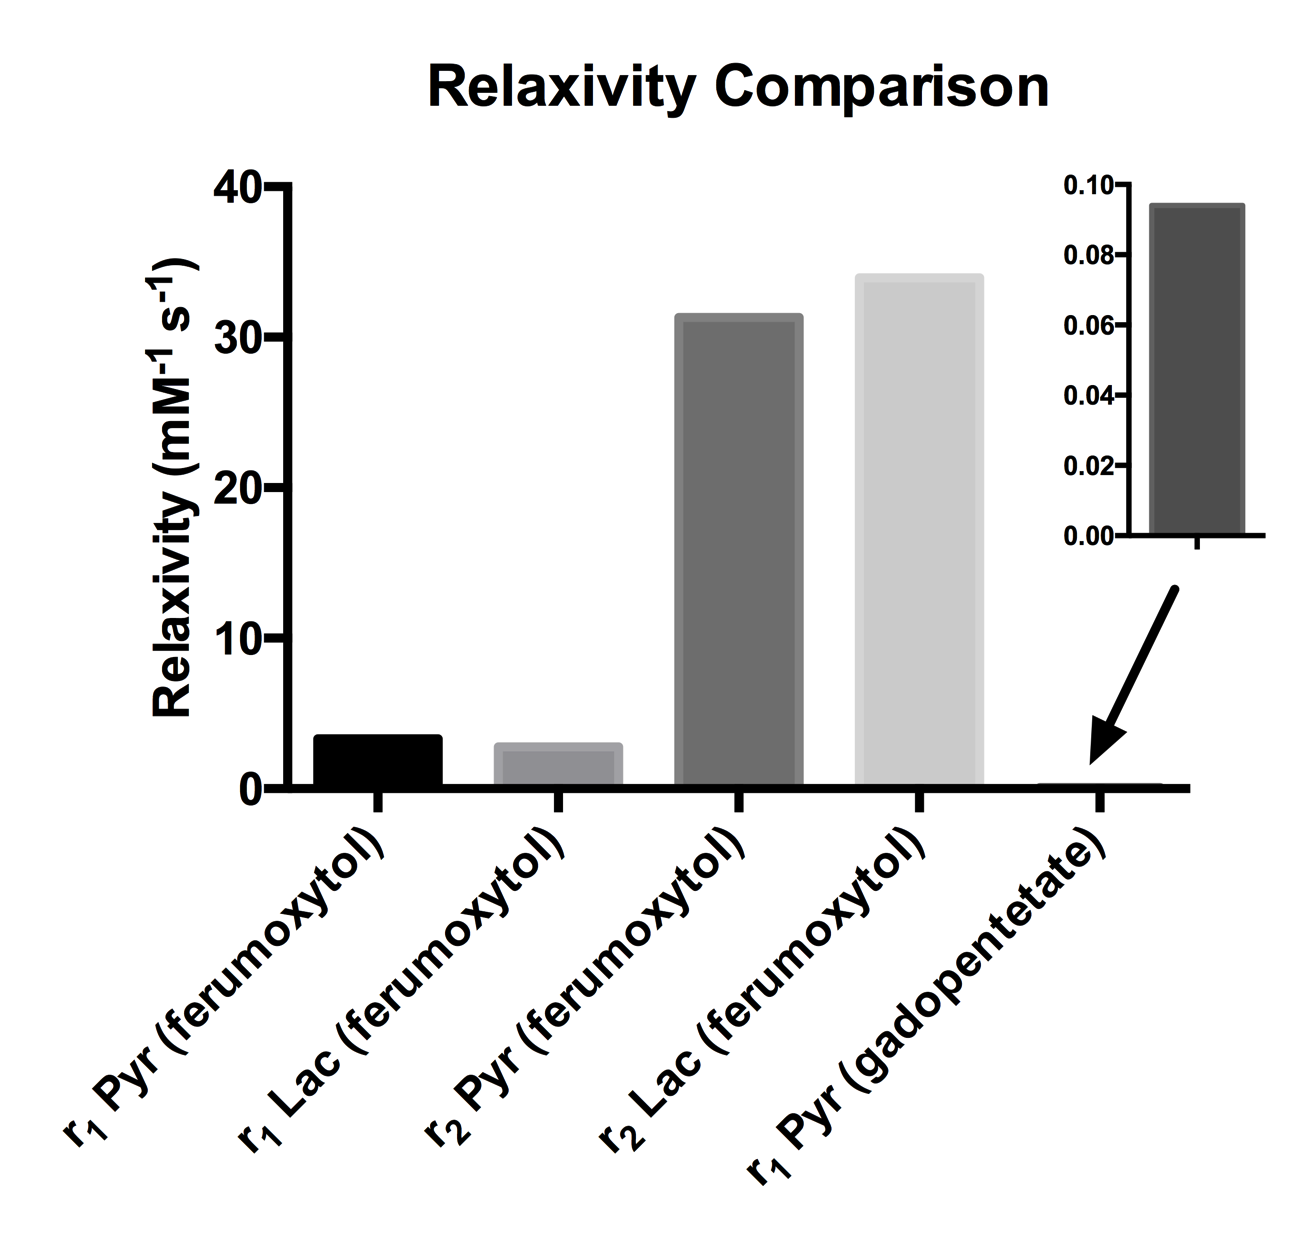
The T1 and T2 of [1-13C]pyruvate and [1-13C]lactate in solution were 63/24 s (T1/T2) and 39/7.8 s, respectively, which were consistent with previous measurements at 3T. Fits for the relaxivities of various compounds are shown in Figure 2. Comparisons of the measured relaxivities are shown in Figure 3. Longitudinal relaxivity (r1) of gadopentetate for [1-13C]pyruvate was 0.09 mM-1s-1, which is approximately 30-times lower than the known water relaxivity (3.3 mM-1s-1 at 3T). The longitudinal relaxivities of ferumoxytol for [1-13C]pyruvate and [1-13C]lactate were 3.3 and 2.8 mM-1s-1, respectively, which were approximately 37 and 31 times greater than the relaxivity of gadopentetate for pyruvate. Transverse relaxivities of ferumoxytol for [1-13C]pyruvate and [1-13C]lactate were even higher (31 and 34 mM-1s-1).DISCUSSION
Low longitudinal relaxivity of the gadolinium-based compound gadopentetate for [1-13C]pyruvate is consistent with previously published results for other gadolinium-based compounds.1-3 This difference in relaxivity between [1-13C]pyruvate and water is likely the result of the fourfold difference in gyromagnetic ratio as well as hindered inner sphere relaxation effects for carboxylic acid carbons. By contrast, ferumoxytol has much stronger relaxation effects on 13C compounds. Future experiments will be conducted to investigate whether this relationship extends in vivo.CONCLUSION
Ferumoxytol demonstrates very strong relaxation effects on 13C species, indicating high potential for use in tissue-selective evaluation of metabolism, for example by suppressing vascular signals. In addition, ferumoxytol is selectively taken up by inflammatory cells, and therefore could facilitate precise differentiation of HP signal arising from inflammatory cells as compared to other cell types. As an FDA approved compound used off label for imaging, there is a low barrier to human translation. Ferumoxytol’s particularly strong relaxation effects should lead to low dose requirements as compared to gadolinium compounds.Acknowledgements
This work was supported by NIH grants R21EB023605 and P41EB013598.References
1. Ohliger, M. A. et al. Combining hyperpolarized (13) C MRI with a liver-specific gadolinium contrast agent for selective assessment of hepatocyte metabolism. Magn Reson Med 77, 2356–2363 (2017).
2. van Heeswijk, R. B., Laus, S., Morgenthaler, F. D. & Gruetter, R. Relaxivity of Gd-based contrast agents on X nuclei with long intrinsic relaxation times in aqueous solutions. Magn Reson Imaging 25, 821–825 (2007).
3. Gabellieri, C., Leach, M. O. & Eykyn, T. R. Modulating the relaxivity of hyperpolarized substrates with gadolinium contrast agents. Contrast Media Mol Imaging 4, 143–147 (2009).
4. Smits, L. P. et al. Noninvasive Differentiation between Hepatic Steatosis and Steatohepatitis with MR Imaging Enhanced with USPIOs in Patients with Nonalcoholic Fatty Liver Disease: A Proof-of-Concept Study. Radiology 150952 (2015). doi:10.1148/radiol.2015150952
5. Hamilton, B. E. et al. Comparative Analysis of Ferumoxytol and Gadoteridol Enhancement Using T1- and T2-Weighted MRI in Neuroimaging. American Journal of Roentgenology 197, 981–988 (2011).
6. Khurana, A. et al. Intravenous ferumoxytol allows noninvasive MR imaging monitoring of macrophage migration into stem cell transplants. Radiology 264, 803–811 (2012).
7. Finn, J. P. et al. Cardiovascular MRI with ferumoxytol. Clinical Radiology 71, 796–806 (2016).
Figures