3715
A Multimodal Imaging Approach to Characterize the Onset of Pulmonary Fibrosis1Radiology, University of Pennsylvania, Philadelphia, PA, United States
Synopsis
Pulmonary fibrosis is typically an progressive, irreversible disease. However, in many cases, the onset of fibrosis is preceded by persistent inflammation; unfortunately, the two presentations are challenging to assess radiologically, and misdiagnoses can limit treatment options. In this in vivo rat study, the metabolic state the lung—derived via HP [1-13C]-pyruvate MRSI—and the structural heterogeneity of the lung—imaged via CT—were used in tandem to distinguish healthy lungs, inflamed lungs, and lungs with early onset fibrosis, creating an extremely sensitive tool for differentiating between the different phases of pulmonary fibrosis.
Introduction
Irreversible, progressive pulmonary fibrosis (PF) in the lungs can have many different etiologies, including environmental exposure (e.g. asbestos), drug-related toxicity, radiotherapy or even an unknown cause (IPF). Histopathologically, PF typically presents as usual interstitial pneumonia (UIP) in the lungs, and requires confirmation via high resolution computed tomography (HRCT) and/or biopsies. In many cases, the onset of fibrosis is preceded by persistent inflammation [1]; unfortunately, the two presentations are challenging to assess radiologically, and misdiagnoses can limit treatment. It has been previously shown that an elevated hyperpolarized (HP) lactate-to-pyruvate ratio (L2P) can be used be used as a biomarker for inflammation [2]. However, this increased L2P does not persist at the onset of fibrosis. In this in vivo rat study, the metabolic state the lung—derived via HP [1-13C]-pyruvate MRSI—and the structural heterogeneity of the lung—imaged via CT—were used in tandem to distinguish healthy lungs, inflamed lungs, and lungs with early onset fibrosis.Methods
Intratracheal instillation of bleomycin (2.5U/kg) was used to induced lung injury. Cohorts of Sprague-Dawley rats (n=12) were imaged on day 0 (healthy), day 7 (inflammation), day 14 (onset of fibrosis), and day 21 (fibrosis). Animals were imaged in the supine position in a 4.7T magnet (Varian Inc.). HP [1-13C]-pyruvate (28.6mg, 15mM OX063, 1.5mM Dotarem Gd) was polarized using a HyperSense DNP polarizer, and ~1.6mL (4mL/kg, 80mM) of HP agent was injected via the tail vein over a period of 6s. HP [1-13C]-pyruvate chemical shift imaging (CSI) was performed using a 2D slice selective phase-encoded FID-CSI sequence (TR/TE=35.7/0.35ms, α=12°, FOV=45x45x15mm3), as previously reported [3]. Custom MATLAB routines were used to reconstruct, process, fit, and analyze the MR spectra. Voxels for quantifying lactate and pyruvate in the lungs were manually selected to avoid signals derived from the heart and thoracic muscles. Scans from gated μCT (current= 60mA, voltage= 40kV, reconstructed isotropically at 200 um) were segmented using ITK-SNAP to obtain lung tissue density and heterogeneity.Results
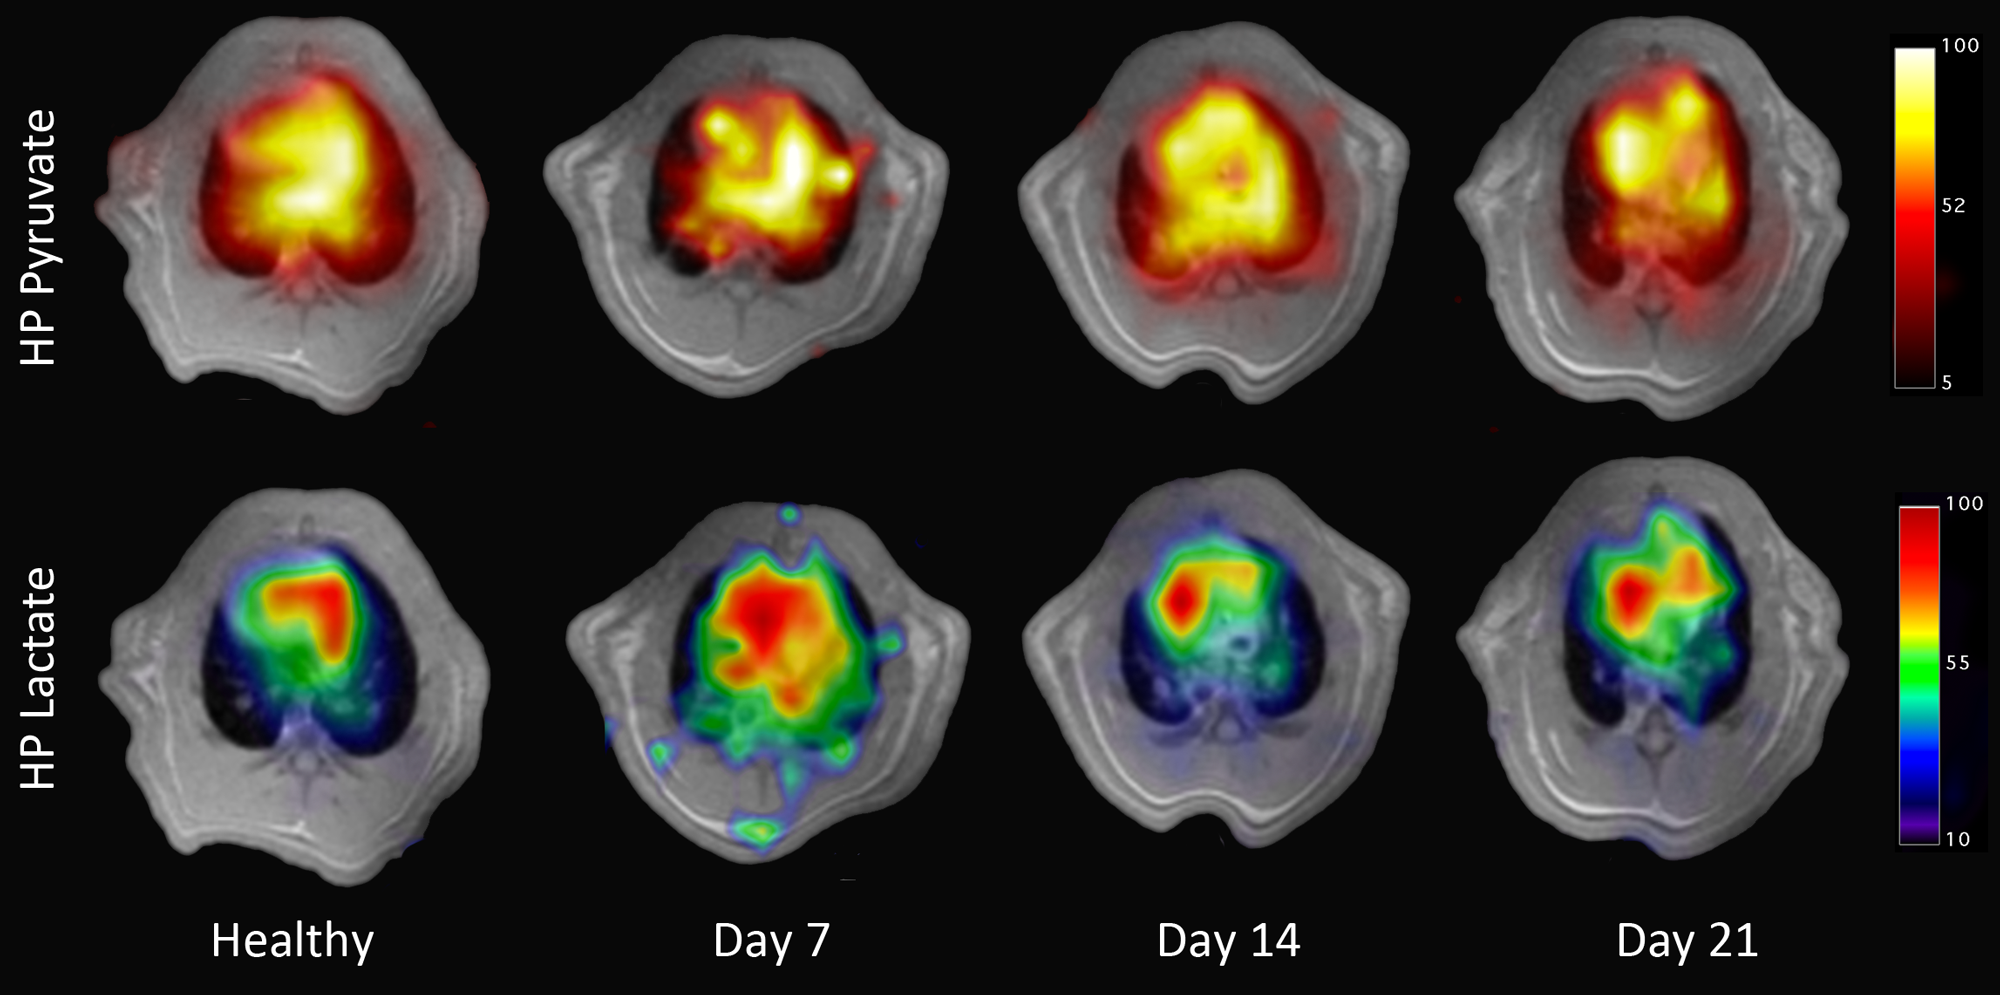
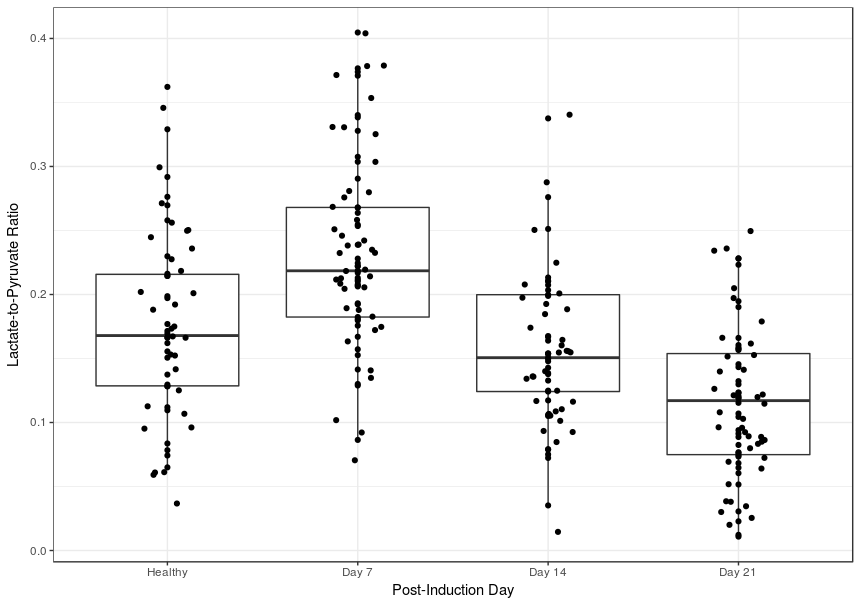
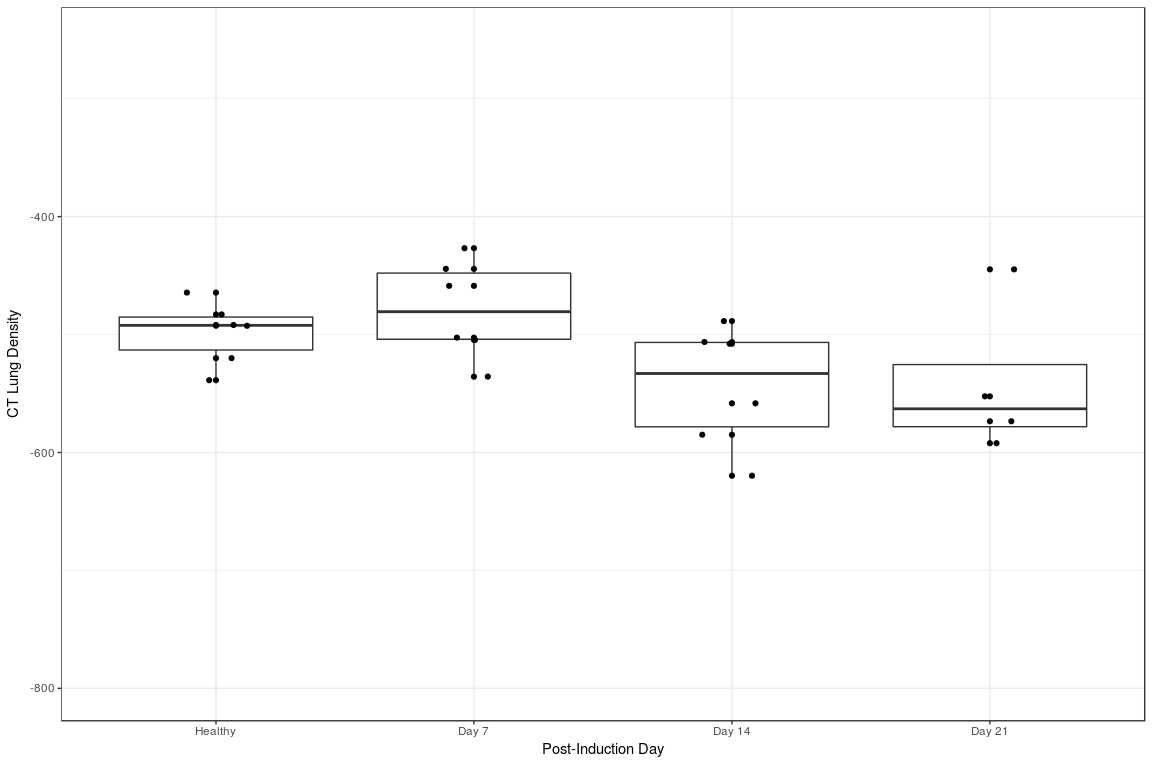
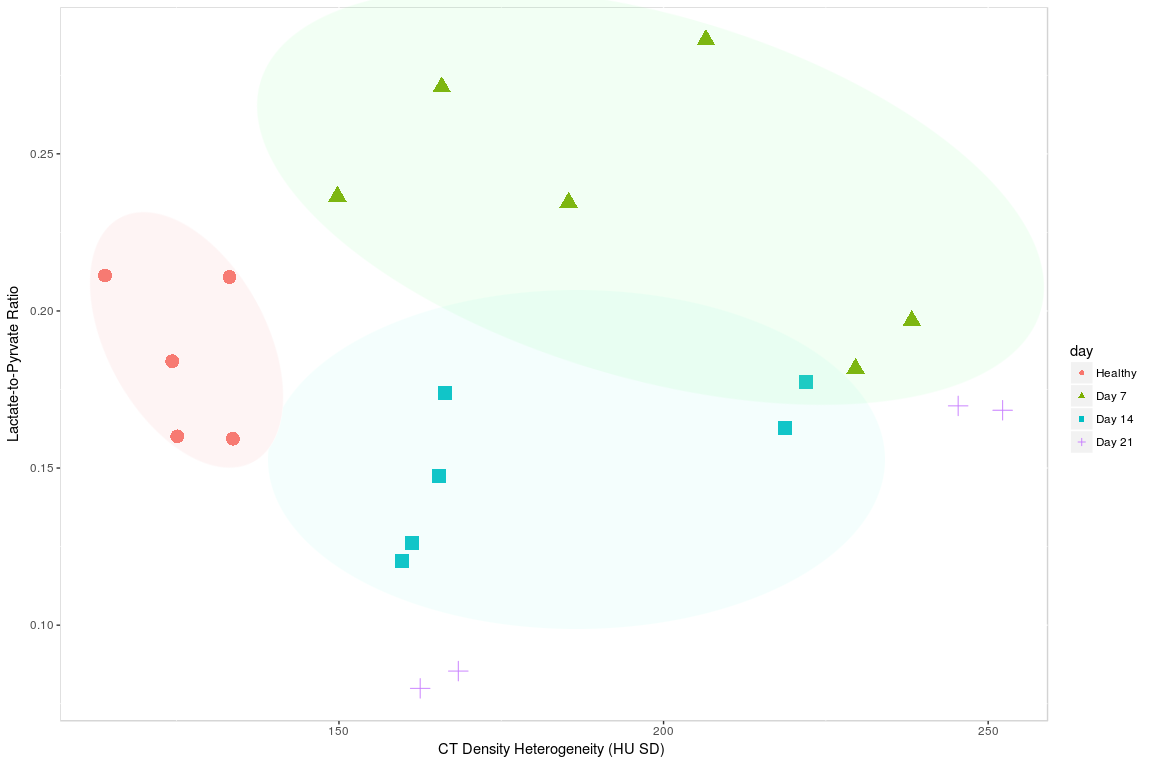
Figure 1 shows a representative HP pyruvate and lactate distribution in the four different cohorts. The pyruvate distribution is similar at all four time-points, suggesting unperturbed perfusion. The HP lactate signal is highest on day 7, while the other three cohorts are qualitatively indistinguishable from each other. Figure 2 shows the quantitative distribution of the HP lactate-to-pyruvate ratio (L2P). The inflamed cohort (day 7) has a L2P of 0.24±0.08, which is significantly greater than that of the healthy (0.18±0.8, p = 0.004), day 14 (0.16±.06, p < 0.001) and day 21 (0.11±.06, p < 0.001) cohorts, which were not significantly different from each other. Although the mean density of the lungs was within a narrow band of -478 to -541 HU (figure 3), the lung heterogeneity as measured by the standard deviation of all the voxels in the segmented lungs was significantly different between the healthy (125±7 HU) and the Day 7 (196±35 HU, p = 0.004), Day 14 (182±30 HU, p = 0.004 ) and Day 21 (207±48 HU, p < 0.04) cohorts. The L2P was plotted versus lung heterogeneity in figure 4, which shows that the two metrics can be used in tandem to clearly distinguish between healthy, inflamed (day 7), and early onset of fibrosis (day 14) cohorts.Discussion
The increased lactate-to-pyruvate seen during the inflamed stage (day 7) of bleomycin-induced lung injury is most likely due to increased glycolytic activity of the neutrophils, as previously reported [2]. As the injury progresses to fibrosis, the inflammatory cells decrease, resulting in a subsequent decrease in the lactate-to-pyruvate ratio on days 14 and 21. Contrarily, tissue heterogeneity significantly increases during both the inflammatory phase and the early onset of fibrosis due to the cellular infiltrate and collagen deposits in the parenchyma, respectively.Conclusion
This study demonstrates that HP lactate-to-pyruvate and CT-derived tissue heterogeneity can be used as a multimodal biomarker to distinguish healthy tissue, inflamed tissue, and fibrotic tissue from one another, creating an extremely sensitive tool for differentiating between the different phases of pulmonary fibrosis.Acknowledgements
No acknowledgement found.References
[1] T. A. T. S. (ats) and T. E. R. S. (ers), “Idiopathic Pulmonary Fibrosis: Diagnosis and Treatment. International Consensus Statement,” 2000.
[2] H. Shaghaghi et al., “Metabolic spectroscopy of inflammation in a bleomycin-induced lung injury model using hyperpolarized 1-13C pyruvate,” NMR Biomed., vol. 27, no. 8, pp. 939–947, Aug. 2014.
[3] M. Pourfathi et al., “In vivo imaging of the progression of acute lung injury using hyperpolarized [1‐13C] pyruvate,” Magn. Reson. Med., Jan. 2017.
Figures