3713
Detection of Targeted Therapy Treatment Response using Hyperpolarized Magnetic Resonance Spectroscopy in Breast Cancer Cell Lines1Memorial Sloan Kettering Cancer Center, New York, NY, United States
Synopsis
Hyperpolarized magnetic resonance spectroscopy (HP-MRS) allows non-invasive real-time monitoring of cancer metabolism. This unique ability allows investigation of changes in cancer metabolism after therapy. This study demonstrates the utility of this modality to detect lowered conversion of hyperpolarized pyruvate to lactate after targeted therapy against a commonly mutated growth signaling pathway in cancer. We also demonstrate changes in enzyme phosphorylation that may explain changes in HP-MRS.
Purpose
Hyperpolarized magnetic resonance spectroscopy (HP-MRS) has greatly increased the sensitivity of detection for 13C NMR and has the unique ability of assessing the metabolism of endogenous biomolecules1. While HP-MRS is able to detect chemotherapeutic response2, few studies have investigated the utility of HP-MRS for targeted therapy in cancer. The phosphoinositide 3-kinase (PI3K)/AKT/mammalian target of rapamycin (mTOR) or PAM pathway is one of the most commonly mutated signaling pathways in human malignancies3. Using HP-MRS to assess treatment response in PAM inhibition is supported by the central role this signaling pathway plays in cellular metabolism. The PAM pathway has been called the ‘master regulator of aerobic glycolysis' 4. For example, AKT has been shown to regulate localization of the glucose transporter (GLUT1)5, to control expression6 and activity7 of hexokinase as well as a role in phosphorylating phosphofructokinase-2 (PFK2)8. This study investigates the ability of HP pyruvate to detect treatment response in PAM-mutated and wild-type breast cancer cell lines. We then proceeded to explore the molecular mechanisms that control metabolism by focusing on glycolytic enzyme phosphorylation in these cell lines.Materials and Methods
MCF7 and MDA-MB-231 cells were cultured in complete DMEM. [1-13C] pyruvate was prepared for HP according to published reports9 using a prototype SpinLab (General Electric, NY) before dissolving to a final concentration of 5mM in a suspension of cells. Spectra were acquired on a 1T Magritek spectrometer (Magritek, San Diego, CA) using a 10° flip angle every 5 s for 25 scans. The sum of all spectra was quantified by taking the ratio of lactate to pyruvate hydrate. 25 μg of total protein were loaded for Western blotting.Results
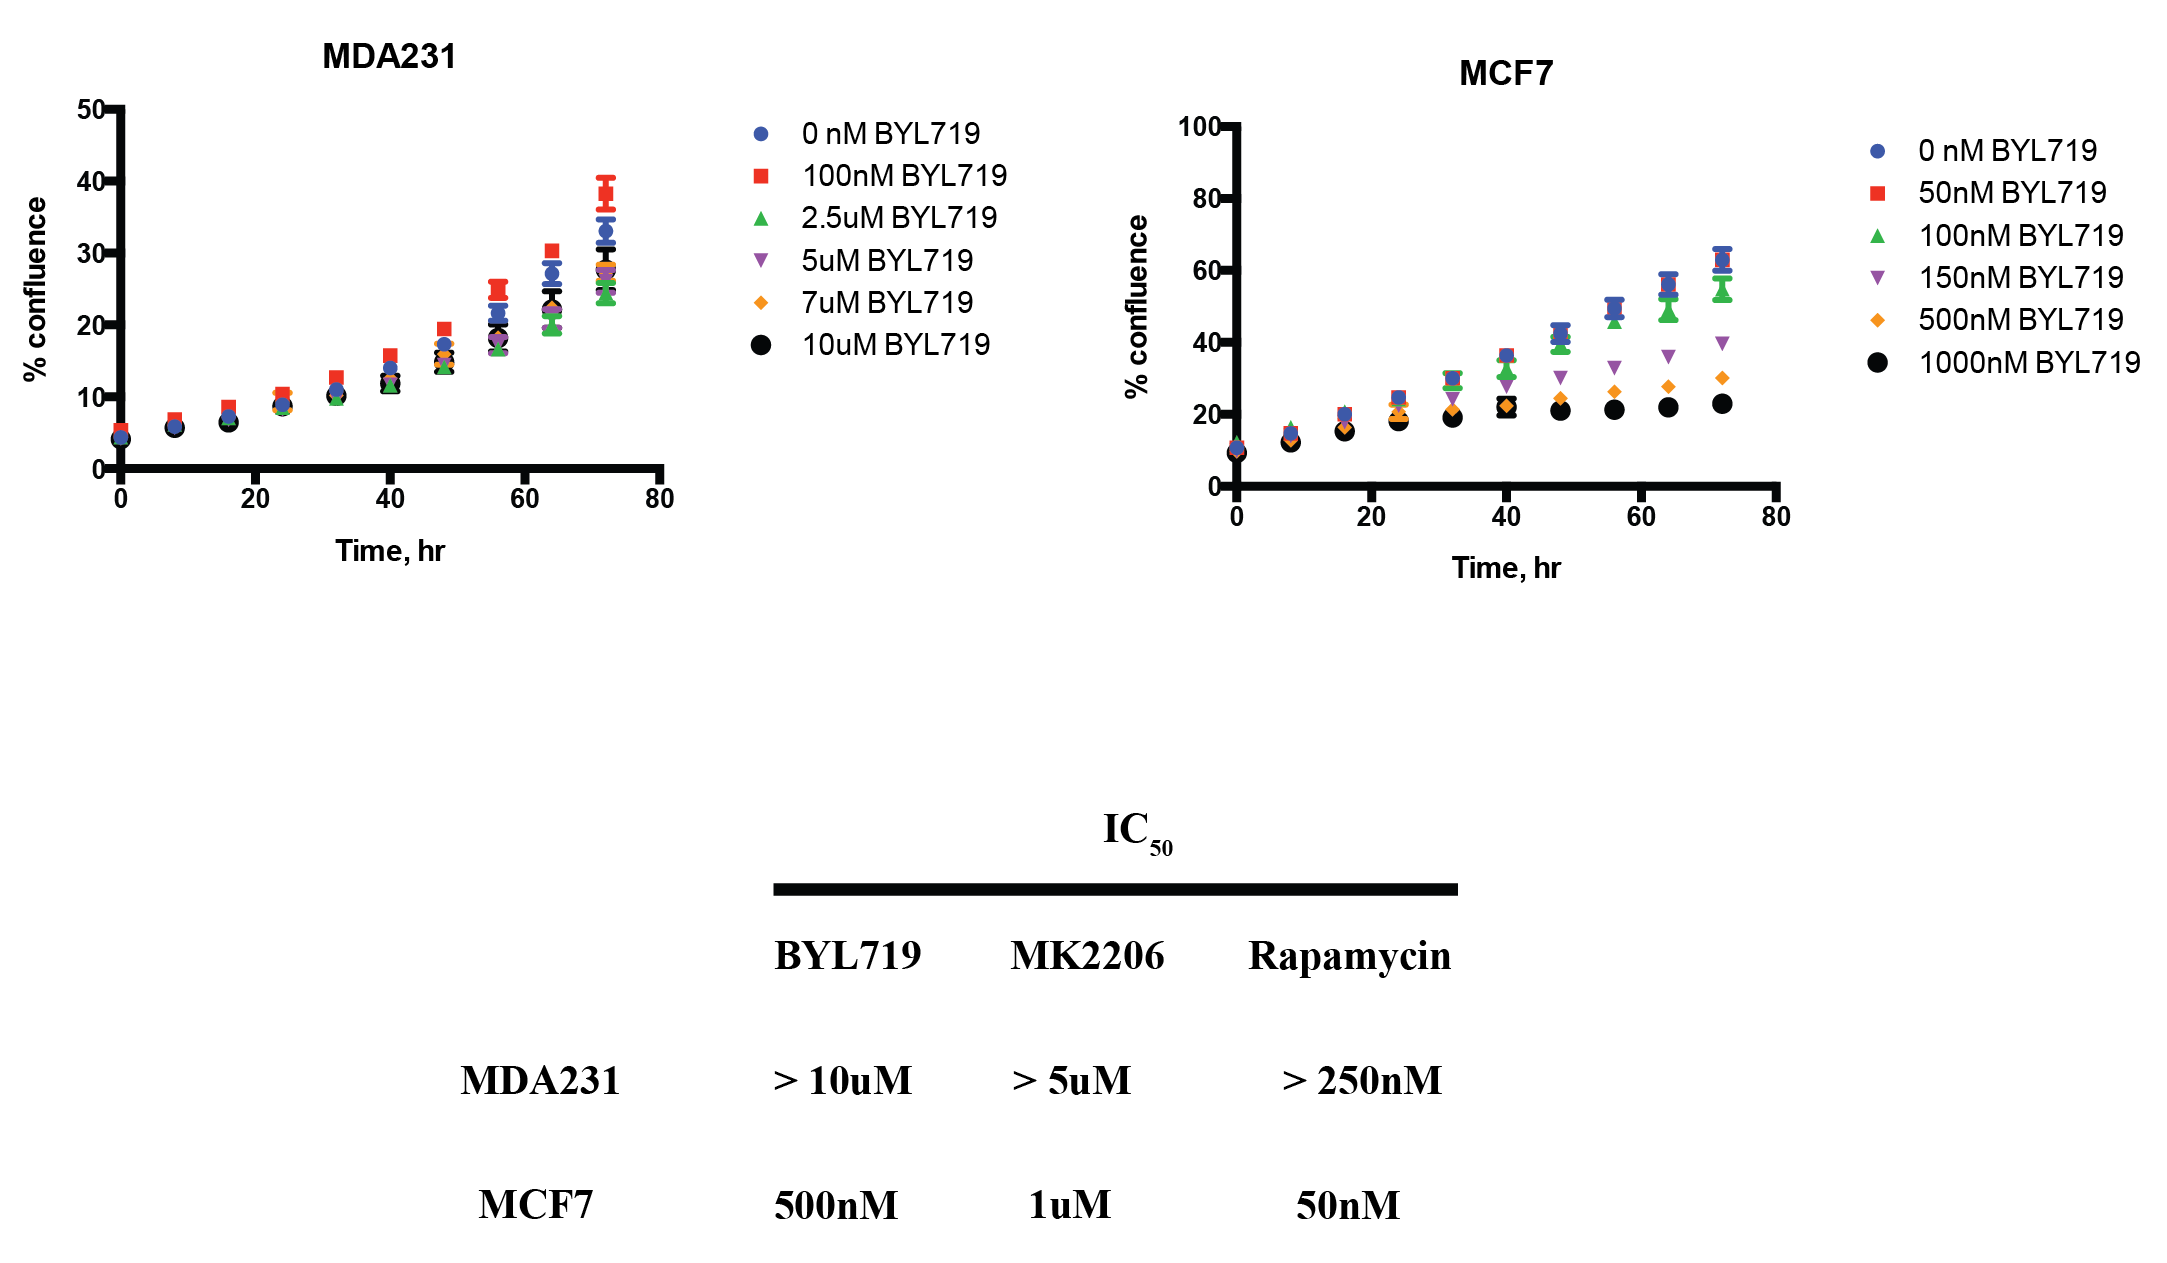
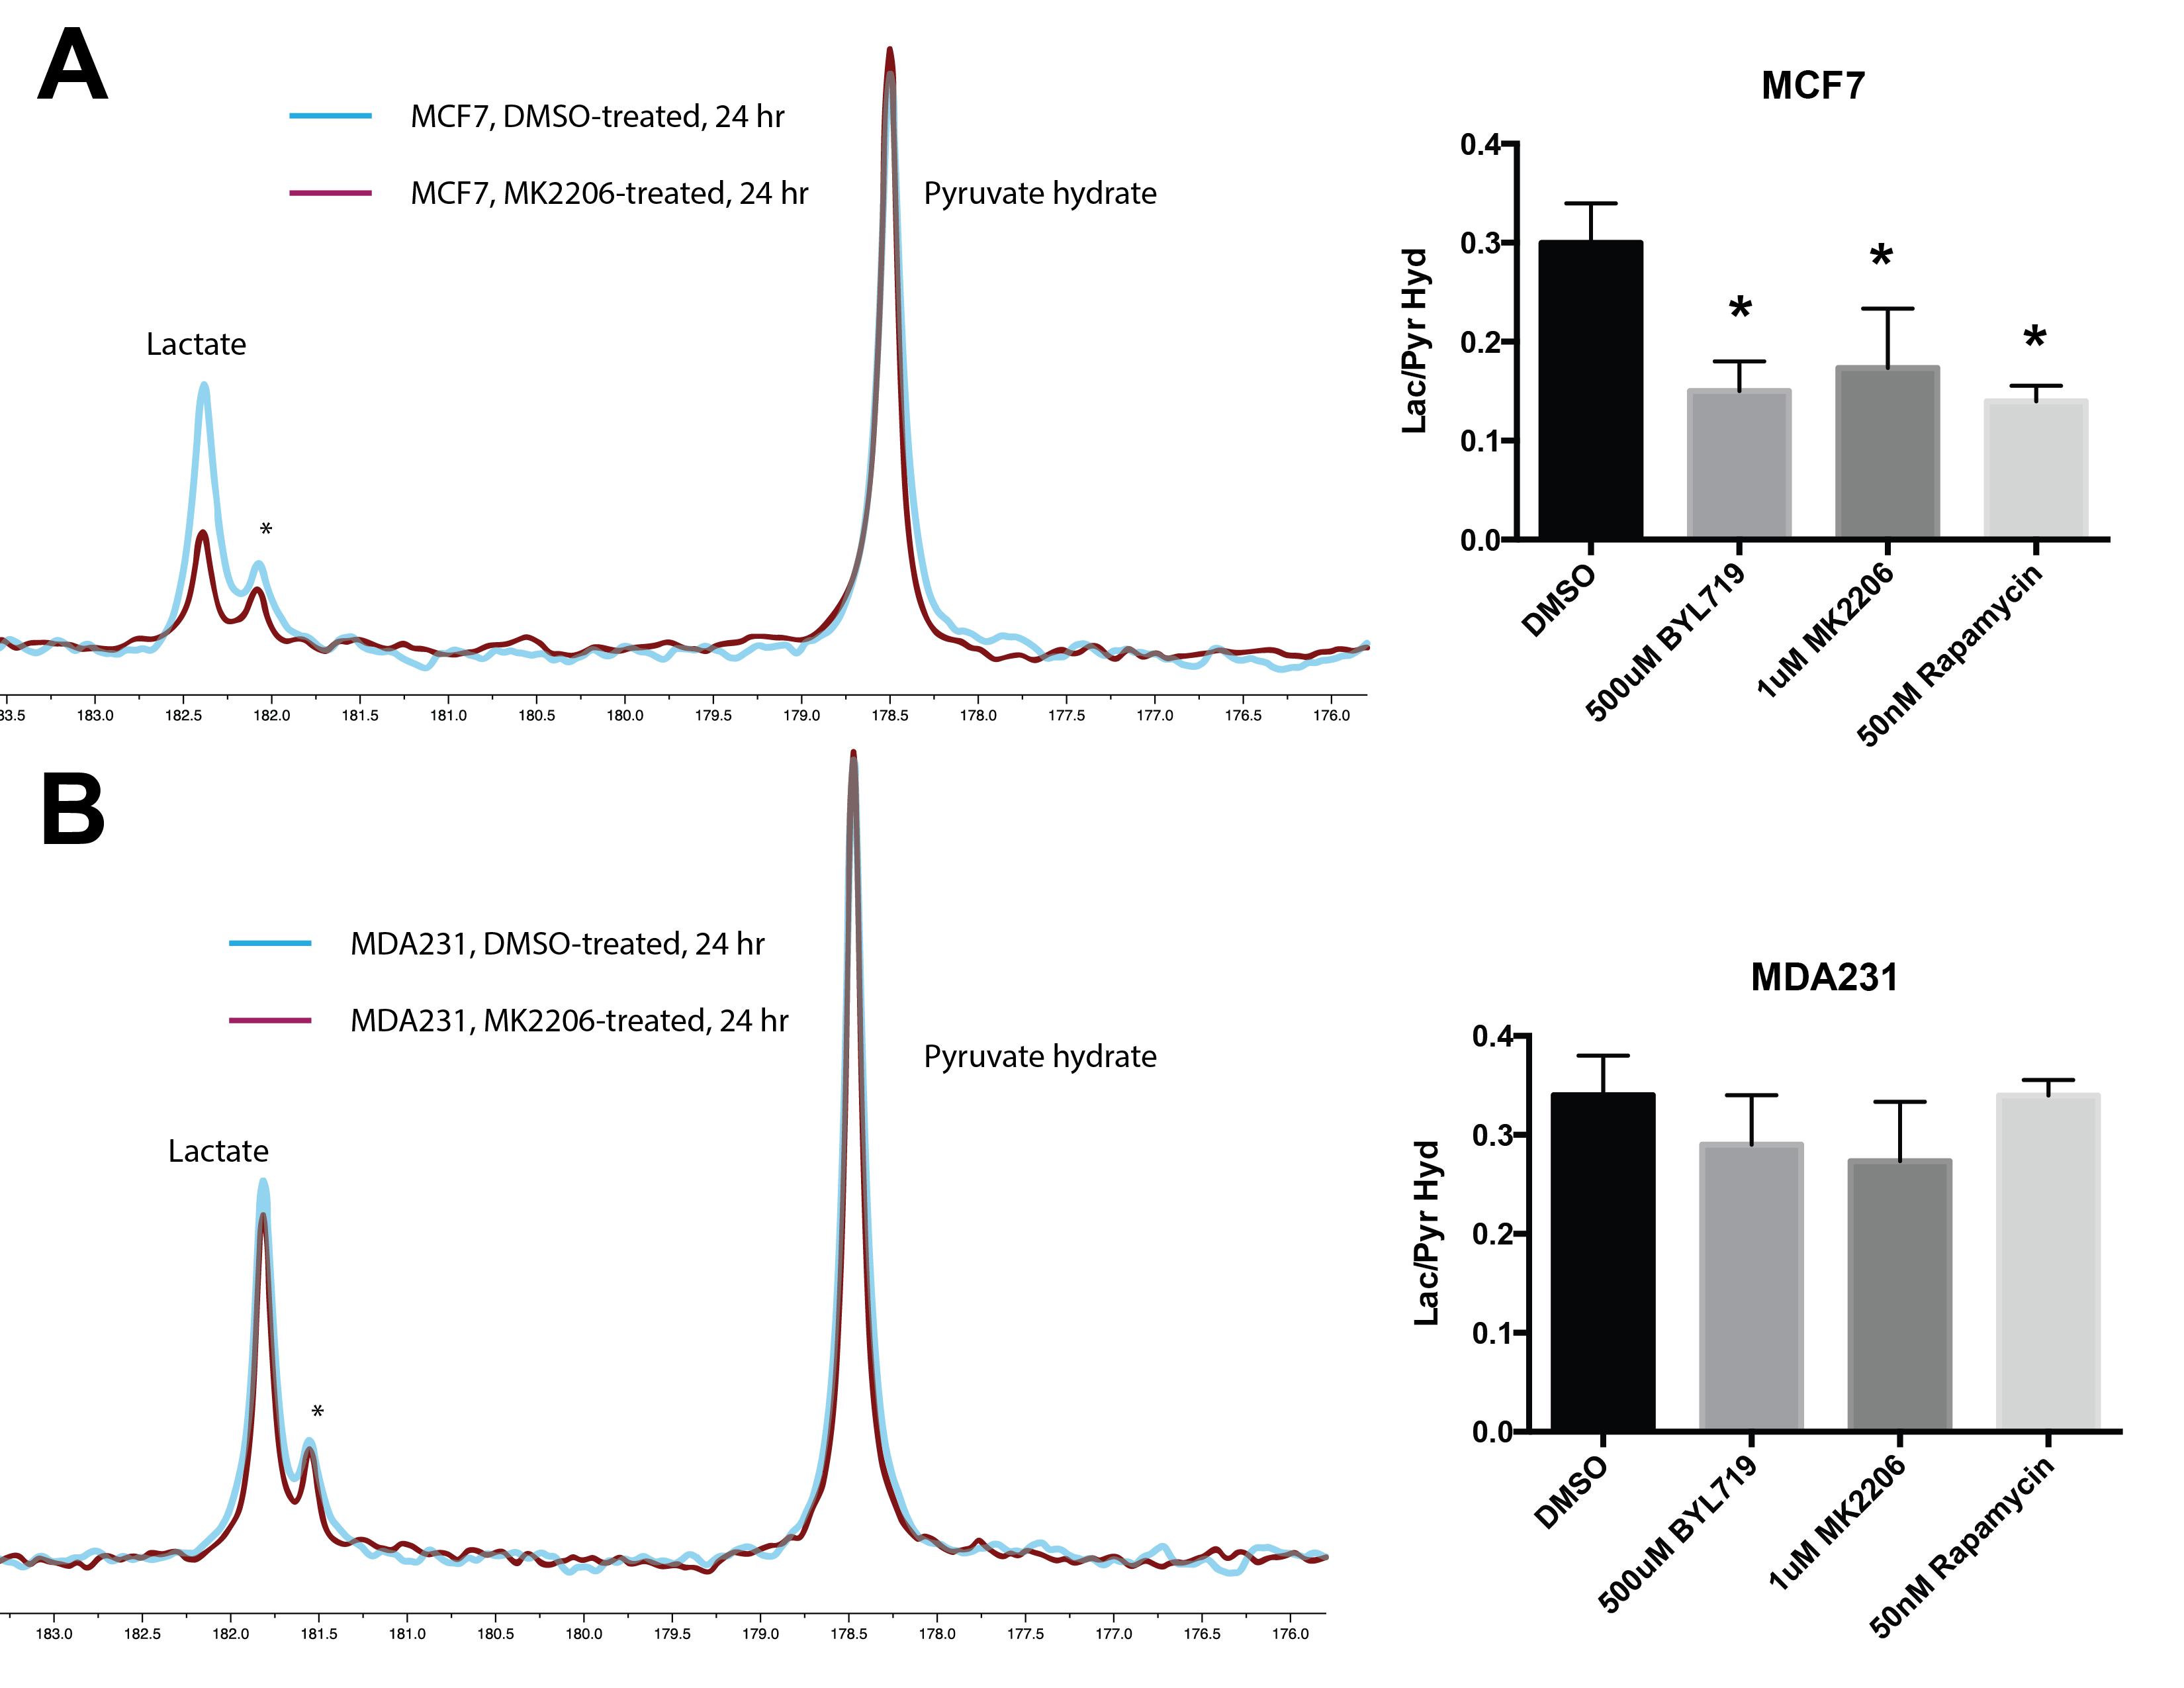
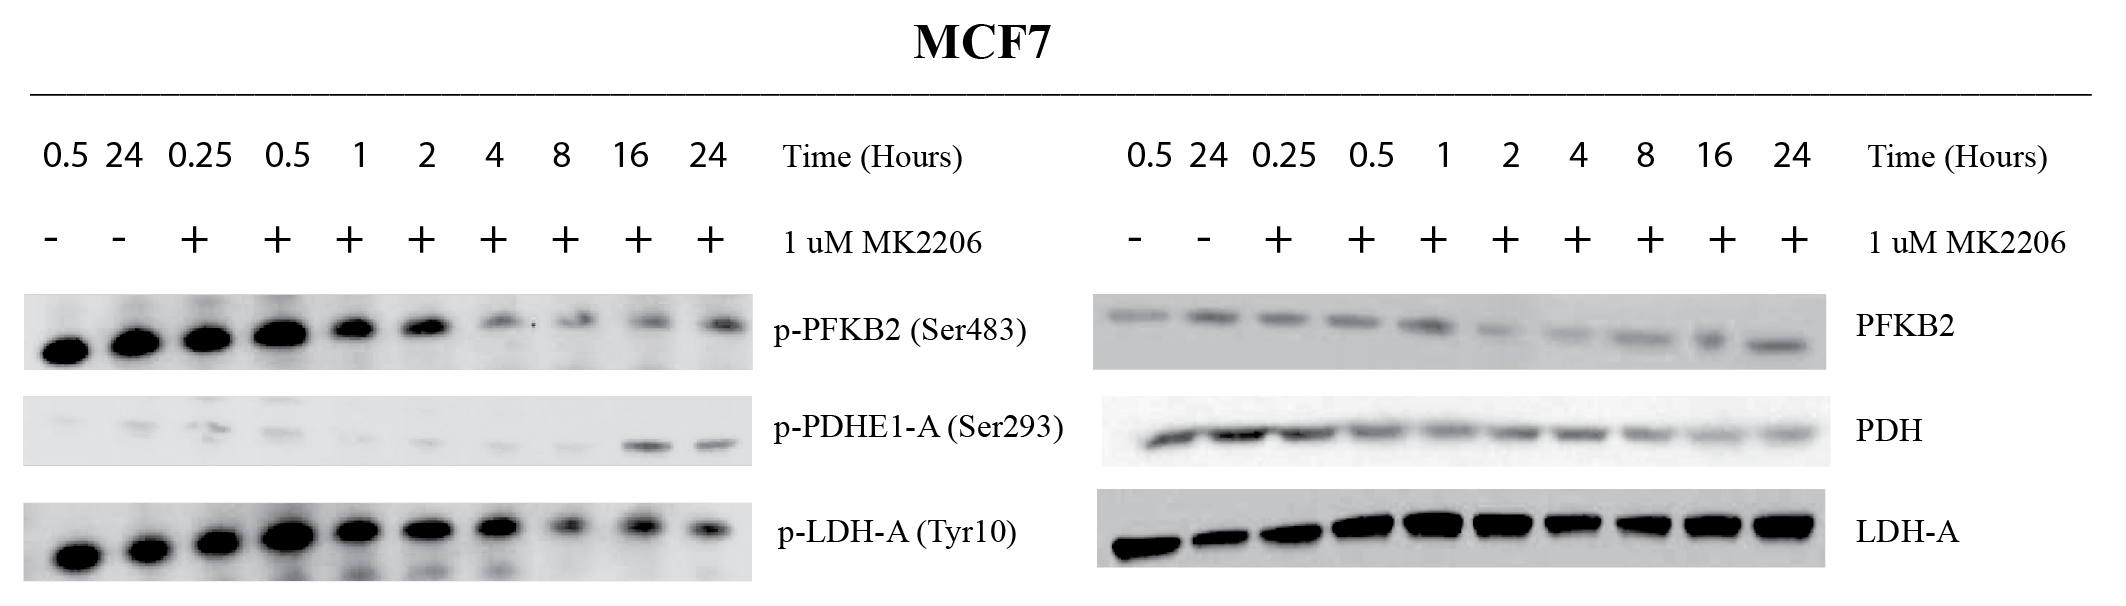
MCF7 (PAM pathway mutant) and MDA-MB-231 (PAM wild-type) were subjected to increasing concentrations of therapies targeted against the PAM pathway. These include BYL719 (PI3K-inhibitor), MK2206 (AKT inhibitor) and rapamycin (mTOR inhibitor). Figure 1 shows a representative growth curve of these two cell lines. The IC50 (drug concentration that inhibits growth by 50%) was determined for all the drugs. HP pyruvate was then used to determine metabolic treatment response to targeted therapy. As a proof of concept, MCF7 and MDA231 cells were treated with 1µM MK2206 for 24 hr and probed for metabolism of hyperpolarized [1-13C] pyruvate. Pyruvate hydrate, from the spontaneous hydration of pyruvate is visible at ~178 ppm while lactate resonates at ~183 ppm. Quantification of HP lactate production, as a ratio of pyruvate hydrate, in these cells revealed that AKT inhibition of MCF7 cells produced 0.206 ± 0.10 units compared to vehicle-treatment (0.516 ± 0.04 units), as seen in Figure 2A. In contrast, MDA231 cells produced similar amounts of lactate from delivery of hyperpolarized pyruvate, regardless of MK2206 treatment (Figure 2B). Similar trends were also observed with BYL719 and rapamycin. To uncover the molecular mechanism governing changes in metabolism, Western blots were performed. Figure 3 shows representative Western blots of phosphofructokinase B2 (PFKB2), pyruvate dehydrogenase E1-A (PDHE1-A) and lactate dehydrogenase-A (LDH-A). There were minimal changes in total protein content, but changes in the phosphorylation of specific residues were observed for all 3 enzymes over time. While phosphorylation of PFKB2 and LDH (at serine 483 and tyrosine 10, respectively) decreases over time, phosphorylation of PDHE1-A at residue serine 293 increases.Discussion
The development of PAM inhibitors will benefit from the ability to reliably measure treatment response in patients 10. Effective assessment of cancer therapy using non-invasive imaging techniques could guide selection of the most suitable drugs with concomitant benefits to the patient and the healthcare system 11. In this study, we have shown that targeted therapy of breast cancer cells results in metabolic changes that can be detected using hyperpolarized MRS. Regardless of the specific node targeted in a pathway, we have observed decreased pyruvate-to-lactate flux as long as the cell is sensitive to a particular therapy due to genomic mutations. We have also observed changes in phosphorylation of metabolic enzymes after treatment in sensitive cell lines. Phosphorylation and other post-translational modifications (PTMs) can affect the rate of enzyme kinetics and may explain the reduced HP pyruvate flux in MCF7 cells.Conclusion
HP-MRS is able to differentiate treatment response in PAM pathway-mutant MCF7 cells and wild type MDA-MB-231 wild type cells when exposed to targeted therapy against this pathway. This change in metabolism can be explained by changes in phosphorylation of metabolic enzymes. Post-translational modification of enzymes such as phosphorylation may account for the rapid changes in metabolic flux observed with HP compounds and warrants further investigation.Acknowledgements
This research was funded in part through the NIH/NCI Cancer Center Support Grant P30 CA008748 and NIH/NIBIB R00 EB014328 as well as Memorial Sloan Kettering’s Center for Molecular Imaging and Nanotechnology (CMINT).References
1 Tee, S. S. & Keshari, K. R. Novel Approaches to Imaging Tumor Metabolism. Cancer journal 21, 165-173, doi:10.1097/PPO.0000000000000111 (2015).
2 Day, S. E., Kettunen, M. I., Gallagher, F. A. et al. Detecting tumor response to treatment using hyperpolarized C-13 magnetic resonance imaging and spectroscopy (vol 13, pg 1382, 2007). Nature medicine 13, 1521-1521, doi:Doi 10.1038/Nm1207-1521 (2007).
3 Weigelt, B. & Downward, J. Genomic Determinants of PI3K Pathway Inhibitor Response in Cancer. Front Oncol 2, 109, doi:10.3389/fonc.2012.00109 (2012).
4 Mosca, E., Alfieri, R., Maj, C. et al. Computational modeling of the metabolic states regulated by the kinase Akt. Front Physiol 3, doi:Unsp 418 Doi 10.3389/Fphys.2012.00418 (2012).
5 Kim, D. I., Lim, S. K., Park, M. J. et al. The involvement of phosphatidylinositol 3-kinase/Akt signaling in high glucose-induced downregulation of GLUT-1 expression in ARPE cells. Life Sci 80, 626-632, doi:Doi 10.1016/J.Lfs.2006.10.026 (2007).
6 Vander Heiden, M. G., Plas, D. R., Rathmell, J. C. et al. Growth factors can influence cell growth and survival through effects on glucose metabolism. Mol Cell Biol 21, 5899-5912, doi:Doi 10.1128/Mcb.21.17.5899-5912.2001 (2001).
7 Miyamoto, S., Murphy, A. N. & Brown, J. H. Akt mediates mitochondrial protection in cardiomyocytes through phosphorylation of mitochondrial hexokinase-II. Faseb J 22 (2008).
8 Deprez, J., Vertommen, D., Alessi, D. R. et al. Phosphorylation and activation of heart 6-phosphofructo-2-kinase by protein kinase B and other protein kinases of the insulin signaling cascades. The Journal of biological chemistry 272, 17269-17275 (1997).
9 Tee, S. S., DiGialleonardo, V., Eskandari, R. et al. Sampling Hyperpolarized Molecules Utilizing a 1 Tesla Permanent Magnetic Field. Sci Rep-Uk 6, doi:ARTN 32846 10.1038/srep32846 (2016).
10 Engelman, J. A. Targeting PI3K signalling in cancer: opportunities, challenges and limitations. Nat Rev Cancer 9, 550-562, doi:10.1038/nrc2664 (2009).
11 Brindle, K. New approaches for imaging tumour responses to treatment. Nat Rev Cancer 8, 94-107, doi:10.1038/nrc2289 (2008).
Figures