3712
Characterization of Distinctive in vivo Metabolism between Enhancing and Non-enhancing Brain Tumors Using Hyperpolarized Carbon-13 MRI1Radiology, Chonnam National University Hwasun Hospital, Hwasun, Republic of Korea, 2Radiology, Chonnam National University Medical School and Hospital, Gwanju, Republic of Korea
Synopsis
This study applied 13C MR metabolic imaging with hyperpolarized [1-13C]pyruvate for the differential characterization of metabolic profiles between enhancing and non-enhancing brain tumors. The levels of lactate, which was normalized by vascular total carbon signal, were significantly different between the contralateral brain, non-enhancing and enhancing tumor, while the levels of pyruvate were similar between these three tissues. The results from this study suggested that this technique may be useful in distinguishing functional characteristics between normal brain tissue and heterogeneous anatomical lesions in brain tumors.
Introduction
The development of hyperpolarized carbon-13 (13C) metabolic MRI has enabled the sensitive and noninvasive assessment of real-time in vivo metabolism in tumors using a tracer [1-13C]pyruvate. There have been a number of studies exploring the feasibility of using hyperpolarized 13C metabolic imaging for neuro-oncology applications, however, most of these studies used high-grade enhancing tumor models1-2. The characterization of metabolic patterns from hyperpolarized 13C imaging in non-enhancing tumor and comparison with enhancing tumor would be beneficial not only for understanding distinct metabolic features between the two lesions but also for providing a basis for comprehending 13C metabolic processes in on-going clinical trials with neuro-oncology patients using this technology3. In this study, we used 13C MR spectroscopic imaging (MRSI) with hyperpolarized [1-13C]pyruvate for the differential characterization of metabolic profiles between enhancing and non-enhancing brain tumors.Methods
For non-enhancing tumors, primary human diffuse midline glioma cells (SF8628) were implanted into the brain of athymic rats (n=8). 3D 13C MRSI data were acquired from rats bearing non-enhancing tumors, following an injection of hyperpolarized [1-13C]pyruvate using a clinical 3T scanner and a custom-built 1H/13C RF coil. In order to quantify 13C metabolites, lactate, pyruvate, and total carbon (tC: a sum of lactate, pyruvate-hydrate, alanine, and pyruvate) were calculated for each voxel using peak heights from magnitude spectra. In addition, lactate and pyruvate signals were normalized by maximum vascular tC signal (Lac/maxtCB and Pyr/maxtCB, respectively). The 13C metabolic parameters between the non-enhancing tumor and contralateral normal brain were compared using a paired t-test. The 13C metabolic parameters from the non-enhancing tumor were compared with the previously acquired enhancing tumor data, which were obtained from rats bearing human glioblastoma cells (U87-MG, n=5 and G55, n=5)4 using an unpaired t-test.Results and Discussion
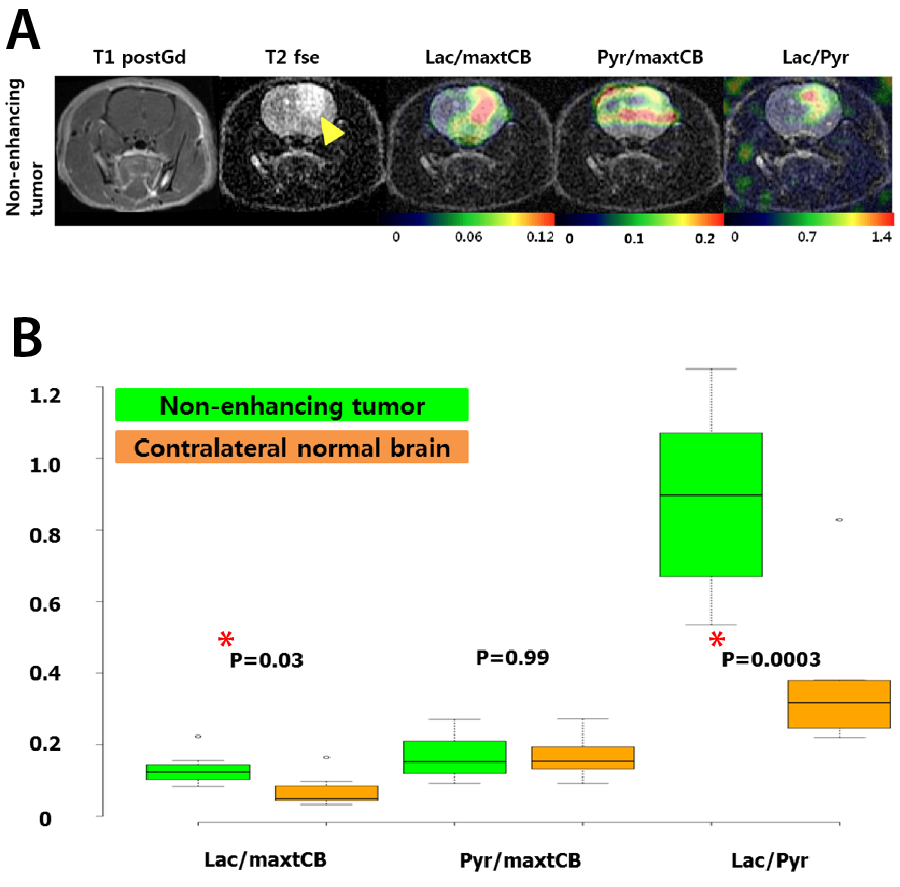
Non-enhancing tumors showed distinct metabolic patterns compared to the contralateral normal brain: Figure 1 shows the comparison of hyperpolarized 13C imaging findings from the non-enhancing tumors. Similar to the previous data from enhancing tumor, which demonstrated distinct metabolic patterns between the enhancing tumor and contralateral normal brain4, the levels of lactate normalized by vascular tC signal (Lac/maxtCB) and lactate to pyruvate (Lac/Pyr) from the non-enhancing tumor were significantly higher in the non-enhancing tumors compared to the contralateral normal brain (p<0.03 for Lac/maxtCB and p<0.001 for Lac/Pyr).
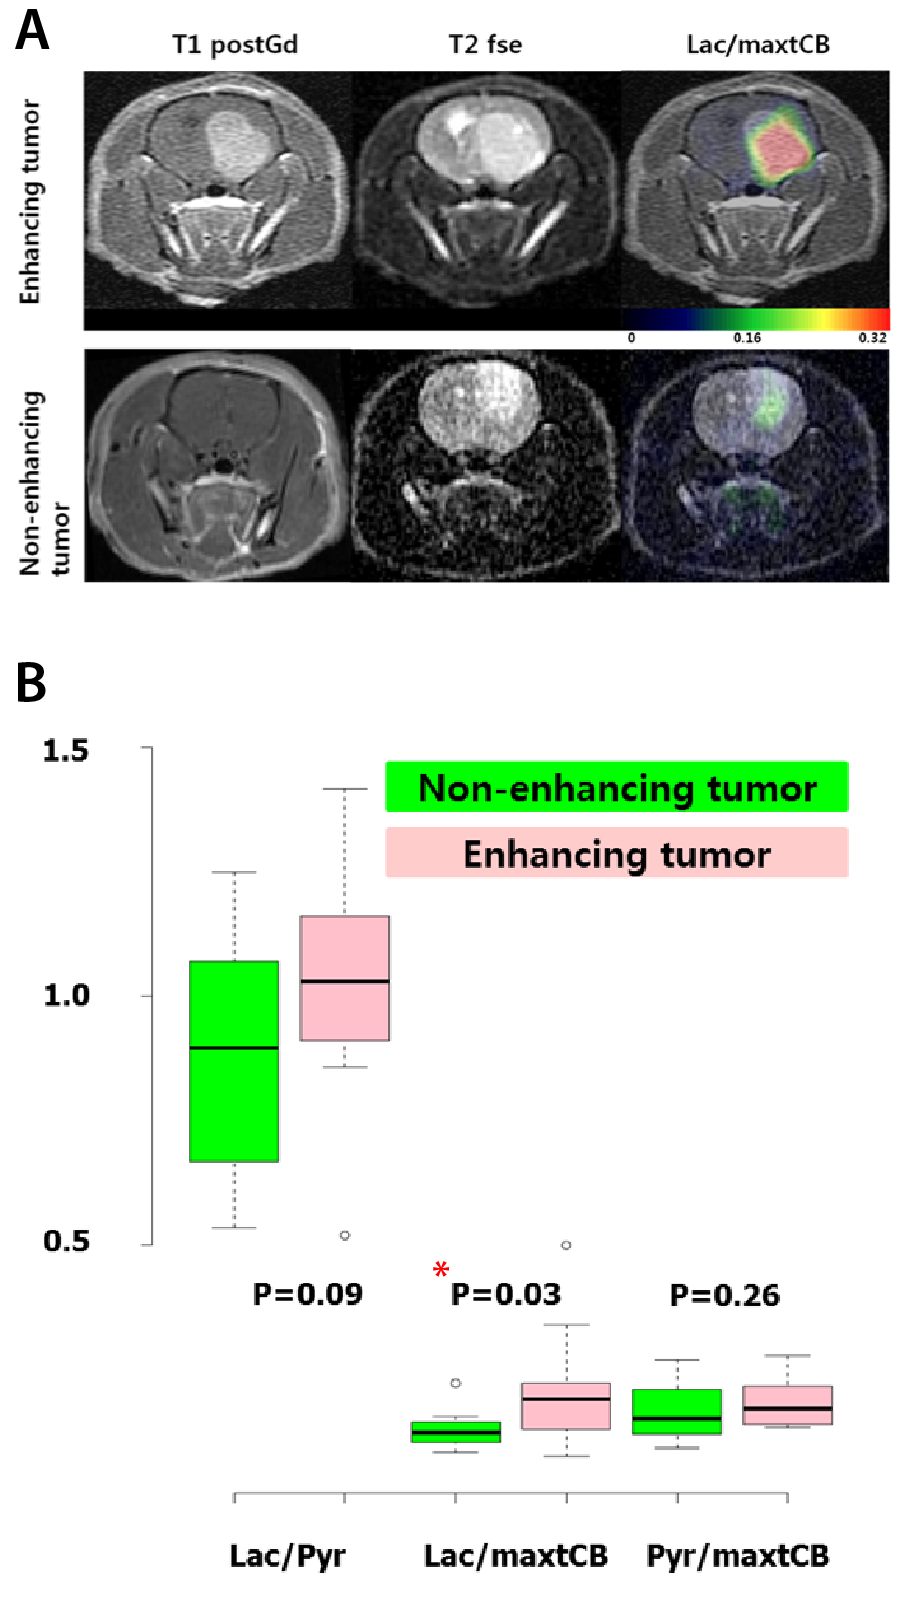
Enhancing tumors had significantly higher levels of lactate than non-enhancing tumors: Figure 2 shows the comparison of hyperpolarized 13C imaging parameters between the enhancing and non-enhancing tumors. The enhancing tumors exhibited enhancing lesion in its T1 post-gadolinium image, while the non-enhancing tumors did not show an enhancement (Fig. 2A). Both tumors displayed hyperintensity in their T2 FSE images. There is a significant difference in the level of lactate normalized by vascular tC signal (Lac/maxtCB) between the enhancing and non-enhancing brain tumors (p<0.05) (Fig 2B).
The levels of pyruvate were similar between three tissues: It is noteworthy that the levels of pyruvate normalized by vascular tC signal (Pyr/maxtCB) were similar between the contralateral normal brain, non-enhancing and enhancing tumors, while the lactate signal (Lac/maxtCB) showed distinct levels in these tissues. This implies that the levels of the delivery of pyruvate to these tissues were similar, but the amount of its conversion to lactate was distinctive in these three tissues.
Conclusion
This study demonstrated that tumor metabolism in brain tumor models can be examined using hyperpolarized 13C MRSI and suggested that this technique may be useful in distinguishing functional characteristics between normal brain tissue and heterogeneous anatomical lesions in brain tumor.Acknowledgements
The support for the research studies came from Kure It Grant for Underfunded Cancer Research, Discovery Grant from American Brain Tumor Association, and the National Research Foundation (NRF) of Korea grant funded by Ministry of Science and ICT (No.2017R1C1B5018396).References
1. Park I, Larson PE, Zierhut ML, Hu S, Bok R, Ozawa T, et al. Hyperpolarized 13C magnetic resonance metabolic imaging: application to brain tumors. Neuro-oncology. 2010;12(2):133-44.
2. Park JM, Spielman DM, Josan S, Jang T, Merchant M, Hurd RE, et al. Hyperpolarized (13)C-lactate to (13)C-bicarbonate ratio as a biomarker for monitoring the acute response of anti-vascular endothelial growth factor (anti-VEGF) treatment. NMR in biomedicine. 2016;29(5):650-9.
3. Park I, Larson P, Gordon J, Carvajal L, Chen H, VanCriekinge M, et al. Dynamic Hyperpolarized 13C Metabolic Imaging of Patients with Brain Tumors. Proceedings of ISMRM 25th meeting. P0555.
4. Park I, Hu S, Bok R, Ozawa T, Ito M, Mukherjee J, et al. Evaluation of heterogeneous metabolic profile in an orthotopic human glioblastoma xenograft model using compressed sensing hyperpolarized 3D 13C magnetic resonance spectroscopic imaging. Magnetic resonance in medicine. 2013;70(1):33-9.
Figures