3711
Hyperpolarized In vivo pH Imaging Reveals Grade-Dependent Interstitial Acidification1Radiology and Biomedical Imaging, UC San Francisco, San Francisco, CA, United States, 2Bioengineering, UC San Francisco, San Francisco, CA, United States
Synopsis
Changes in cellular metabolism, perfusion, and proton export that occur during indolent-to-aggressive transition in prostate cancer (PCa) likely lead to a lower extracellular pH (pHe) in vivo, promoting an aggressive, treatment-resistant phenotype. To measure this interstitial acidification, we implemented a hyperpolarized (HP) imaging protocol that measured lactate-to-pyruvate ratio, perfusion, and pHe in a murine model of prostate cancer, the TRAMP mouse. Our results indicated higher pyruvate-to-lactate conversion, lower perfusion, and lower pHe in high-grade tumors, suggesting a correlation between the three parameters and implicating low pHe in the development of aggressive PCa.
Introduction
Imaging biomarkers distinguishing indolent from aggressive prostate cancer (PCa) are lacking in the clinic. Previous hyperpolarized (HP) studies have identified changes in metabolic conversion of pyruvate to lactate1,2, perfusion2, and lactate export3 in tumor tissue as potential biomarkers for detecting this transition. These alterations in high-grade tumors are expected to lead to a decrease in extracellular pH (pHe), which is correlated with a more aggressive phenotype, compromised antitumor immunity, and reduced therapeutic response4,5. The goal of this study was to measure this interstitial acidification in a murine model of PCa and to compare between indolent and aggressive disease.Methods
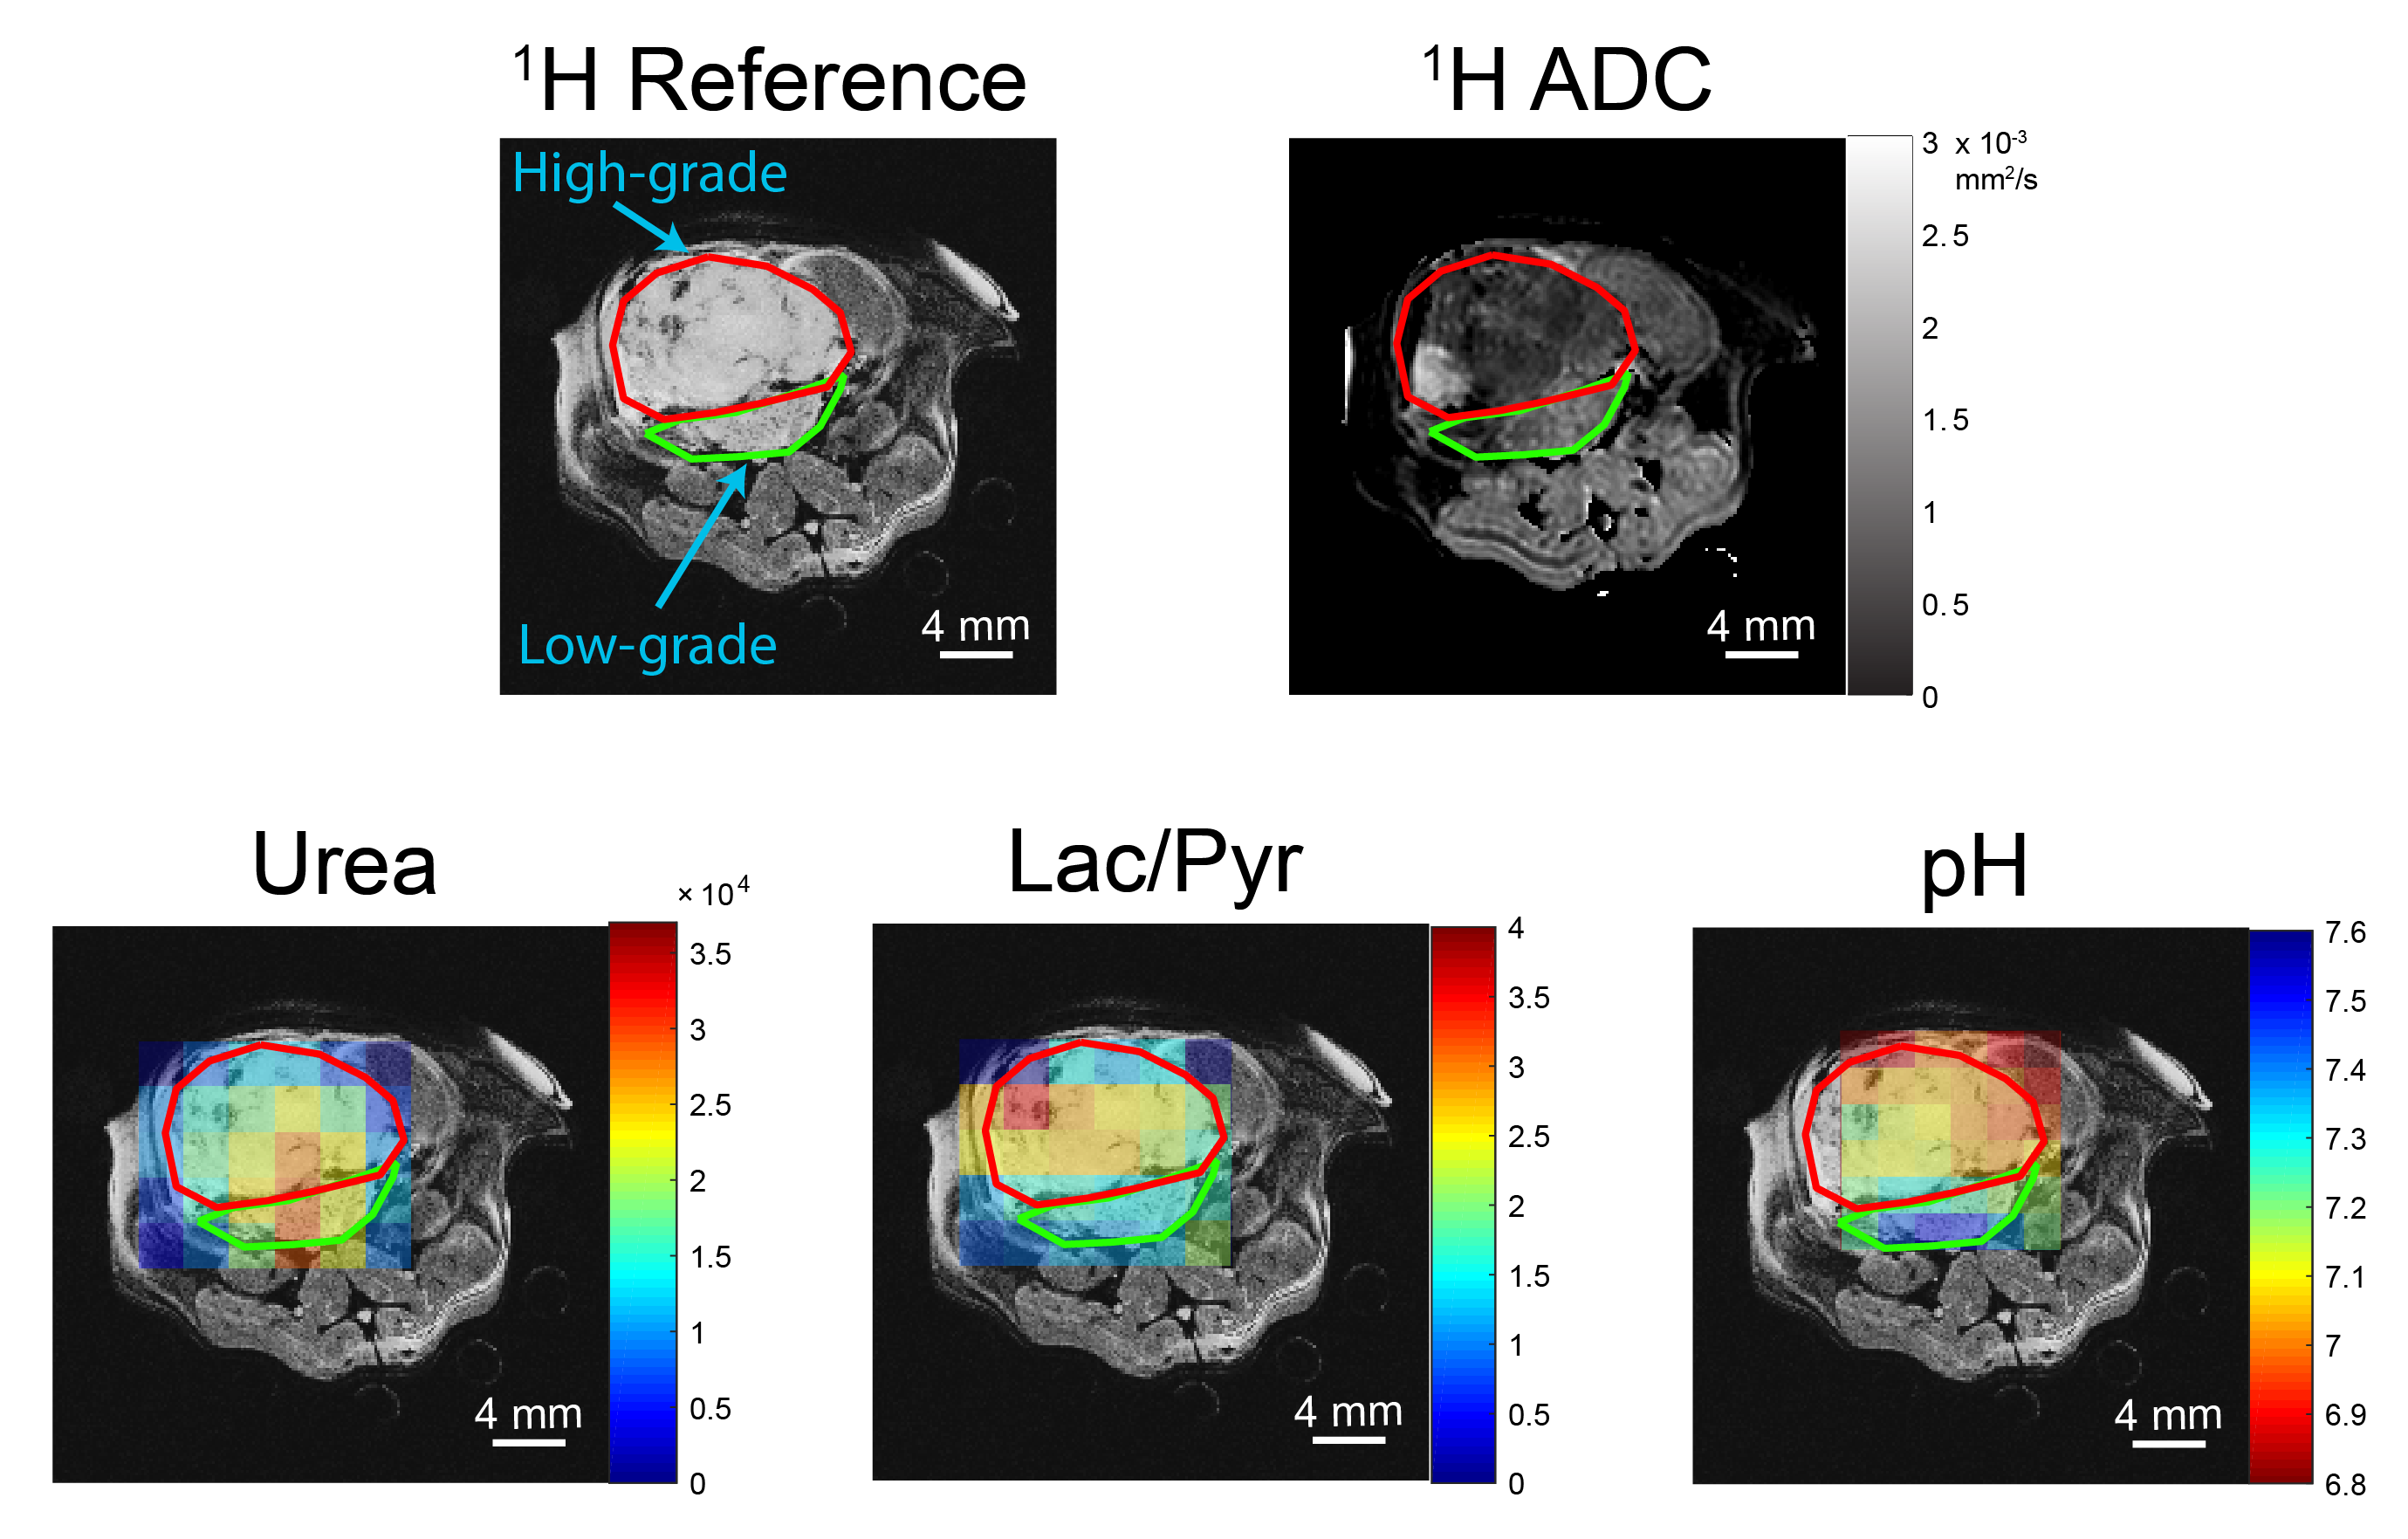
Mouse imaging protocol: Transgenic adenocarcinoma of the mouse prostate (TRAMP) mice were anesthetized, placed within a 14 T Varian imaging system, and subjected to 1H apparent diffusion coefficient (ADC) mapping followed by two HP injections with 13C imaging. The first injection was comprised of co-polarized [1-13C]pyruvate and [13C]urea, followed by HP [13C]bicarbonate formed from [1-13C]1,2-glycerol carbonate, as previously described6. The HP pyruvate/urea and bicarbonate were imaged using a 3D gradient-spin echo sequence7 and a 2D chemical shift imaging sequence, respectively. T2-weighted anatomical reference images for 13C co-registration were also acquired.
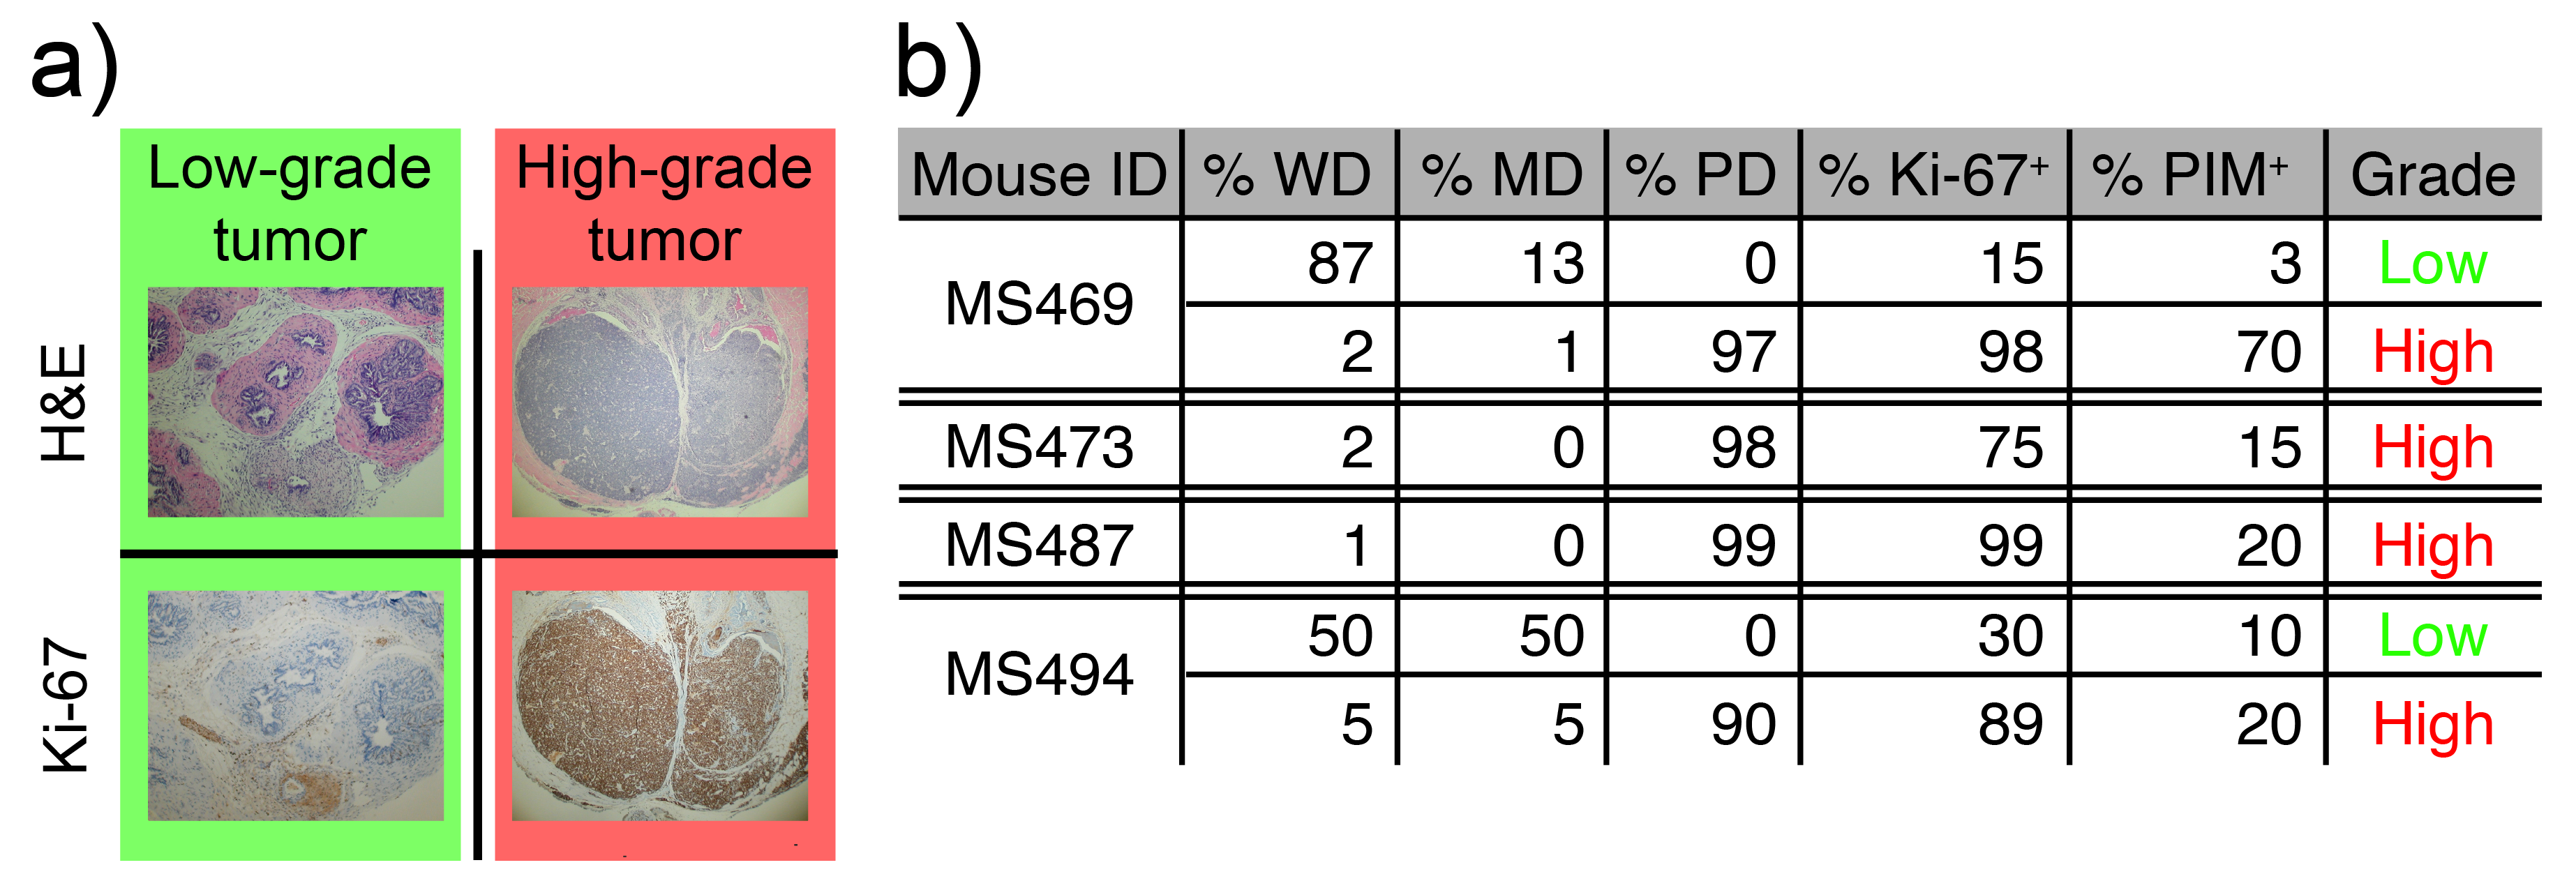
Tumor tissue staining: The mouse was euthanized and the tumor tissue extracted within 24 hours of imaging. Tumor tissue was fixed, sectioned, and used for histological staining (H&E, Ki-67 nuclear stain, PIM hypoxia stain). Stained tumor regions were classified by a trained pathologist as low- or high-grade based upon cell differentiation, glandular pattern and necrosis, as previously described1.
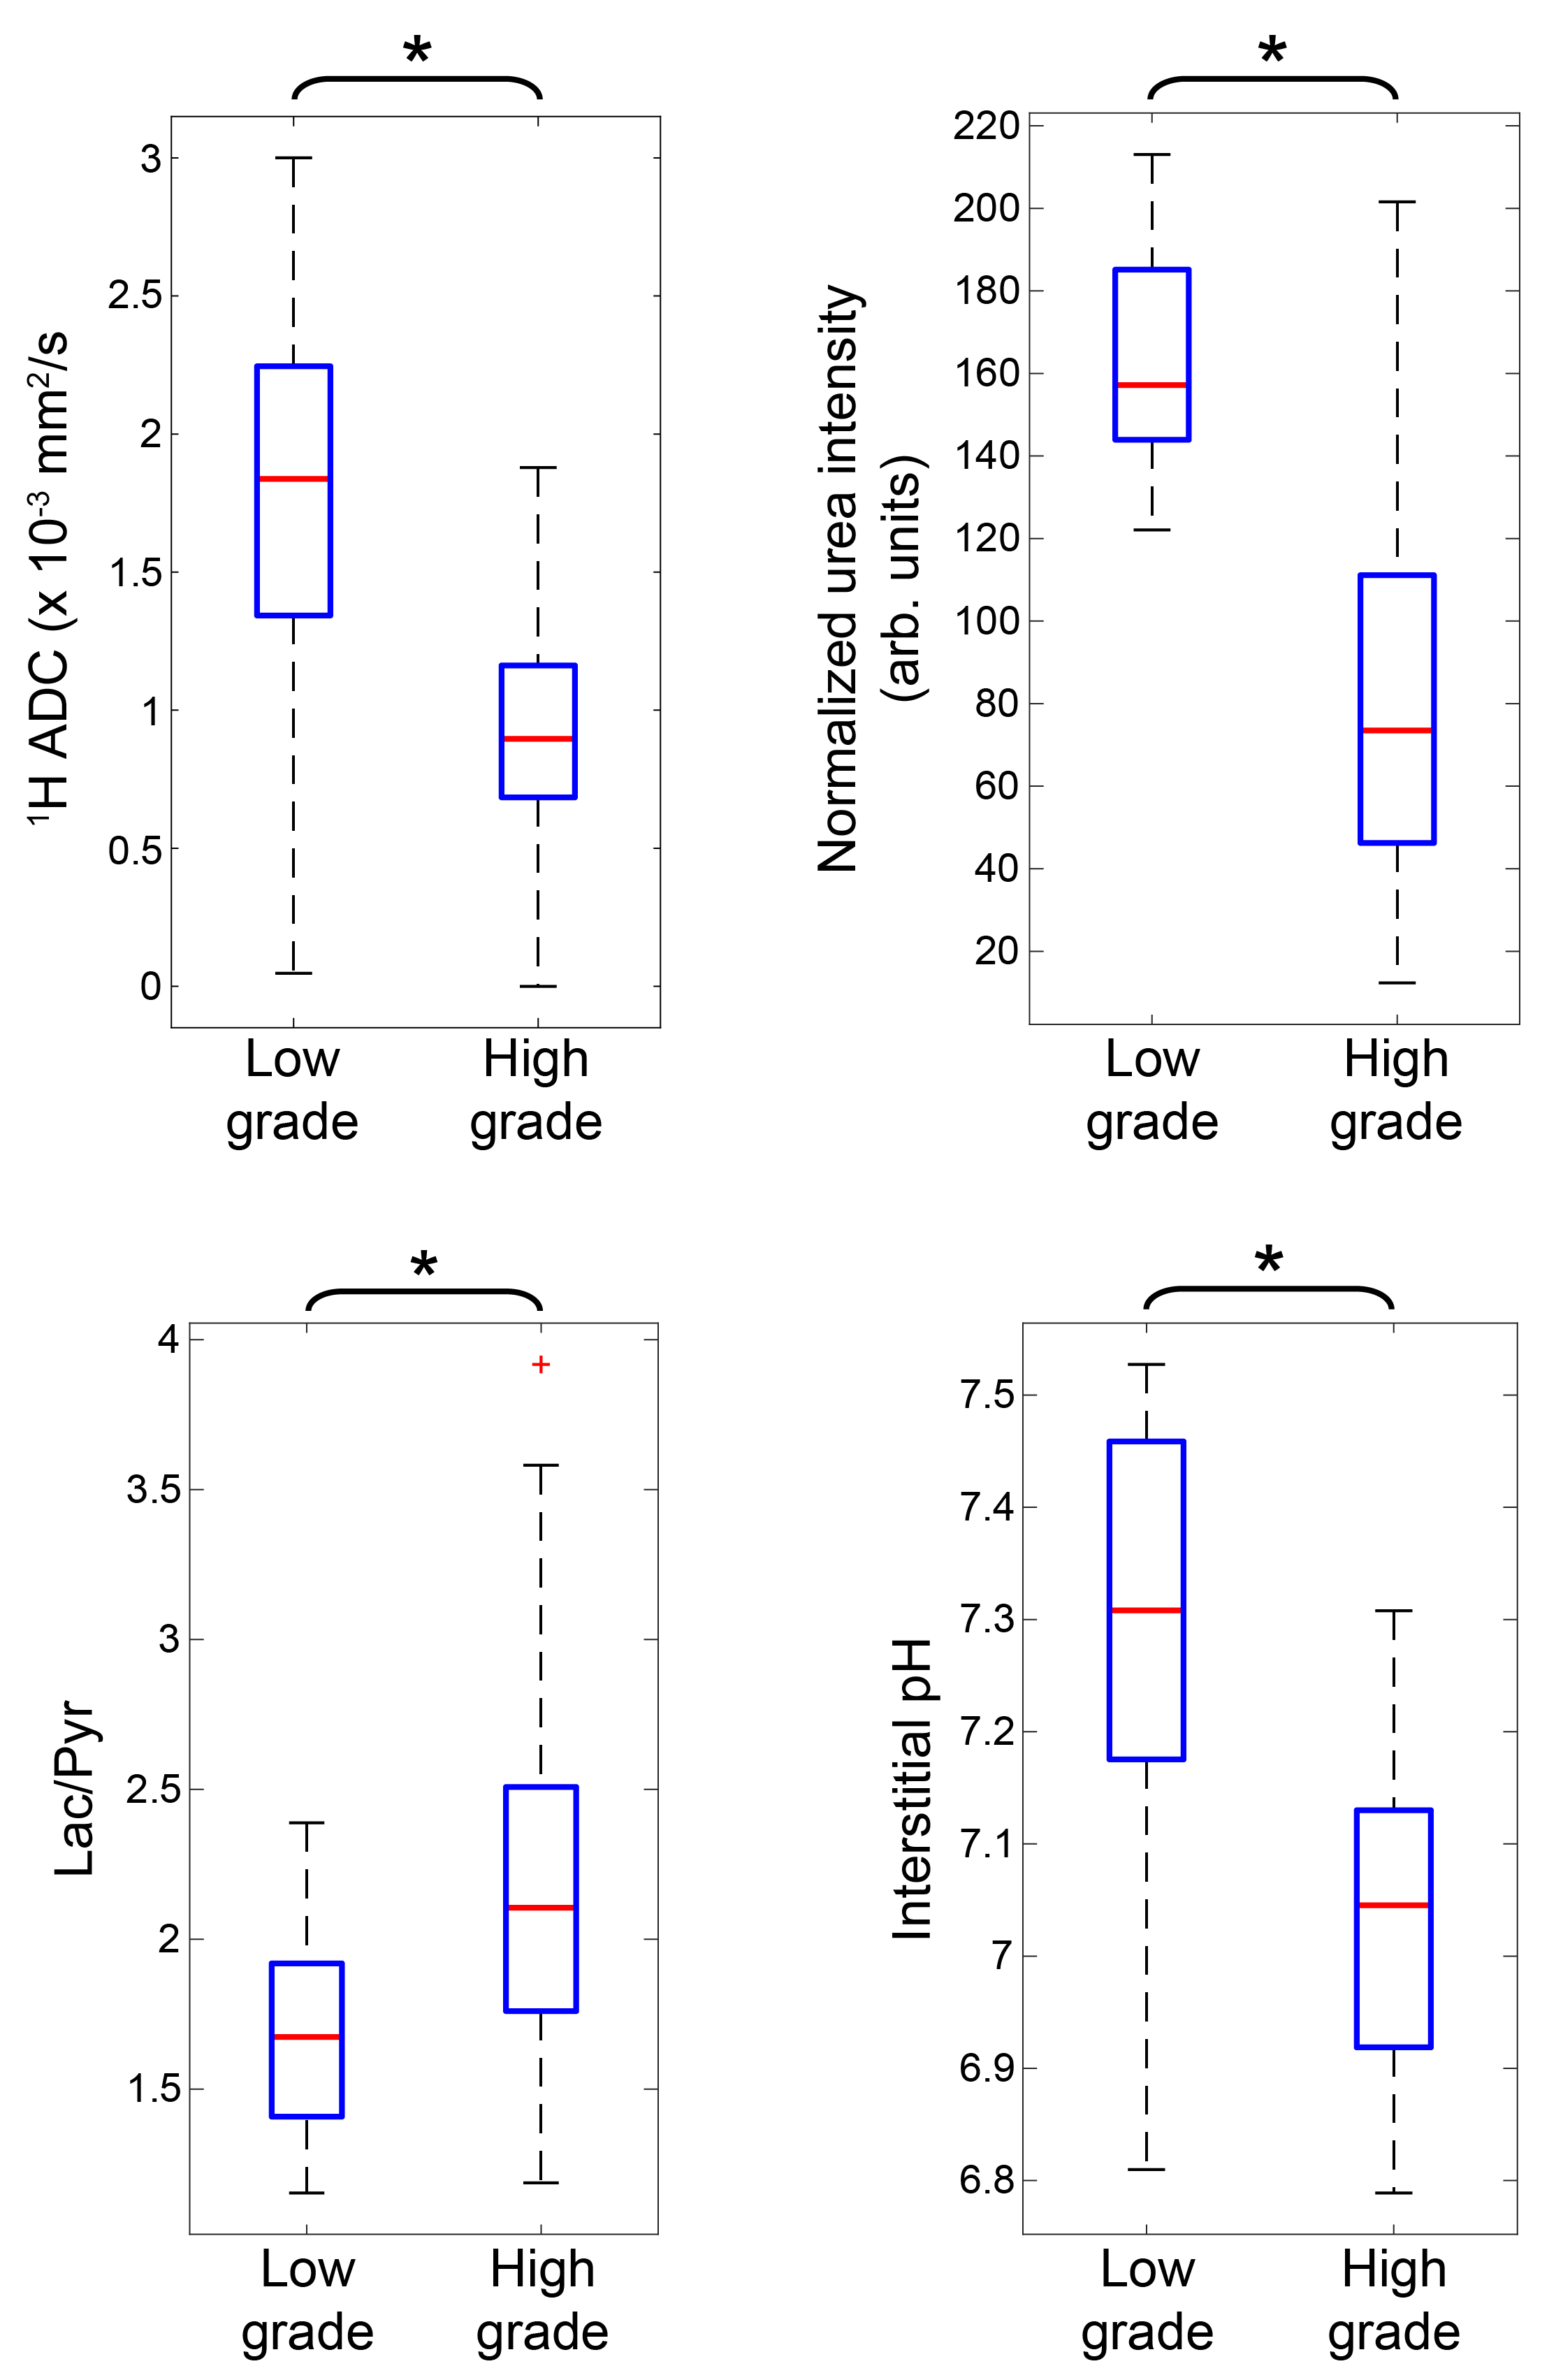
Image processing: All steps were performed using custom MATLAB scripts. Regions of interest (ROIs) were drawn on 1H T2-weighted images based upon histology. 13C slices were summed together and images zero-padded to match voxel sizes. For 1H ADC and 13C data, voxel values were classified as low-grade or high-grade based upon ROIs. 13C voxels with a signal-to-noise ratio < 3 or 1H ADC values > 3 x 10⁻³ mm2/s were excluded from analysis8. The low-grade and high-grade voxel values were pooled together from all mice, and two-tailed t-tests with unequal variances were performed between the two groups for 1H ADC, normalized [13C]urea intensity, lactate-to-pyruvate ratio (Lac/Pyr), and pHe.
Results and Discussion
Of the four TRAMP mice studied, all had regions of high-grade tumor tissue, as indicated by histological staining and evaluation (Figure 1), and two mice had distinct regions of low-grade tumor/hyperplasia. Representative HP 13C overlays for the TRAMP mice studied, along with the ROIs drawn, are displayed in Figure 2. When imaging voxel values were pooled into low- or high-grade datasets based upon ROIs, statistically significant differences in 1H ADC, normalized urea intensity, pHe, and Lac/Pyr were observed (Figure 3). The high-grade voxel mean was 0.26 pH unit lower than that of the low-grade voxels, whereas the mean Lac/Pyr was 31% higher for high-grade than for low-grade voxels. The lower 1H ADC, higher Lac/Pyr, and lower urea signal observed in high-grade tumor regions in this study recapitulate previous findings reported in the literature1,2,9. Previous studies indicate that monocarboxylate transporter 4 (MCT4) is significantly upregulated in high-grade prostate cancer3. This may be a significant mechanism of interstitial acidification, since MCT4 is a lactate-H+ symporter5. Future work will investigate the role of lactate-H+ co-export via MCT4 in the observed grade-dependent interstitial acidification as well as whether pHe mapping can inform therapeutic intervention, particularly immunotherapy, which may vary in efficacy depending on the tumor pH10.Conclusions
We report the results of simultaneous in vivo imaging of pyruvate-to-lactate conversion, perfusion, and extracellular pH in a murine model of prostate cancer. We observed a decrease in pHe and perfusion along with an increase in measures of glycolytic activity. These results establish interstitial acidification as a biomarker of PCa indolent-to-aggressive transition. Future studies will focus on isolating the predominant mechanisms of proton efflux employed by aggressive PCa cells and investigating the role of pH in predicting therapeutic efficacy.Acknowledgements
The authors wish to thank all members of the Flavell and Kurhanewicz Labs.
Grants: R01-CA166655; R01-CA166766; P41-EB013598; PC140571P4; PC150932; Prostate Cancer Foundation Young Investigator Award.
References
1. Albers, M. J. et al. Hyperpolarized 13C Lactate, Pyruvate, and Alanine: Noninvasive Biomarkers for Prostate Cancer Detection and Grading. Cancer Res 68, 8607–8615 (2008).
2. Chen, H.-Y. et al. Assessing Prostate Cancer Aggressiveness with Hyperpolarized Dual-Agent 3D Dynamic Imaging of Metabolism and Perfusion. Cancer Res 77, 3207–3216 (2017).
3. Keshari, K. R. et al. Metabolic Reprogramming and Validation of Hyperpolarized 13C Lactate as a Prostate Cancer Biomarker Using a Human Prostate Tissue Slice Culture Bioreactor. Prostate 73, 1171–1181 (2013).
4. Gatenby, R. A. & Gillies, R. J. Why do cancers have high aerobic glycolysis? Nat Rev Cancer 4, 891–899 (2004).
5. Corbet, C. & Feron, O. Tumour acidosis: from the passenger to the driver's seat. Nat Rev Cancer 17, 577–593 (2017).
6. Korenchan, D. E. et al. Dynamic nuclear polarization of biocompatible 13C-enriched carbonates for in vivo pH imaging. Chem Commun 52, 3030–3033 (2016).
7. Oshio, K. & Feinberg, D. A. Single-shot GRASE imaging without fast gradients. Magn Reson Med 26, 355–360 (1992).
8. Holz, M., Heil, S. R. & Sacco, A. Temperature-dependent self-diffusion coefficients of water and six selected molecular liquids for calibration in accurate 1H NMR PFG measurements. Phys Chem Chem Phys 2, 4740–4742 (2000).
9. Nagarajan, R. et al. Correlation of Gleason Scores with Diffusion-Weighted Imaging Findings of Prostate Cancer. Adv Urol 2012, 1–5 (2012).
10. Pilon-Thomas, S. et al. Neutralization of Tumor Acidity Improves Antitumor Responses to Immunotherapy. Cancer Res 76, 1381–1390 (2016).
Figures