3709
Imaging metabolic development of patient-derived glioblastoma xenografts in vivo employing hyperpolarized magnetic resonance1MD Anderson Cancer Center UTHealth Graduate School of Biomedical Sciences, Houston, TX, United States, 2Cancer Systems Imaging, University of Texas M.D. Anderson Cancer Center, Houston, TX, United States, 3Neurosurgery, University of Texas M.D. Anderson Cancer Center, Houston, TX, United States, 4Diagnostic Radiology, University of Texas M.D. Anderson Cancer Center, Houston, TX, United States
Synopsis
Hyperpolarized MRI was employed to non-invasively assess aerobic glycolysis in a well-characterized, patient-derived, orthotopic glioblastoma mouse model which recapitulates the complexity of tumor microenvironment. Aberrant energy metabolism is a hallmark of cancer, and in order to understand this metabolic rewiring during the course of tumor development, in vivo hyperpolarized pyruvate metabolic imaging and NMR spectroscopy of ex vivo tumor tissue were performed at three separate time points. A positive correlation of dynamic lactate production with tumor progression was observed. Additionally, NMR metabolomics revealed several key metabolites that are positively or negatively correlated with tumor growth.
Introduction
Glioblastomas originate from a variety of cells such as astrocytes and neuronal stem cells which, along with their advanced stage, makes these tumors diverse in mutations1. Thus, targeted therapies can rarely block all mechanisms of proliferation and survival, leading to median survival times of merely 15 months2. This research attempts to characterize the evolution of tumor metabolism that either leads to or results from these somatic mutations. Novel molecular imaging techniques have the potential to depict the extent of tumorigenesis prior to notable changes in anatomy or physiology and allow for a more detailed and comprehensive classification of tumors in vivo. This could be a key to improving initial prognosis and treatment of GBM tumors.
Hyperpolarized MRI is one such imaging technique which non-invasively measures dynamic metabolic processes3. The nuclei of a metabolic substrate are polarized to produce MRI signal exceeding 10,000 times its equilibrium value, allowing it to be visible on clinical scanners4,5. Upon intravenous injection, the accumulation of the metabolite and its biological conversion to downstream products in tumors can be monitored with MR spectroscopy. Because these substrates are found endogenously, the injections are nontoxic, and many clinical trials have been initiated to develop biomarkers in several types of cancer6.
This work used the metabolic substrate [1-13C] pyruvate as a method to assess the level of aerobic glycolysis in cells. Increased intracellular glycolysis, despite the presence of oxygen, is associated with the transformation into malignant cells as observed in the Warburg effect7,8. This study aims to understand this metabolic transition during the course of tumor development.
Methods
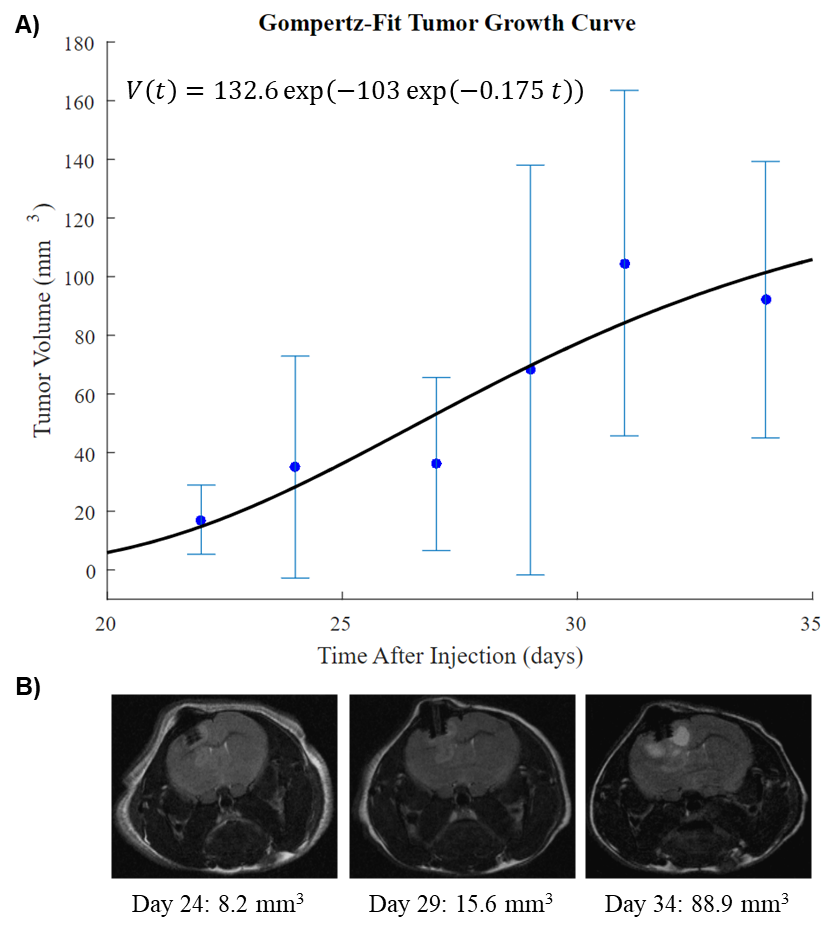
Glioblastoma sphere-forming cells (GSC) were cultured from patient biopsies and injected intracranially above the caudate nucleus of the brains of nude mice in accordance with the institutional Animal Care and Use Committee regulations9. The anatomic development of these GSC-derived tumors was followed with periodic MRI using T1-weighted, T2-weighted, and fluid-attenuated pulse sequences (Fig. 1).
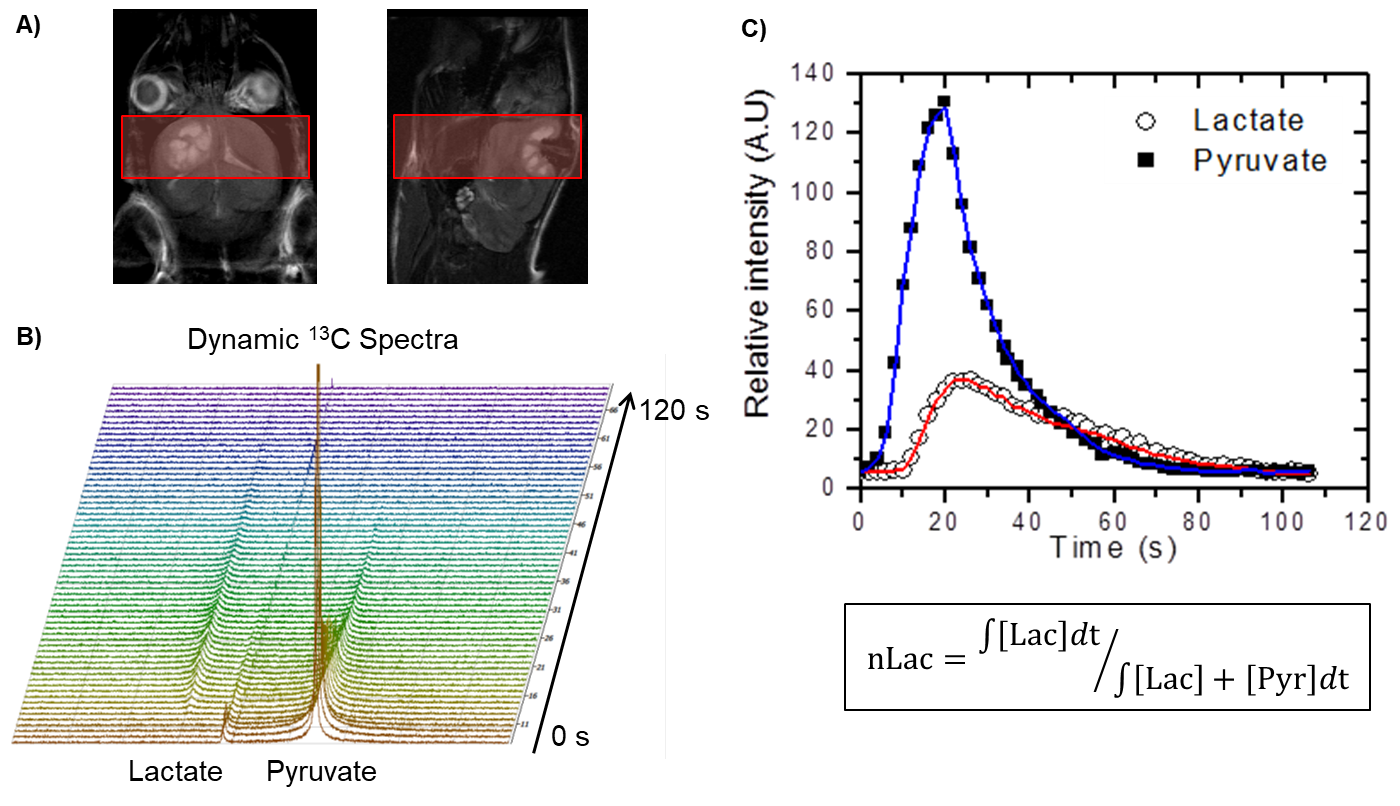
At the 60%, 80%, and 100% of median survival time points, dynamic metabolic MRI experiments were performed in vivo (Fig. 3). Hyperpolarized [1-13C] pyruvate was injected through the tail vein, and its metabolic conversion into lactate was measured in the tumor using slice-selective pulse-acquired spectroscopy every two seconds for two minutes. This conversion was quantified with the metric nLac which is the time-integrated ratio of hyperpolarized lactate-to-pyruvate+lactate signal.
Following the hyperpolarization
experiments, the mice were euthanized and their tumors excised for ex vivo NMR spectroscopy experiments measuring
steady-state metabolite concentrations at the same time points. Two-way Student’s
T-tests and one-way ANOVA with multiple-comparison corrections were performed
to identify significant differences of nLac and ex vivo metabolite
concentrations between time points.
Results
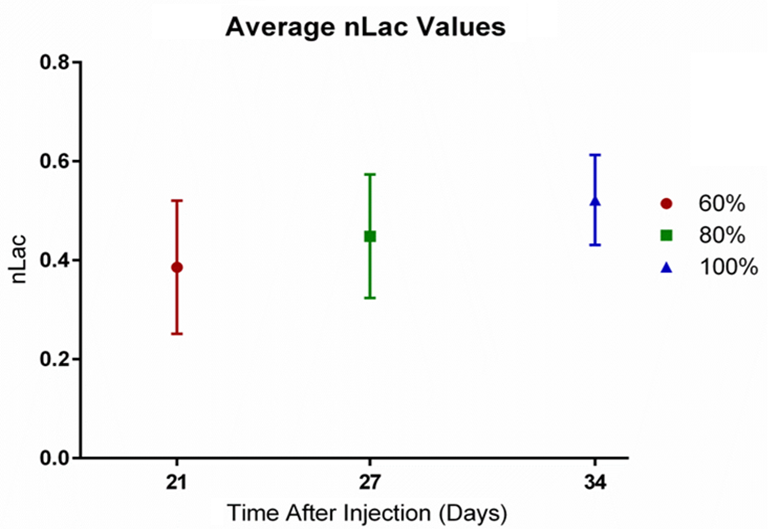
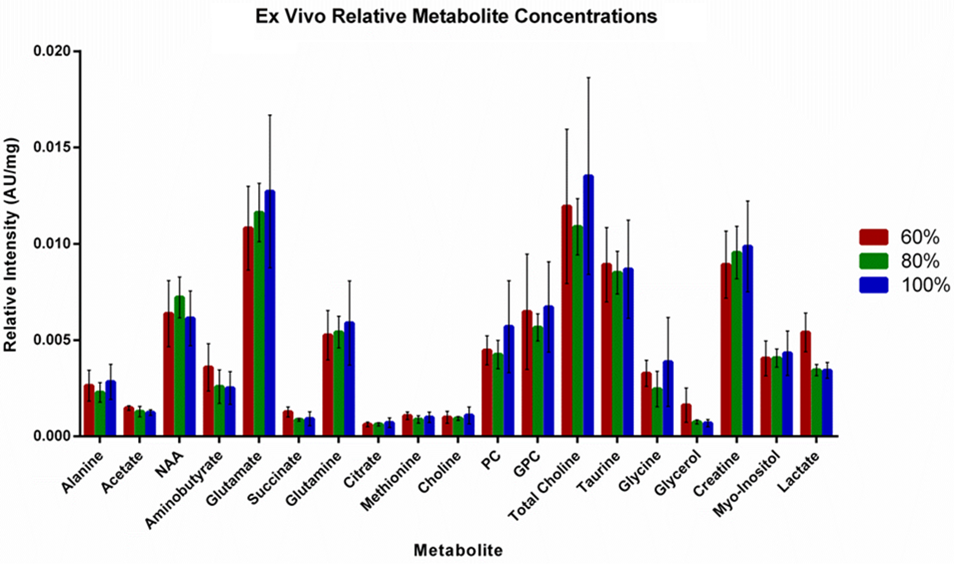
Approximately 5 mice at each time point underwent in vivo hyperpolarization experiments. The metric nLac was found to continually increase with tumor progression (Fig. 4). The tumors from these mice were then excised for ex vivo NMR experiments. From these acquired spectra, 28 metabolites were identified and their concentrations quantified between time points (Fig. 5). Several metabolites either positively or negatively correlated with tumor development such as acetate, glutamate, glutamine, glycerol, creatine, myo-inositol, and lactate. Statistically, lactate, tyrosine, and uridine were significantly different between 60% of median survival and the later time points (p < 0.05).Discussion
Convential MRI was used to periodically measure tumor volume which was fit to the Gompertz function to model tumor growth. At the 60%, 80%, and 100% of median survival time points, both in vivo dynamic metabolism and ex vivo steady-state metabolism were examined. From in vivo hyperpolarized [1-13C] pyruvate experiments, increased conversion of pyruvate to lactate was observed. This is associated with elevated levels of aerobic glycolysis described in the Warburg effect. In the ex vivo NMR experiments, the concentrations of several metabolites either positively or negatively correlated with tumor development. With further pathway analysis, and potentially enzyme kinetic data, specific metabolic pathways can be interrogated.Conclusion
This work demonstrates the utility of hyperpolarized MRI to track the metabolic development of tumors from tumorigenesis to full maturation, non-invasively. Additionally, longitudinal measurements of global metabolism with NMR spectroscopy monitor the metabolic transformations that occur during tumor growth. With continued research in this area, we believe metabolic imaging such as hyperpolarized MRI can be employed in the early detection of lesions, serve as a prognostic predictor of survival, and assess the efficacy of treatment.Acknowledgements
MD Anderson Brain Cancer SPORE
MD Anderson CPRIT Graduate Scholar Program
References
1. Zong H, Verhaak RG, Canoll P. The cellular origin for malignant glioma and prospects for clinical advancements. Expert Review of Molecular Diagnostics. 2012;12(4):383-394.
2. Henriksson R, Asklund T, Poulsen HS. Impact of therapy on quality of life, neurocognitive function and their correlates in glioblastoma multiforme: a review. J Neurooncol. 2011;104(3):639-646.
3. Brindle K. Watching tumours gasp and die with MRI: the promise of hyperpolarised 13 C MR spectroscopic imaging. Br J Radiol. 2012;85(1014):697-708.
4. Ardenkjaer-Larsen JH, Fridlund B, Gram A, et al. Increase in signal-to-noise ratio of > 10,000 times in liquid-state NMR. Proc Natl Acad Sci. 2003;100(18):10158-10163.
5. Hurd RE, Yen Y-F, Chen A, Ardenkjaer-Larsen JH. Hyperpolarized 13 C metabolic imaging using dissolution dynamic nuclear polarization. J Magn Reson Imaging. 2012;36(6):1314-1328.
6. Nelson SJ, Kurhanewicz J, Vigneron DB, et al. Metabolic Imaging of Patients with Prostate Cancer Using Hyperpolarized [1- 13 C]Pyruvate. Sci Transl Med. 2013;5(198):198ra108.
7. Warburg O. On respiratory impairment in cancer cells. Science. 1956;124(3215):269-270.
8. Vander Heiden MG, Cantley LC, Thompson CB. Understanding the Warburg Effect: The Metabolic Requirements of Cell Proliferation. Science. 2009;324(5930):1029-1033.
9. Lal S, Lacroix M, Tofilon P, Fuller GN, Sawaya R, Lang FF. An implantable guide-screw system for brain tumor studies in small animals. J Neurosurg. 2000;92(2):326-333.
Figures