3704
Establishing a Dose-Response Relationship for Lithium-Induced Modulation of [1-13C]Pyruvate Metabolism in the Heart1Institute for Biomedical Engineering, ETH and University Zurich, Zürich, Switzerland
Synopsis
Lithium is the first-line drug used in bipolar disorder, a chronic widespread psychiatric disease. Lithium is a narrow therapeutic index drug and shows cardiac side effects. The present work demonstrates the detectability of lithium induced changes of mitochondrial metabolism in cardiomyocytes using hyperpolarized [1-13C]pyruvate magnetic resonance imaging of the in-vivo rat heart. Metabolic and functional response to lithium was examined for different lithium plasma concentrations.
Introduction
Personalized medicine aims to individualize drug treatment in order to reach a systemic level associated with the desired therapeutic outcome, and at the same time reduce the risk of concentration dependent adverse events. Therefore, it is of great interest to establish dose-response relationships for narrow therapeutic index drugs.
Bipolar disorder (BD) is a psychiatric disease with a global prevalence of up to 4.8%. It results in more disability-adjusted life-years lost than major neurological conditions or cancer.2 Lithium (Li+) is a standard treatment for BD.1 One mechanism of action of Li+ is an increase in mitochondrial aerobic energy production.3 However, this effect is not tissue specific. In the heart, metabolic deterioration and accompanying processes eventually lead to myocarditis, cardiomyopathy, endothelial cell death, and consequently cardiovascular dysfunction.4 Thus it is of importance to provide patients with the right dose of Li+, facilitating mitochondrial metabolism in the brain, but sparing cardiomyocytes from damage. The objective of the present study is to relate the Li+ plasma concentrations to a metabolic response assessed by [1-13C]pyruvate magnetic resonance.
Methods
Hyperpolarization
Samples consisting of 50.8µL [1-13C]pyruvic acid and 13.5mM trityl, doped with 1mM Dotarem (Guerbet, Paris, France) yielding an 80mM [1-13C]pyruvate solution were polarized on a home-built multisample dissolution dynamic nuclear polarization (DNP) system.5
Animal Preparation
All animal experiments were performed with adherence to the Swiss Animal Protection law and were approved by the regional veterinary office. Five female Spargue-Dawley rats weighing 305-353g were anesthetized with 4% isoflurane in a mixture of air and oxygen (4:1). Rats were intubated and ventilated during the experiment. For anesthesia 1-2% isoflurane was maintained. Body temperature was kept at 37-38°C using a warm water heating system. Two 26-gauge intravenous cannulas were placed in opposite sides of the tail, one to allow injection of the dynamic nuclear polarization substrate, as well as interventional injections and one for continuous glucose infusion (15mg/kg/min)6.
Study Protocol
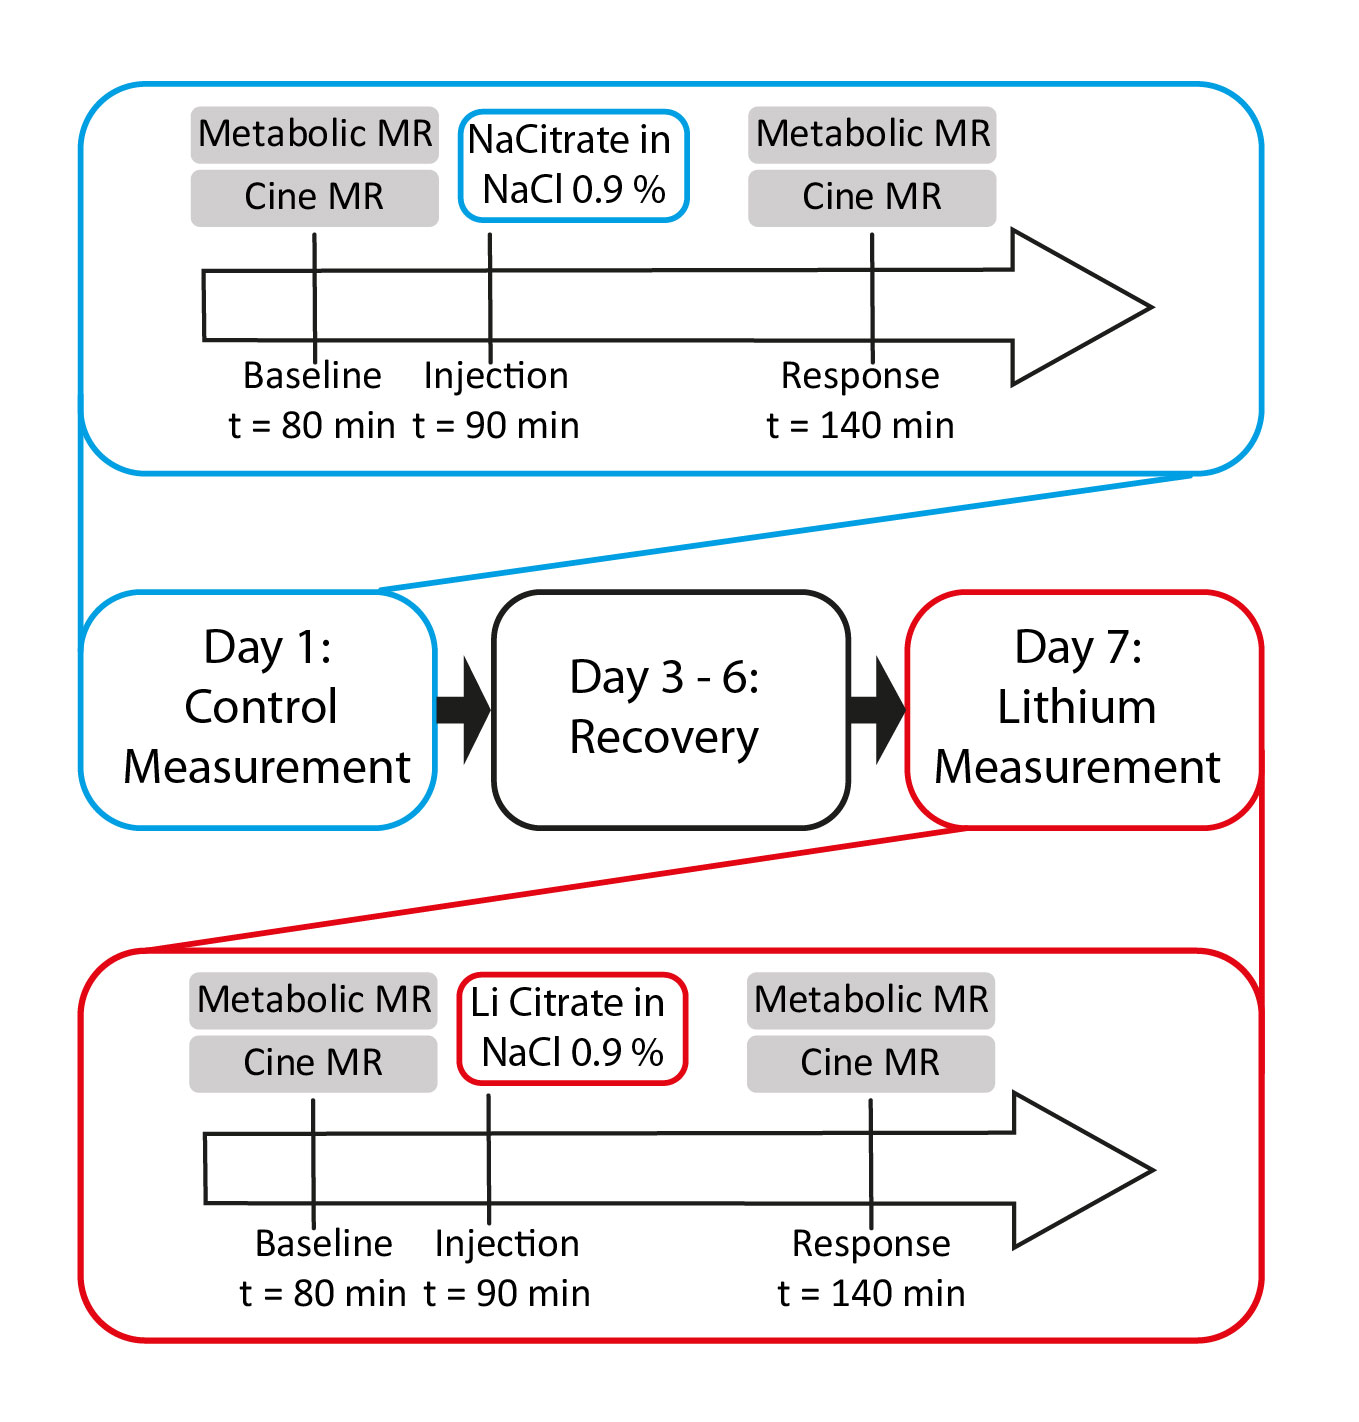
Each animal was scanned on two days (Figure 1) with a recovery period of at least three days in-between. On each day, after a baseline measurement (metabolic and functional MR) subjects were injected with either a control solution (sodium citrate, day 1) or treatment solution (lithium citrate, day 2). After one hour cardiac function and metabolism were assessed again. Interventional injections were matched for citrate concentration and osmolarity by adding sodium chloride.
Magnetic Resonance Imaging
Imaging was performed on a 9.4-T MR imaging system (Biospec 94/30, Bruker Biospin, Ettlingen, Germany). A birdcage 1H/13C coil was used for excitation and a rectangular 13C coil on the thorax for reception (both Rapid Biomedical, Wuerzburg, Germany). The hyperpolarized solution was transported to the scanner rapidly and injected into the subject with a custom-built pump (1ml, 0.17ml/s). Metabolic data were acquired using a multiband radiofrequency pulse with a multiecho single-shot echo-planar readout.7 FOV: 60x40mm2, spatial resolution:1.25x1.25x4mm3, TR=1.5s . Imaging was triggered to end systole, seven readouts were acquired during 2min.
Data Analysis
Metabolic images were reconstructed using the IDEAL approach8 encoding pyruvate, lactate, bicarbonate, pyruvate hydrate, and alanine resonances. Lactate, bicarbonate, and lactate-to-bicarbonate ratio were quantified based on the area under the curve (AUC) of the signal intensity–time curves. AUCs were normalized by the total myocardial carbon (TmC) signal acquired in each scan corresponding to the sum of the lactate, bicarbonate and alanine resonances. Left ventricle end systolic/diastolic volume (EDV, ESV), stroke volume (SV), ejection fraction (EF) and cardiac output were determined on short-axis cine images.
Blood Plasma Concentration
After the second measurement on day 2, a blood sample was drawn by cardiac puncture under pentobarbital anesthesia. The sample was mixed with cold heparin and centrifuged (13G, 15min) obtaining plasma. Li+ levels in plasma were assessed using inductively coupled plasma mass spectrometry.
Results
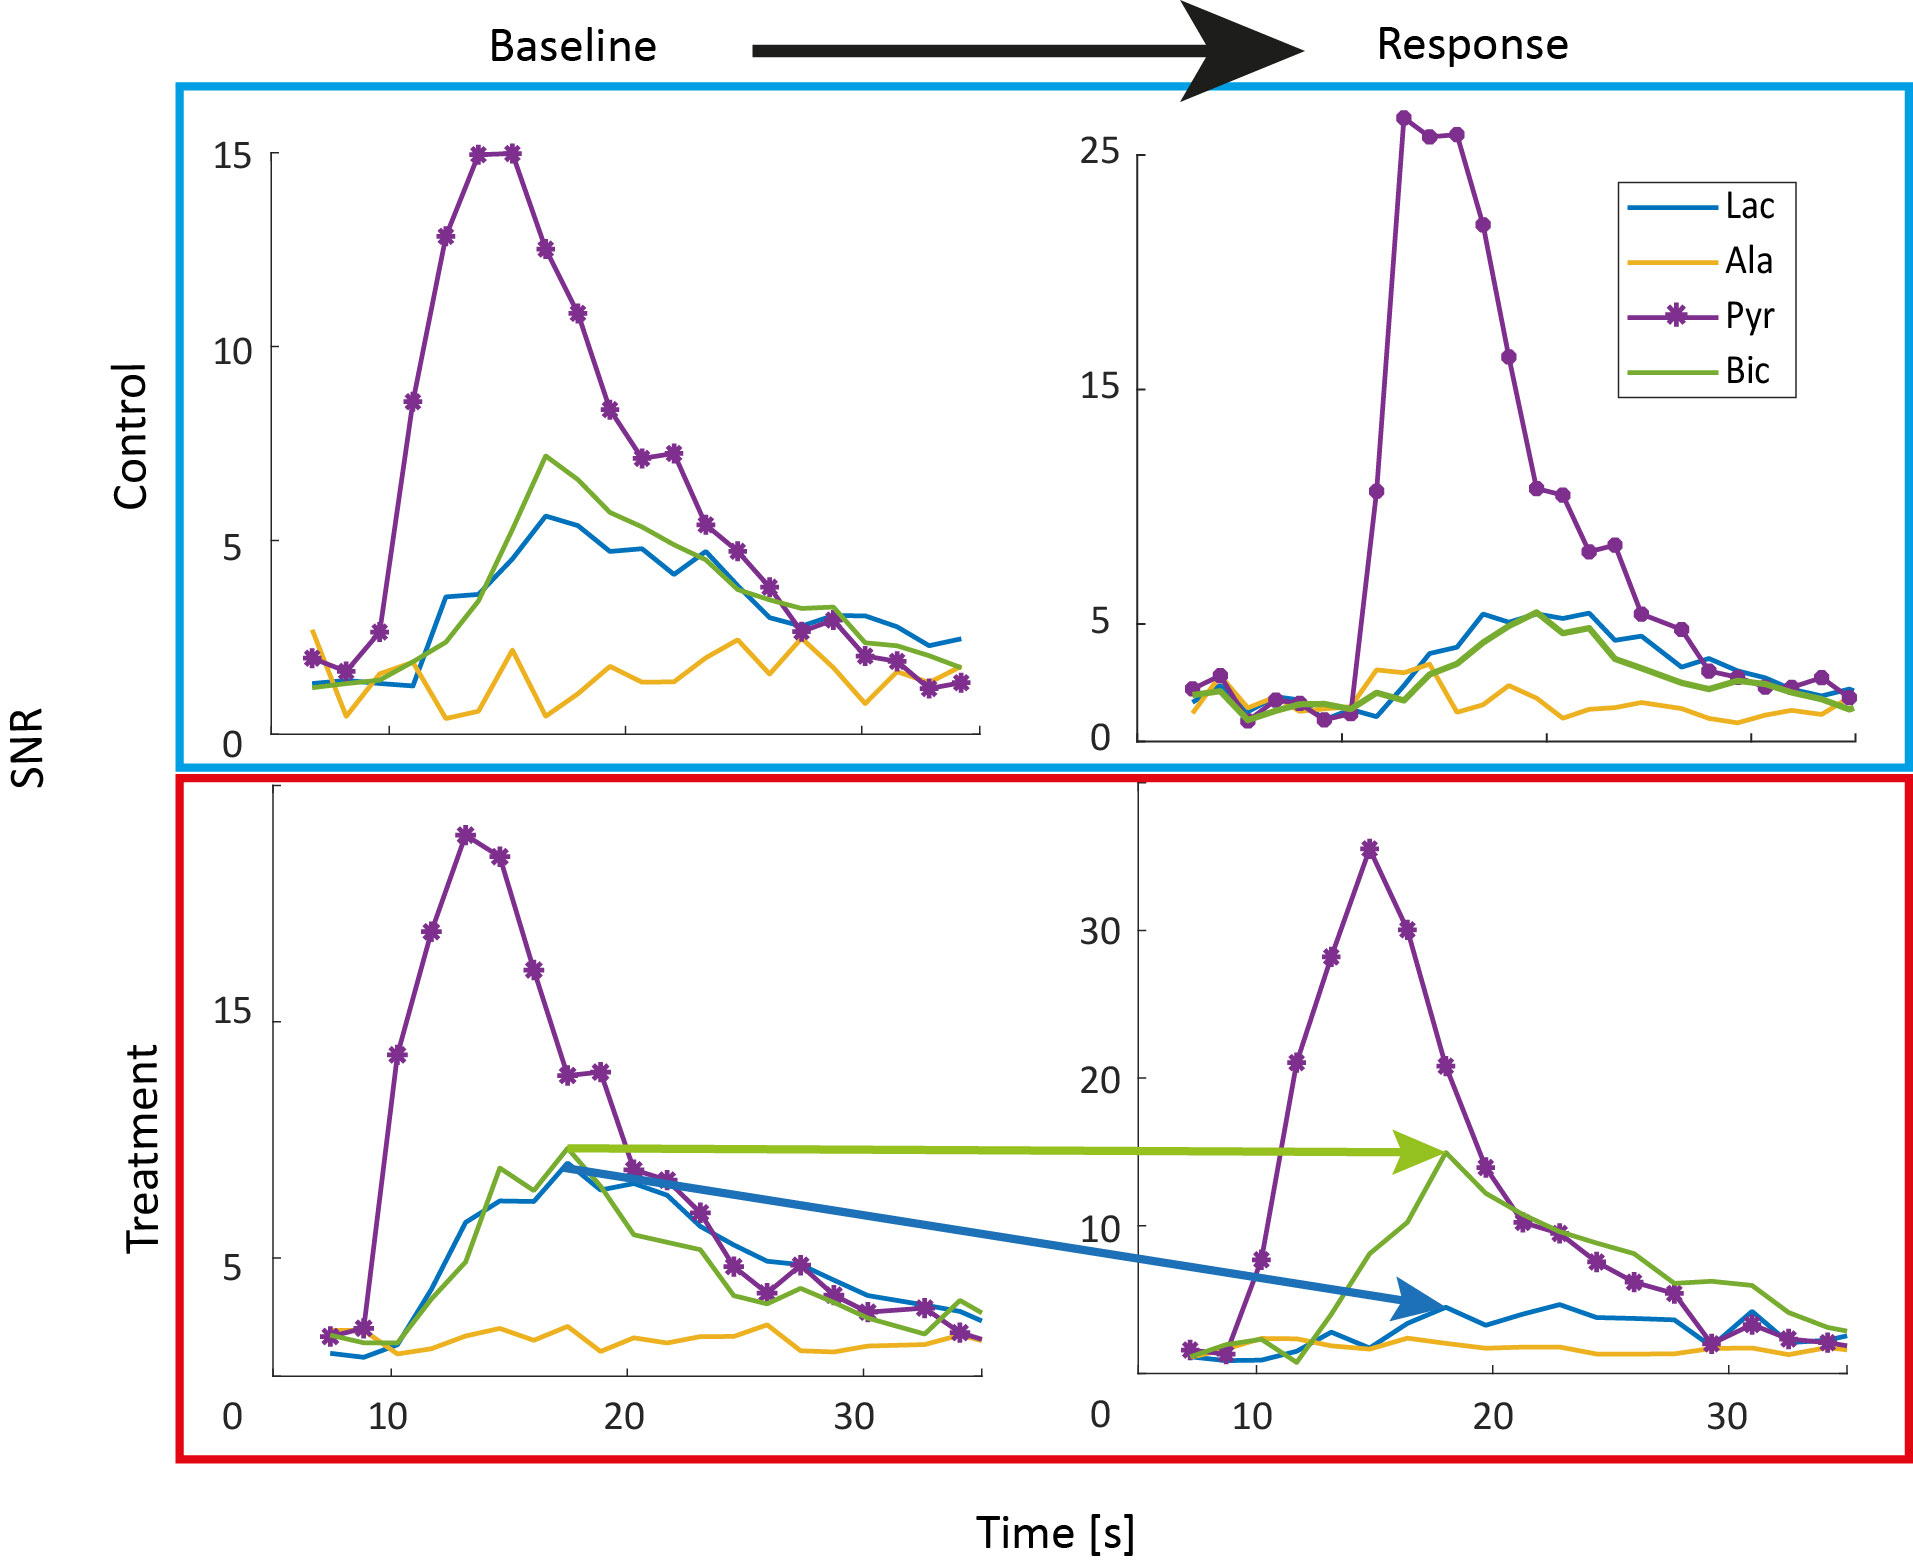
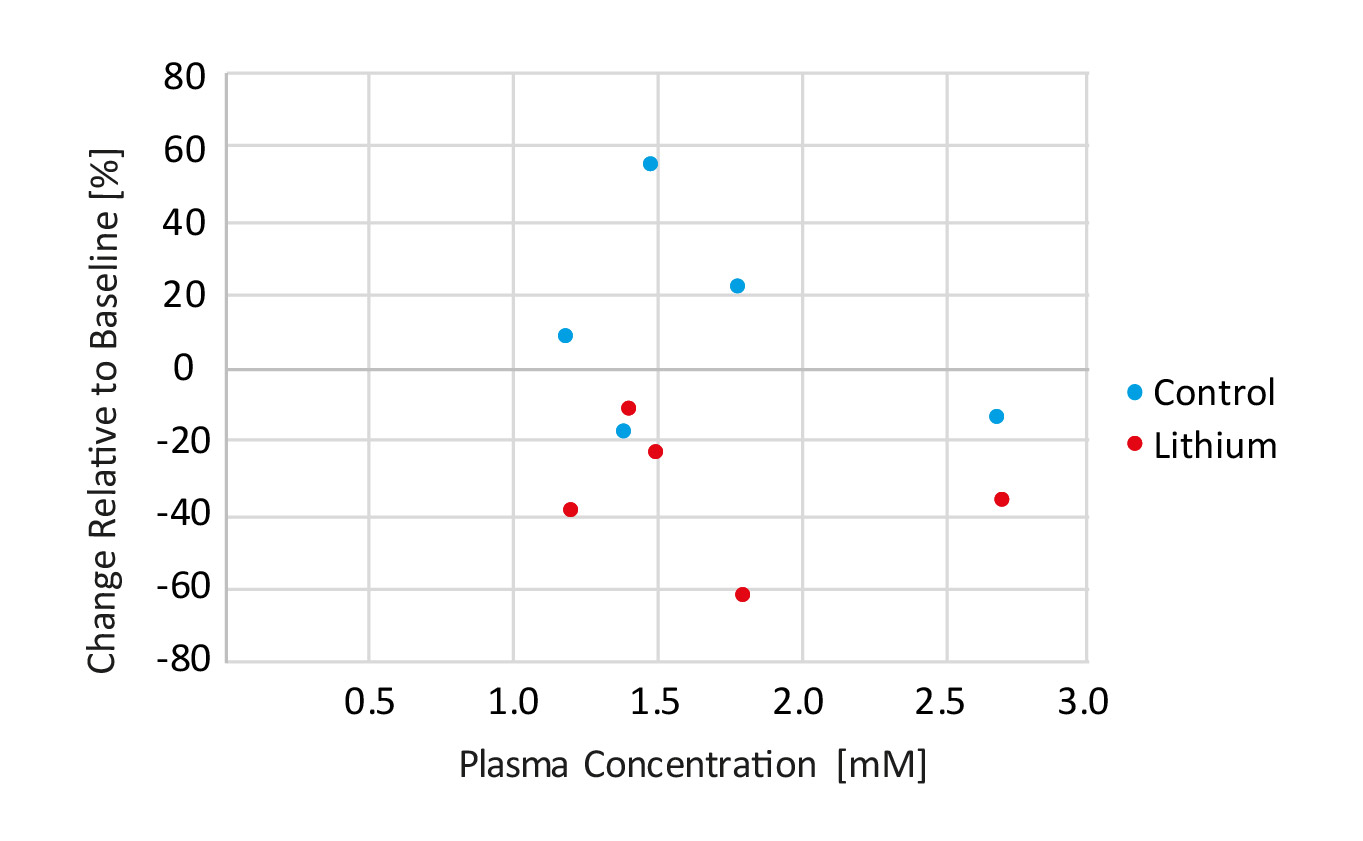
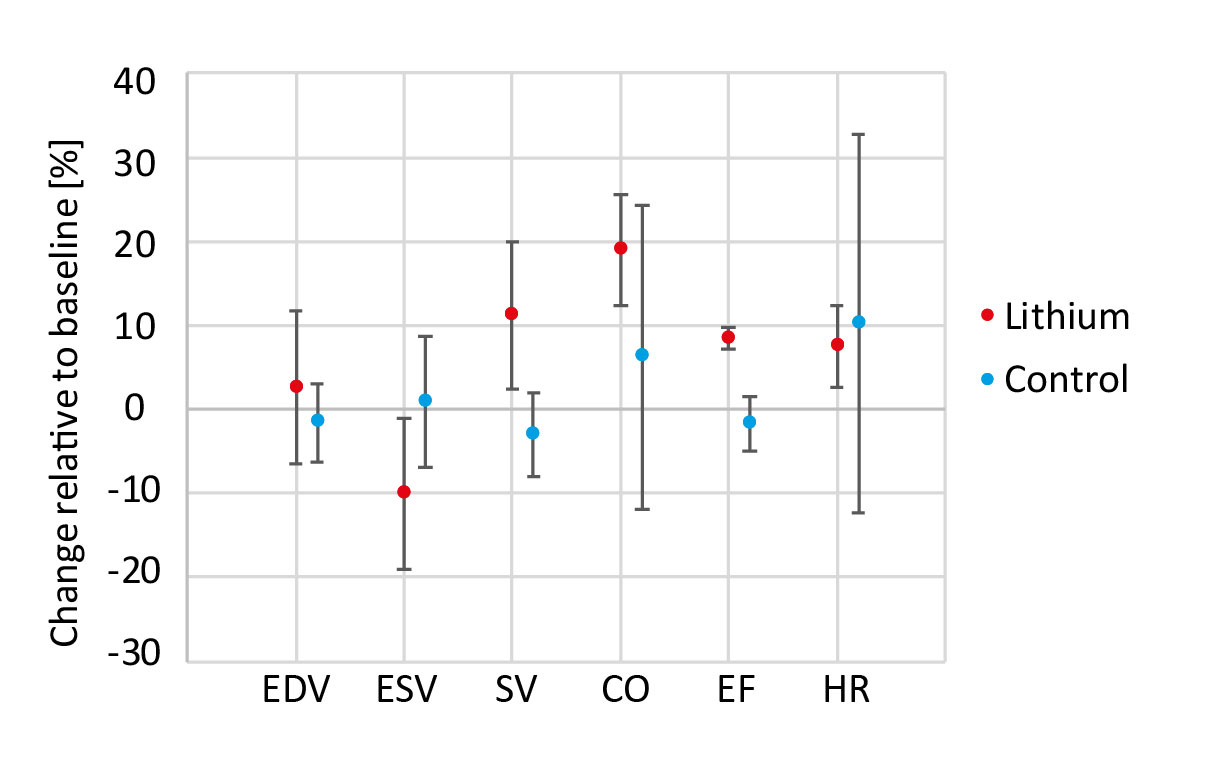
Figure 2 shows representative dynamic metabolite curves for one subject (control and treatment experiment). An overview for changes in lactate-to-bicarbonate ratio at different plasma concentration is displayed in Figure 3. A weak correlation can be observed, but more data for plasma concentrations higher than 1.5 mM needs to be recorded for meaningful statistical analysis. Assessment of cardiac function is shown in Figure 4.Discussion
This preliminary data shows that lithium modulates cardiac metabolism. The decrease in lactate-to-bicarbonate signal tends to appear in a dose dependent manner. As increases in EF and SV indicate a higher workload, it is difficult to differentiate whether lithium modulates metabolism directly or is a consequence. However, literature suggests that increased mitochondrial metabolism is one of the mechanisms of action for lithium in BD.9 Thus, probing metabolism of the heart and other tissues of interest (e.g. brain) using hyperpolarized [1-13C]pyruvate MR imaging hold potential for assessing the benefit-risk ratio of narrow therapeutic index drugs.Acknowledgements
The authors acknowledge funding from the Swiss National Science Foundation, grant 320030_153014.References
1. Mohandas, E. & Rajmohan, V. Lithium use in special populations. Indian J. Psychiatry 49, 211–8 (2007).
2. Merikangas, K. R. et al. Prevalence and correlates of bipolar spectrum disorder in the world mental health survey initiative. Arch. Gen. Psychiatry 68, 241–51 (2011).
3. Salimi, A., Gholamifar, E., Naserzadeh, P., Hosseini, M.-J. & Pourahmad, J. Toxicity of lithium on isolated heart mitochondria and cardiomyocyte: A justification for its cardiotoxic adverse effect. J. Biochem. Mol. Toxicol. 1–8 (2016). doi:10.1002/jbt.21836
4. Kang, Y. J. Molecular and cellular mechanisms of cardiotoxicity. Environ. Health Perspect. 109, 27–34 (2001).
5. Krajewski, M. et al. A multisample dissolution dynamic nuclear polarization system for serial injections in small animals. Magn. Reson. Med. (2016). doi:10.1002/mrm.26147
6. Lauritzen, M. H. et al. Enhancing the [13C]bicarbonate signal in cardiac hyperpolarized [1-13C]pyruvate MRS studies by infusion of glucose, insulin and potassium. NMR Biomed. 26, 1496–1500 (2013).
7. Sigfridsson, A. et al. Hybrid multiband excitation multiecho acquisition for hyperpolarized 13 C spectroscopic imaging. Magn. Reson. Med. 73, 1713–1717 (2015).
8. Reeder, S. B. et al. Multicoil Dixon chemical species separation with an iterative least-squares estimation method. Magn. Reson. Med. 51, 35–45 (2004).
9. Scaini, G. et al. Mitochondrial dysfunction in bipolar disorder: Evidence, pathophysiology and translational implications. Neurosci. Biobehav. Rev. 68, 694–713 (2016).
Figures