3702
Correlation Between Hyperpolarized 13C-signal and Lactate Concentration in a Human Breast Cancer Xenograft Model1Medical Biophysics, University of Toronto, Toronto, ON, Canada, 2Physical Sciences, Sunnybrook Research Institute, Toronto, ON, Canada, 3Cardiovascular Medicine, Radcliffe Department of Medicine, University of Oxford, Oxford, United Kingdom, 4GE Healthcare, Toronto, ON, Canada
Synopsis
Hyperpolarized 13C MRI has enabled metabolic (lactate- and pyruvate-) imaging in various clinical and pre-clinical studies to probe the production of lactate in tumours. A number of biological factors has been proposed to influence 13C-signal, with the total lactate pool size thought to be the dominant contributor based on the in vitro cell study by Day et al. In this study, we investigate whether the same relationship holds in a human breast cancer xenograft model in rats, as well as assessing the contributions from other biological components, including the rate of perfusion, transporters, and enzymes.
Introduction
Hyperpolarized (HP) 13C MRI is a technique that has undergone a rapid development in recent years, resulting in a number of successful human studies1-5. This technique commonly utilizes hyperpolarized [1-13C]pyruvate as a contrast agent to measure the production of lactate in tumours, which is known to correlate with metastasis and radiation resistance, leading to poor clinical outcomes6,7. The tumoural total lactate pool size (or lactate concentration) has been proposed to be the dominant contributor to the pyruvate-to-lactate conversion measured with HP 13C MRI in cells8. However, there are a number of molecular mechanisms aside from lactate pool size, such as rate of delivery, transporter and enzymes and enzyme expression (i.e. MCTs, LDHs), that concurrently influence the in vivo 13C-signals in tumours9. In this study, the correlation between MRI-derived 13C-signals and these biological factors was measured in a xenograft tumour model.Methods
Experimental Design and 13C imaging Six male Rowett nude (RNU) rats with subcutaneous xenografts of MDA-MB-231 human breast cancer cells (co-injected with MS1 mouse endothelial cells10) were scanned on a 3T GE MR750 scanner following the injection of 2ml of pre-polarized 80mM [1-13C]pyruvate, co-polarized with 27mM HP001 (bis-1,1-(hydroxymethyl)-[1-13C]cyclopropane-d8), over 12s via tail-vein catheter. Sequentially interleaved 3D images of lactate, pyruvate, and HP001 were acquired with spectral-spatial excitation followed by a dual-echo EPI readout (5s temporal resolution, 16 time points; axial; 64x8x6 cm3)11. After each set of metabolite images, a spectrum was acquired from the axial slab covering the kidneys. For anatomical reference, 2D fast spin echo (5s TR, 192x192 matrix, axial) images were acquired. Approximately 4.5 min after the initial [1-13C]pyruvate injection, 80mM/2ml non-hyperpolarized [3-13C]pyruvate was injected over 12s and the tumours were extracted and immediately flash-frozen approximately 1:30 min from the start of [3-13C]pyruvate injection. The timeline of the experimental procedure is illustrated in Fig. 1. The metabolite images were corrected for off-resonance shift based on the lactate frequency offset observed in the spectroscopy interleave and then summed over time to improve SNR. Signals of each metabolite within the tumour were determined by summing the signal within the tumour ROI that was drawn on the T2-weighted image.
NMR Analysis NMR data from the metabolite extracts were acquired on a 7T NMR spectrometer. Metabolites were extracted from tumour samples in perchloric acid, lyophilized, and re-dissolved in 450μl D2O containing 5mM DMSO. Portions of each tumour were preserved in RIPA buffer for future analysis of transporter and enzyme expression. Proton spectra were acquired using binomial solvent suppression and 13C spectra were acquired using a proton-decoupled (WALTZ-16) 13C sequence (Fig. 2). The area-under-the-peak signals (SNR > 2) from sodium lactate and [3-13C]sodium pyruvate concentration standards were compared to determine ‘apparent’ total lactate pool size and [3-13C]lactate concentration, respectively. [1-13C]lactate concentration was corrected for T1 effects assuming a T1 of 40s12.
Results and Discussion
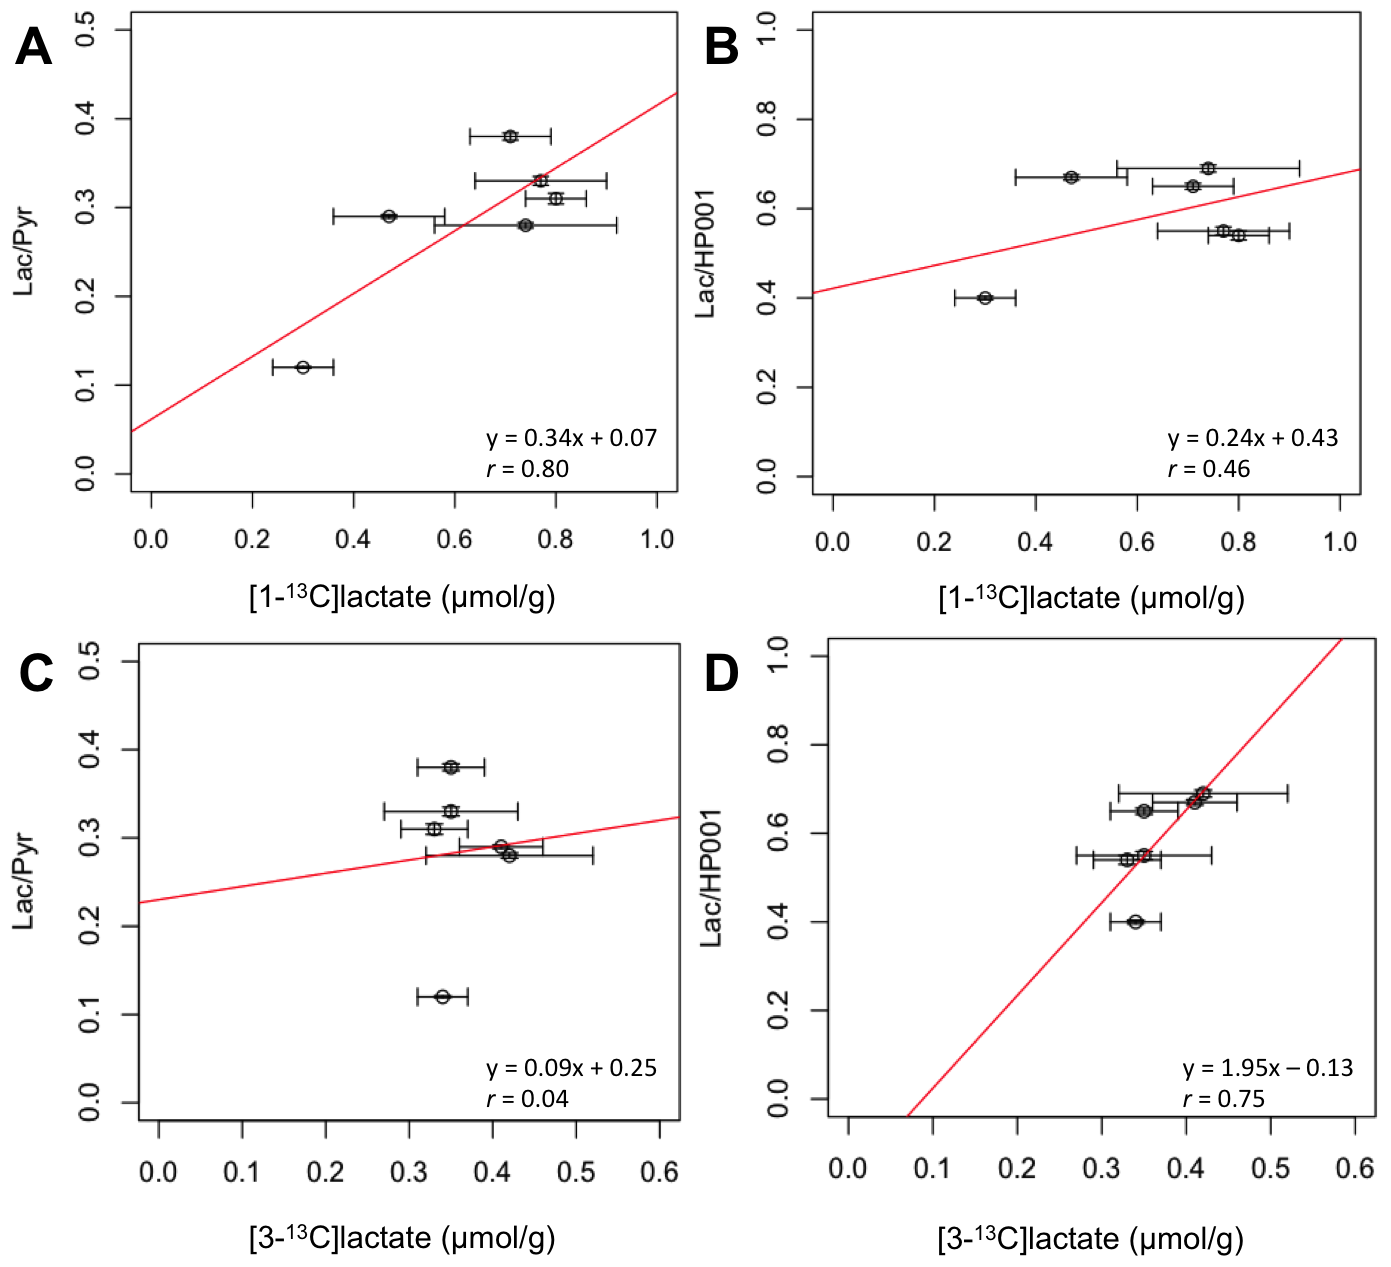
In contrast to previous results in a different tumor model8, these data show that, for MDA-MB-231 xenografts, the tumours with high lactate pool size showed the low Lac/Pyr and Lac/HP001 ratios (Fig. 3). The lower metabolite ratios from the hyperpolarized imaging data may be attributed to tumours with high lactate pool size being better perfused, as supported by a positive trend between HP001 SNR and lactate pool size (Fig. 4D). Similarly, HP [1-13C]lactate-signals normalized by HP001-signals demonstrated a better correlation to total lactate pool size compared to that normalized by HP [1-13C]pyruvate-signals (r = 0.87 vs. 0.36, Fig. 3). Furthermore, ex vivo analysis of extracted tumours show that both [1-13C]- and [3-13C]lactate concentrations demonstrated negative relationships when compared to total lactate pool size (r = 0.32 and 0.91, respectively, Fig. 4 A/B). Interestingly, [1-13C]lactate concentration from extracted tumour appears to show a stronger correlation to Lac/Pyr than Lac/HP001 (r = 0.80 vs. 0.46, Fig. 5 A/B). On the contrary, ex vivo [3-13C]lactate concentration showed a stronger correlation to Lac/HP001 than Lac/Pyr (r = 0.04 vs. 0.75, Fig. 5 C/D). No obvious trends were observed between total lactate pool size and tumour volume (Fig. 4C) and in between [1-13C]- and [3-13C]lactate concentrations from extracted tumours (data not shown).Conclusion
These results suggest that tumor lactate concentration is not the dominant factor determining the observed hyperpolarized 13C pyruvate-to-lactate conversion in the MDA-MB-231 xenografts used in this study. In the future, the correlation between 13C-signals and the expression levels of transporters and enzymes (e.g. MCTs and LDHs) known to contribute to 13C-signals will be further investigated using the preserved tissue samples.Acknowledgements
The authors thank Jennifer Barry for assistance with the animal handling. Funding support from the Canadian Institute for Health Research Operating Grant MOP-133544.References
1Cunningham CH, et al. Circ. Res. 2016;119(11):1177-82.
2Nelson SJ, et al. Sci Transl Med. 2013;108.
3Tyler D, et al. 2017. Proceedings of the 25th Annual meeting of ISMRM; Honolulu, Hawaii. Abstract 0726.
4Aggarwal et al. Eur. Urol. 2017.
5Granlund et al. 2016. Proceedings of the 24th Annual meeting of ISMRM; Singapore. Abstract 3690.
6Walenta S, et al. Cancer Res. 2000; 60:916–921.
7Quennet V, et al. Radiother. Oncol. 2006; 81:130-135.
8Day SE, et al. Nat. Med. 2017; 13(11):1382–1387.
9Hurd RE, et al. JMRI. 2012; 36(6):1314–1328.
10Lau JYC, et al. NMR Biomed. 2016; 29(8):1038-47.
11Geraghty BJ, et al. Magn. Res. Med. 2017; 77(2):538-46.
12Harris T, et al. Proc. Natl. Acad. Sci. 2009;106:18131-18136.
Figures
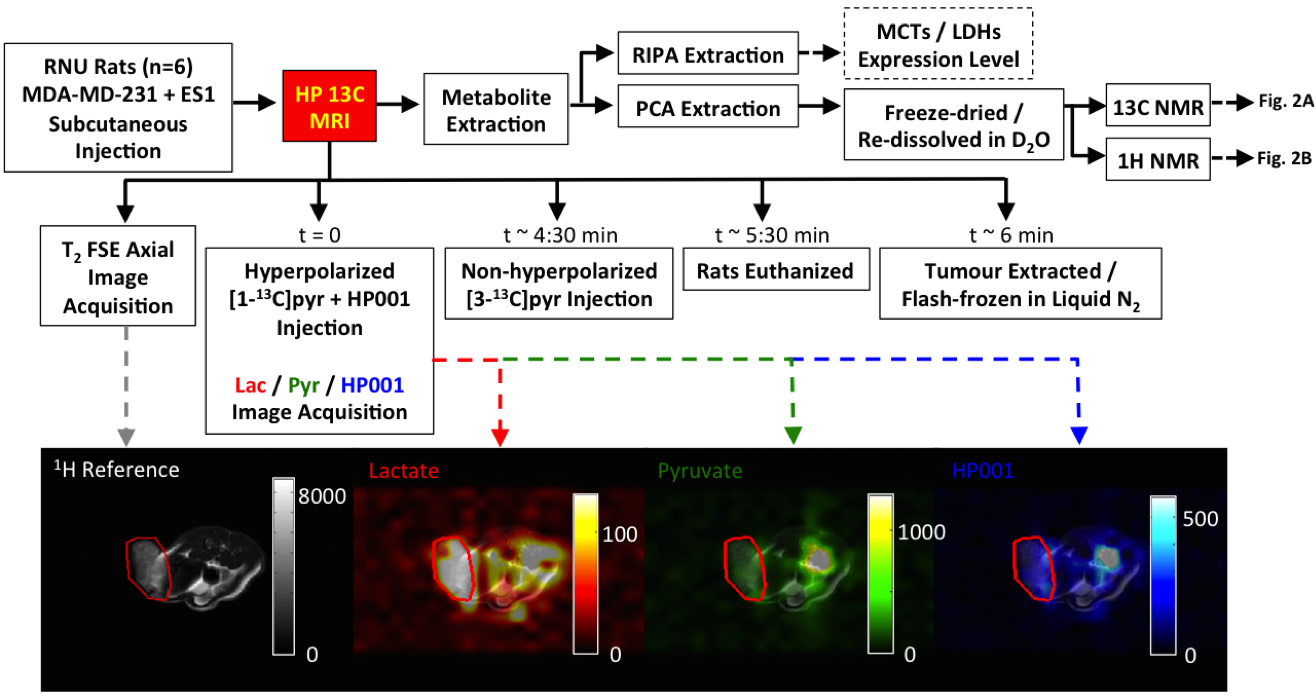
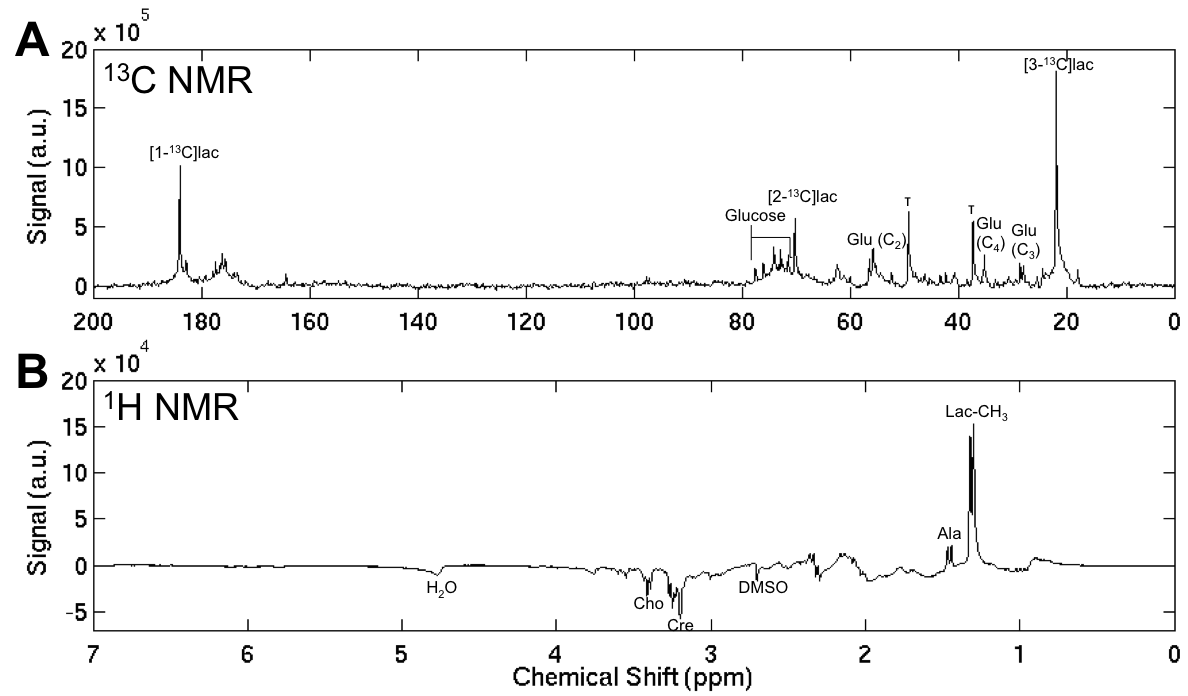
Fig. 2) An example of a proton-decoupled (WALTZ-16) 13C NMR spectra (flip angle=45°, TR=5.5s, 32768 points, 40000 scans, 10Hz exponential apodization) acquired to assess the amounts of [1-13C]- and [3-13C]-lactate remaining in the extracted tumour is shown in (A). An example spectra acquired with 1H binomial 1331 sequence used to suppress water signal (4.7ppm) while preserving lactate (CH3) signal to determine total lactate pool size is shown in (B). A number of peaks of interests are labelled. Lac: lactate, Ala: alanine, Glu: glutamate, Τ: taurine, Cre: creatine, Cho: choline.
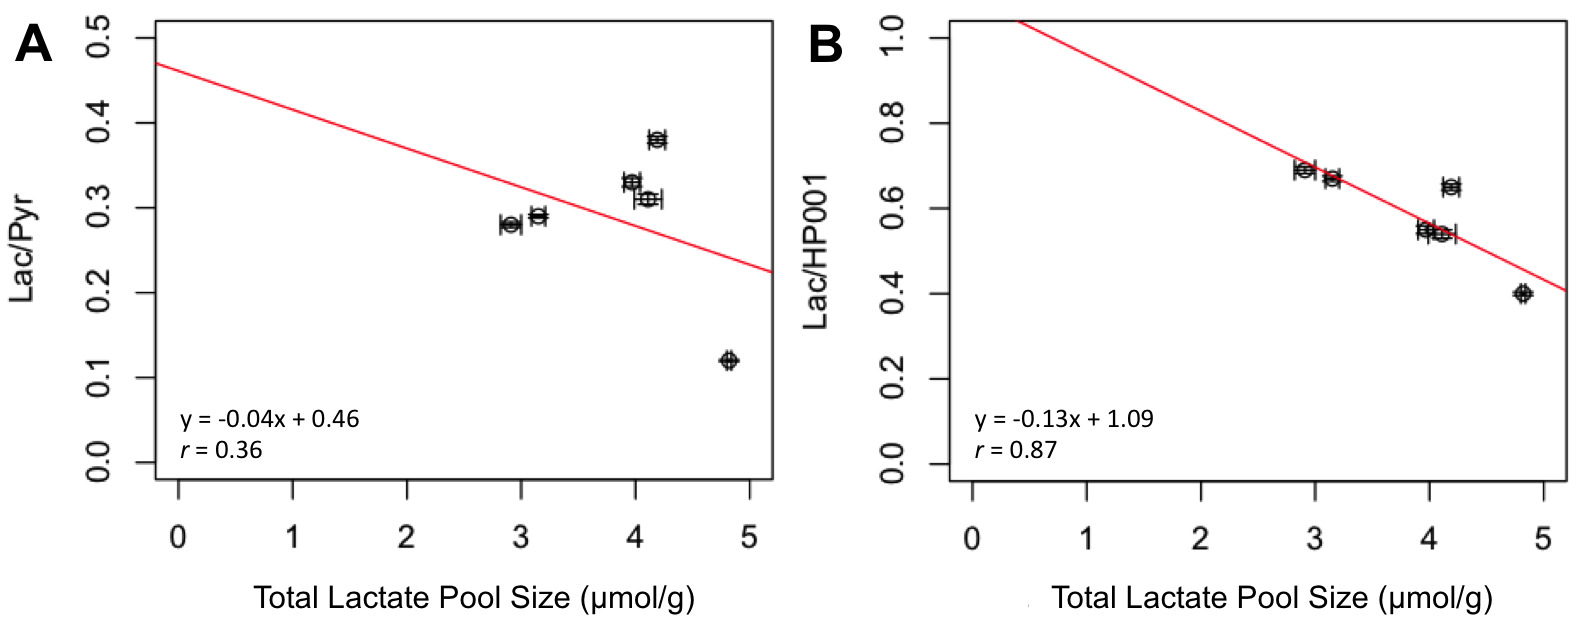
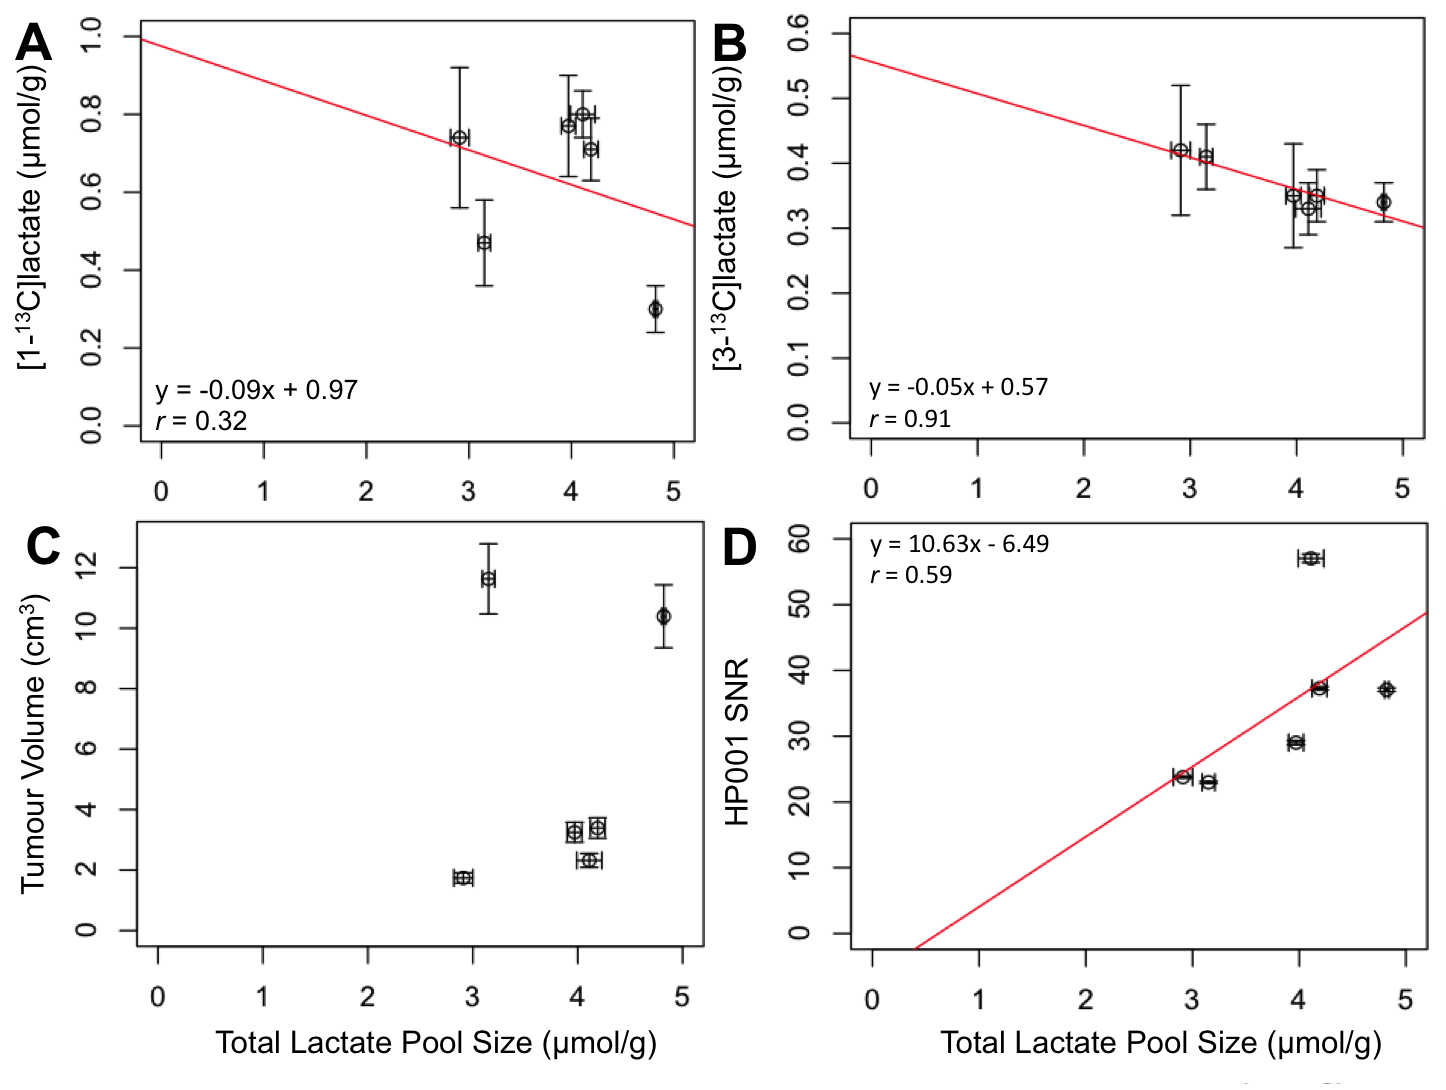
Fig. 4) The total lactate pool size was compared to [1-13C]- (A), [3-13C]-lactate concentrations (B), approximate tumour volume (C), and SNR of HP001 (D). The linear lines of best fit are shown with its equation and the Pearson’s correlation coefficient (r) for (A), (B), and (D).