3701
Case Report: Hyperpolarized 13C Metabolic Imaging of a Castration-Resistant Prostate Cancer Patient1Medical Biophysics, University of Toronto, Toronto, ON, Canada, 2Physical Sciences, Sunnybrook Research Institute, Toronto, ON, Canada, 3Cardiovascular Medicine, Radcliffe Department of Medicine, University of Oxford, Oxford, United Kingdom, 4GE Healthcare, Toronto, ON, Canada, 5Pharmacy, Sunnybrook Research Institute, Toronto, ON, Canada, 6Medical Imaging, University of Toronto and Ontario Institute of Cancer Research, Toronto, ON, Canada, 7Sunnybrook Odette Cancer Centre and Research Institute, Sunnybrook Health Sciences Centre, Toronto, ON, Canada, 8Institute of Medical Science, University of Toronto, Toronto, ON, Canada
Synopsis
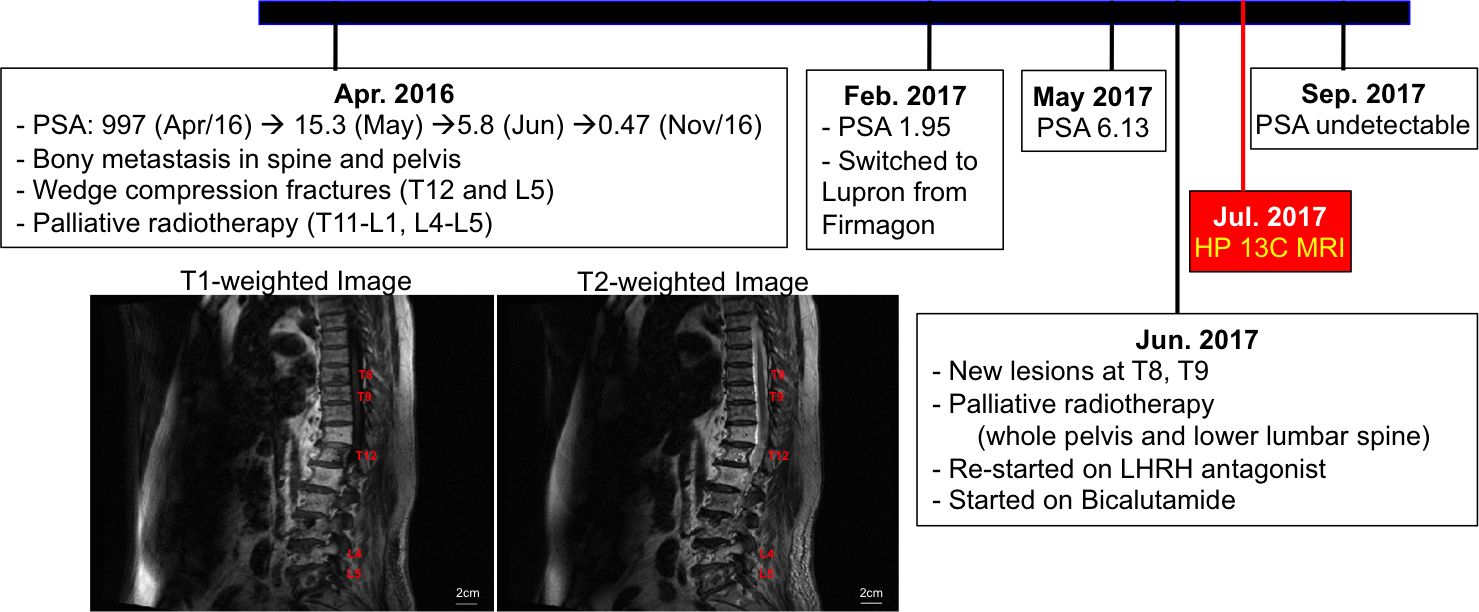
The feasibility of applying hyperpolarized 13C MRI to acquire metabolic (lactate, pyruvate) images of the vertebral region of a castration-resistant prostate cancer patient was investigated in this pilot study. The lactate and pyruvate signal-to-noise ratios (SNRs) of spine, back muscle, aorta, and kidney are reported. The summary of patient’s clinical history is illustrated to aid the understanding of implications of 13C-lactate signals observed in this study.
Introduction
Hyperpolarized (HP) 13C MRI is a new, non-invasive metabolic imaging approach that has been recently demonstrated in human studies1-5. This technique enables the imaging of [1-13C]pyruvate and its metabolic products including [1-13C]lactate and 13C-bicarbonate in vivo6. It has the potential to be a powerful clinical tool in assessing the risk of metastasis and to monitor response to cancer treatments, based on the known correlation between tumour lactate concentration, metastasis and radiation resistance7,8. In this study, the feasibility of imaging 13C-lactate in the region of spinal metastases in a patient with castration-resistant prostate cancer (CPRC) using HP 13C MRI is investigated. Here, we present the data of the first HP 13C imaging study of the vertebral region of this patient along with his clinical history (Fig. 1).Methods
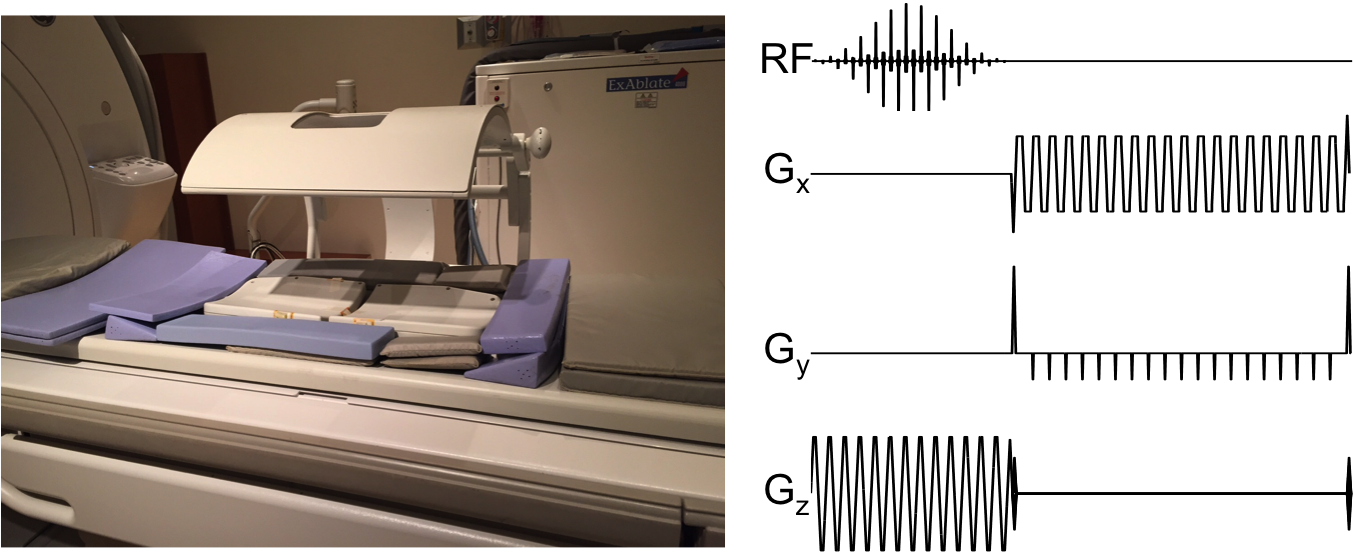
Data Acquisition: The 13C volume transmitter (GE Healthcare, Cleveland, OH) and the 8-channel 13C receive array consisting of 2 paddles were installed on a GE MR750 3T MRI (GE Healthcare, Waukesha, WI) as shown in Fig. 2. A 1.5cm spherical phantom containing 8M 13C-urea was placed beneath the receiver coil for frequency and transmit power calibration. A 20-gauge intravenous catheter was placed in the patient’s left arm and he was positioned supine with the receive array along the spine. A 0.1mmol/kg dose of HP [1-13C]pyruvate was injected at 4mL/s followed by a 25mL saline flush at 5mL/s. The 13C signal was acquired with spectral-spatial excitation of lactate/pyruvate/urea resonances (sequentially) followed by a dual-echo 3D EPI readout (5s TR; sagittal; 2cm isotropic resolution with FOV 256x40x20cm3)9. After each set of metabolite images, a spectrum was acquired from the 4cm-thick axial slab centred over the T8/T9 region. Prior to 13C imaging acquisition, a standard 1H 3-plane single-shot fast spin echo (SSFSE) localizer scan (FOV 48x48 cm2, 15/6/12cm axial/sagittal/coronal slabs, 7 slices per plane, 5mm slice-thickness) was acquired for anatomical overlay. Sagittal FLAIR and FRFSE sequence over the spinal region (FOV 40x40x6.5cm3, 5mm slice-thickness) were also acquired.
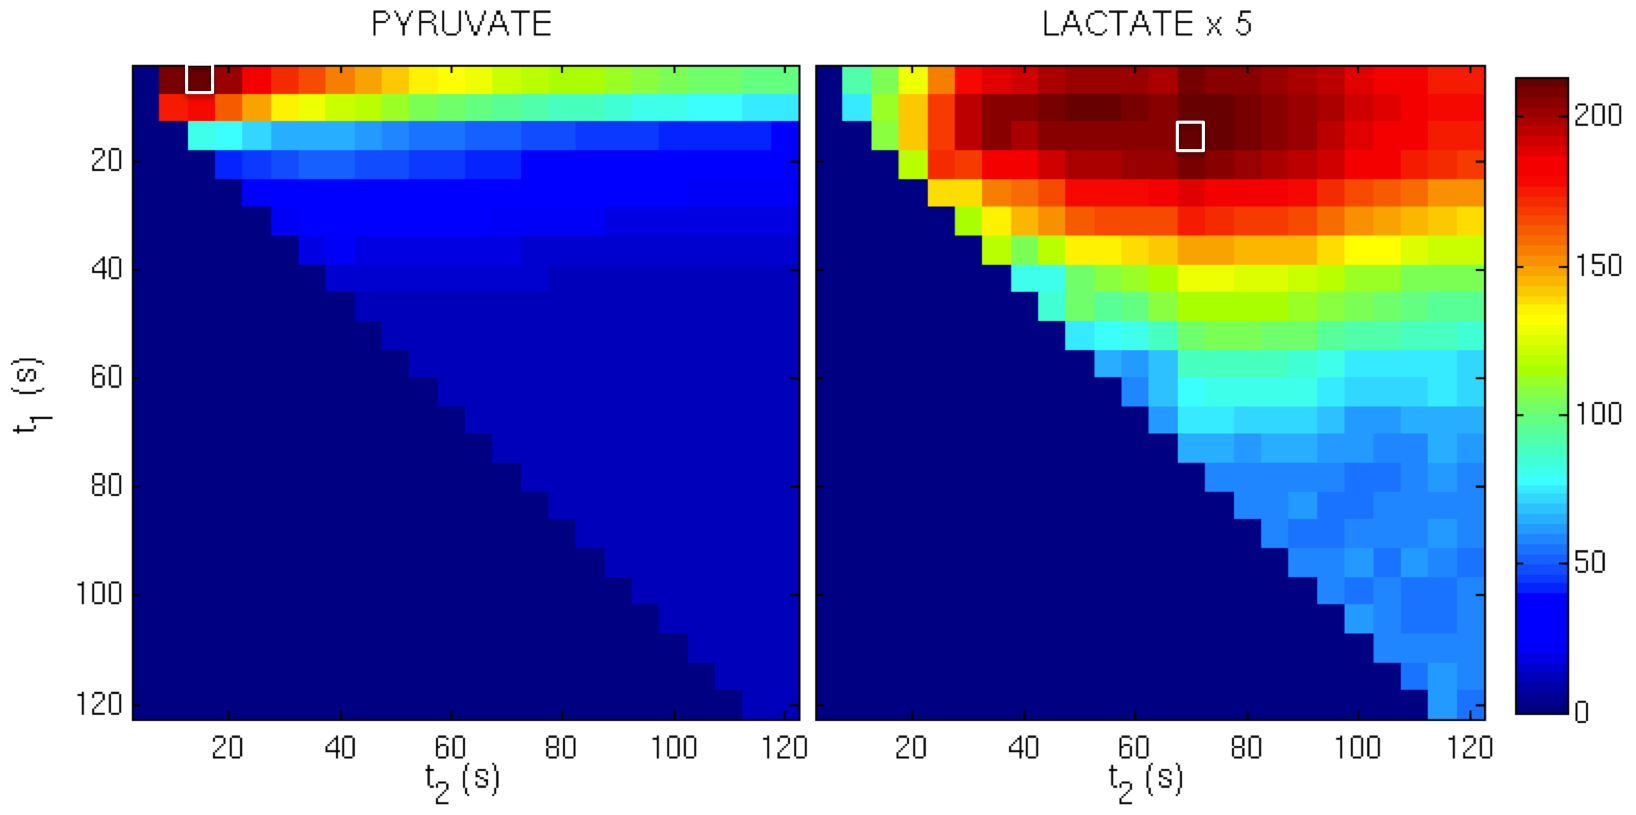
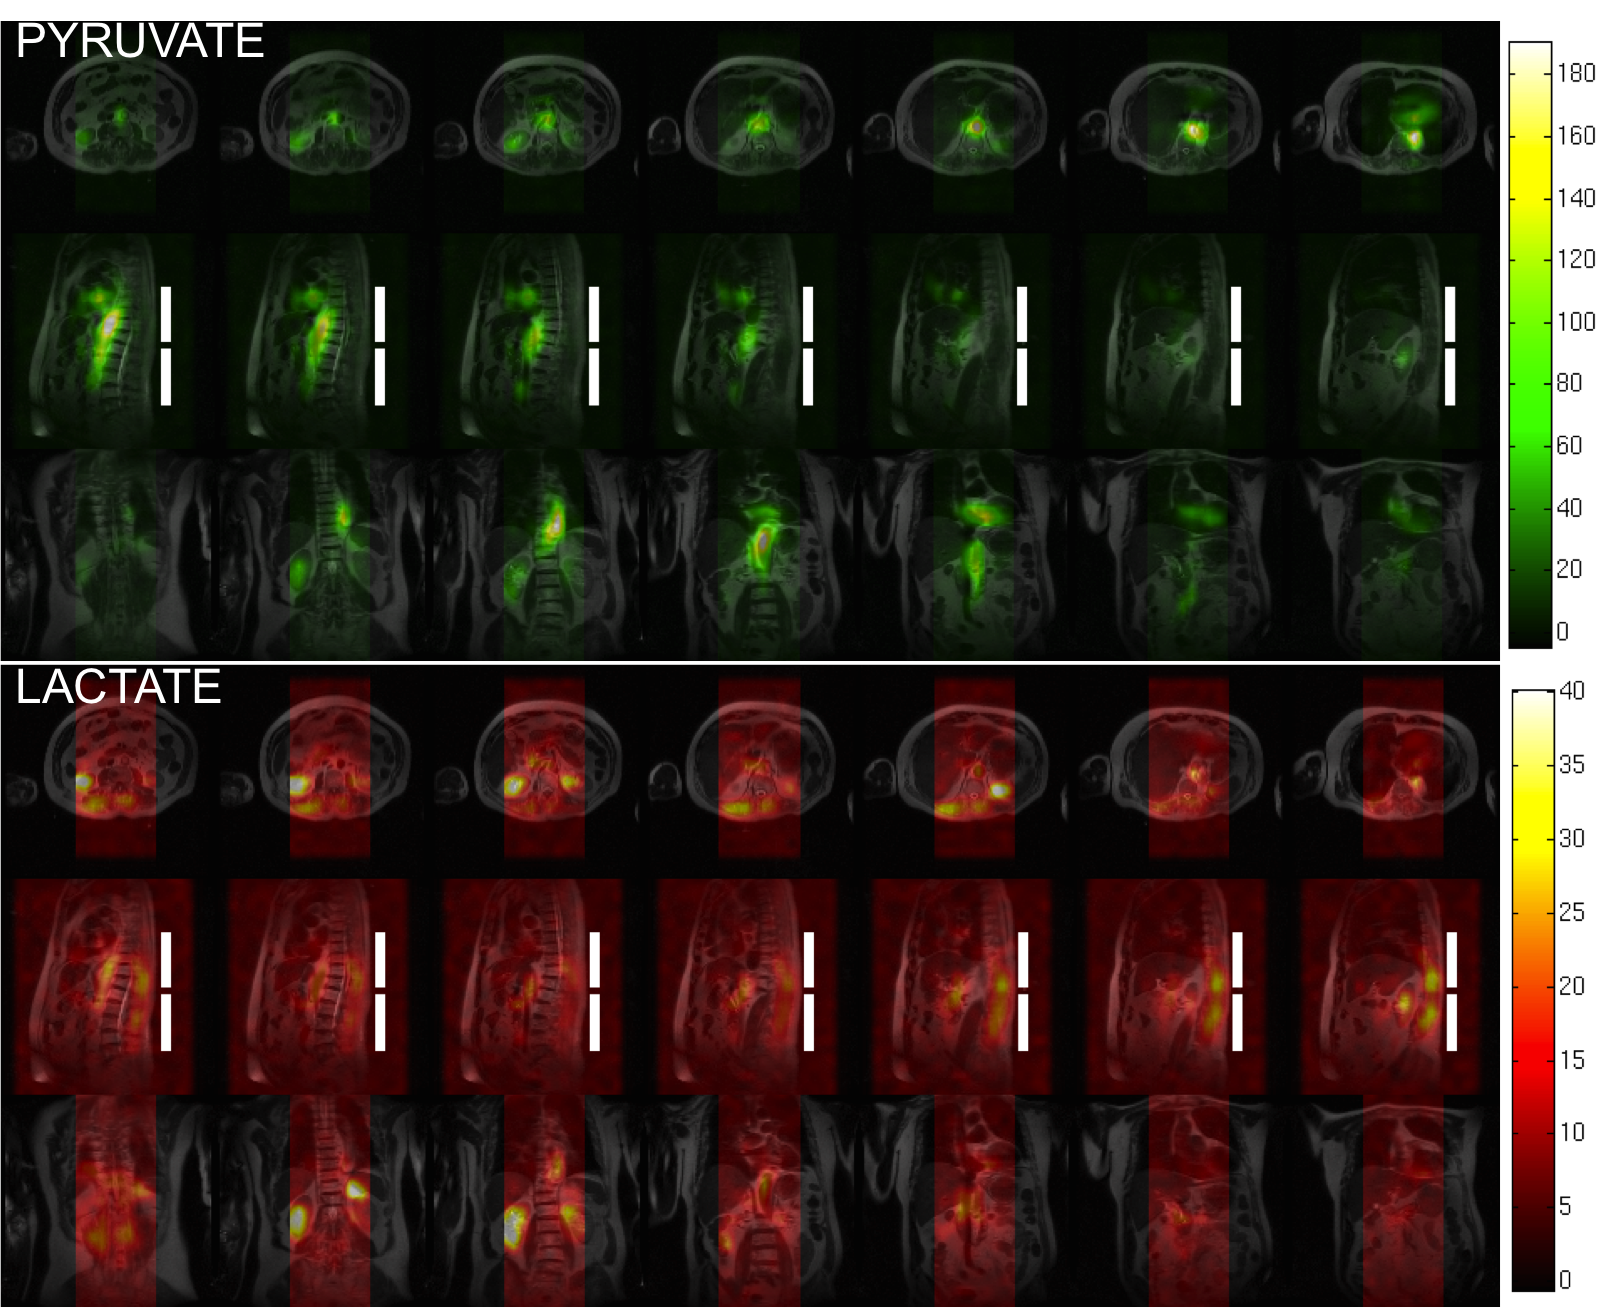
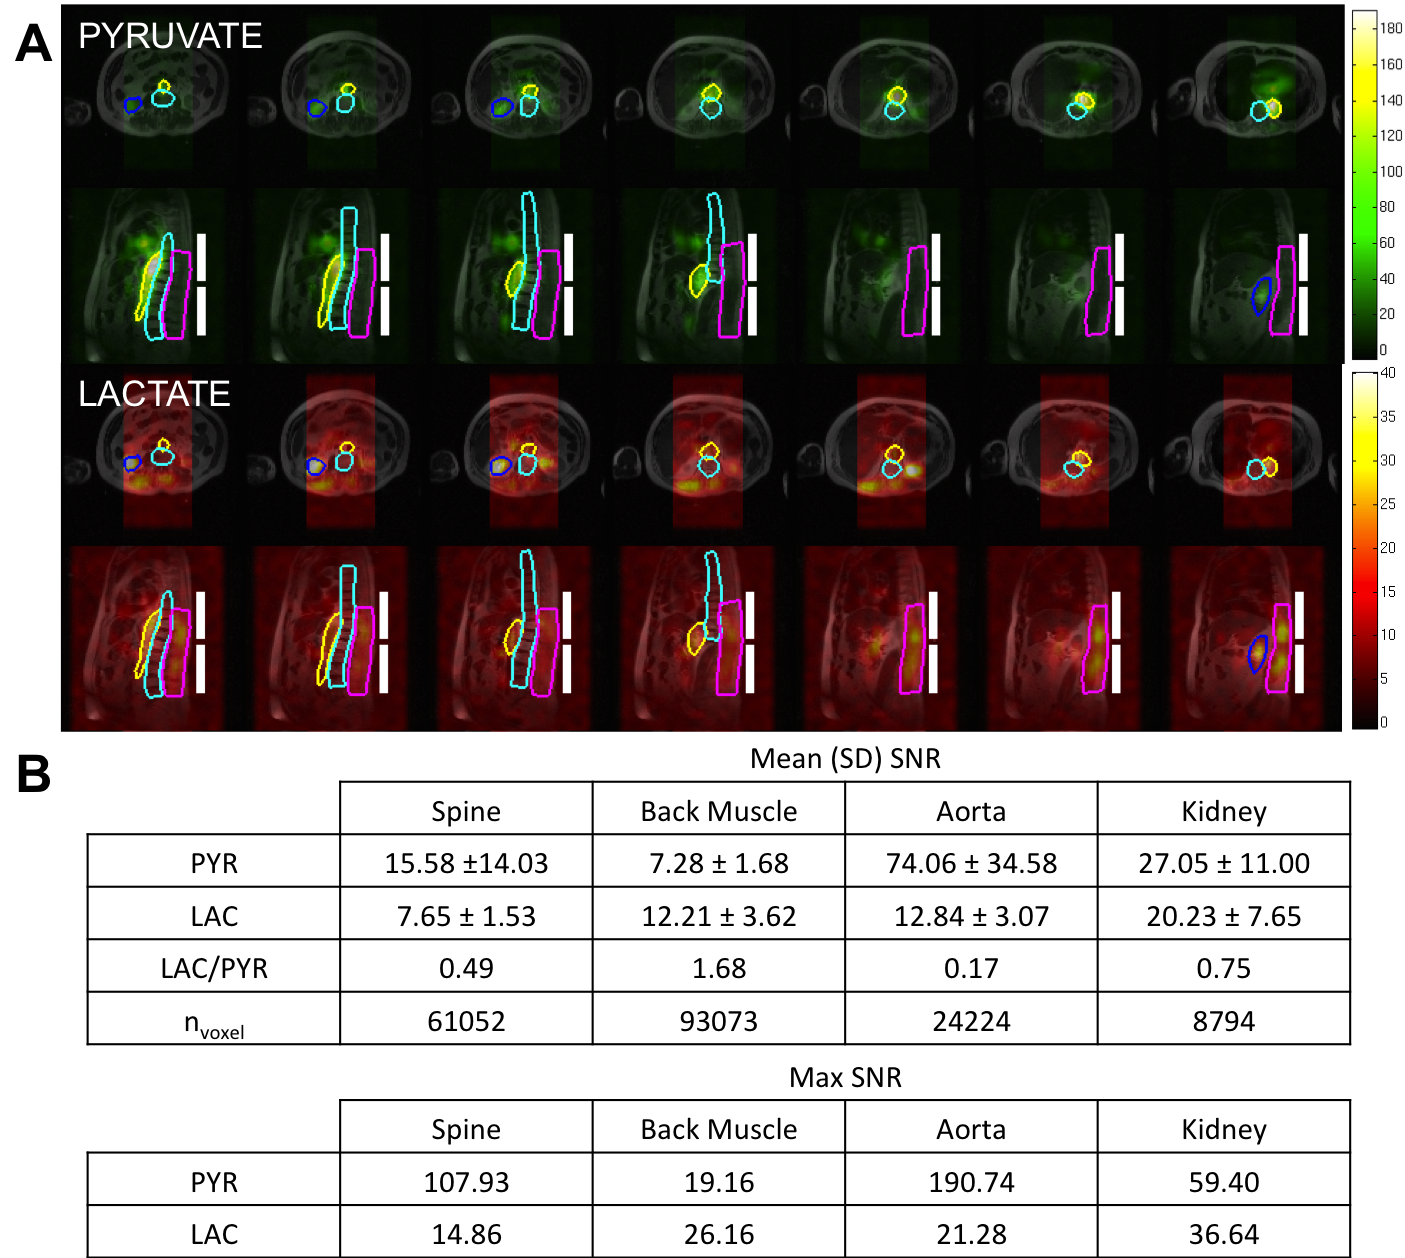
Data Analysis: The images were corrected for -52Hz off-resonance shift based on the lactate frequency offset observed in the spectroscopy interleave. The final metabolite images were generated by summing the individual time-points to improve SNR. The time window over which the pyruvate and lactate-signals were summed was determined by maximizing the SNR (Fig. 3). These summed images were overlaid on the localizer images and interpolated to have the matrix size of 512x512 to provide an anatomical reference for the metabolite distributions (Fig. 4). ROIs over aorta, kidney, spine, and back muscles were drawn on overlaid images. The lactate-to-pyruvate ratio (Lac/Pyr), maximum and mean (±SD) SNRs within each ROI were determined.
Results and Discussion
The summation of signals over 5-15s and 15-70s provided maximum SNR for pyruvate and lactate, respectively. The resampled 13C images onto the localizer images show notable lactate signals from the aorta, kidney, and skeletal muscle adjacent to the spine. The maximum and mean pyruvate and lactate SNRs for each ROI are summarized in Fig. 5. While there was no significantly elevated lactate detected within the spine in this patient (Lac/Pyr = 0.49), strong lactate signals within the skeletal muscle adjacent T10-L5 were observed (Lac/Pyr = 1.68). Since this patient had a remarkable response to his treatment as evidenced by declining prostate specific antigen (PSA) levels prior to HP 13C MRI, which eventually became undetectable 4 months later, the low lactate in the spine is consistent with the patient’s beneficial clinical course (Fig. 1). Also, despite the relatively high mean pyruvate SNR from the spine (15.58), it displays almost an equally high variance of 14.03. On the contrary, the lactate SNR from the spine shows consistency at 7.65±1.53 and is comparable to that of skeletal muscle adjacent to the spine (12.21±3.62) and aorta (12.84±3.07), suggesting that the coil configuration and pulse sequence used in this study will be adequate in detecting lactate signals from spinal metastases in future studies.Conclusion
In this study, we demonstrated the feasibility of acquisition and reconstruction of large FOV (256x40x20cm3) HP 13C pyruvate- and lactate-images of the vertebral region of a CRPC patient with no adverse clinical effects. Recent clinical assessment of this patient suggests that he may have had barely active metastases at the time of the HP 13C study, suggesting that the image presented in this abstract may reflect that of a negative control, providing useful information regarding the background signal that may aid the interpretation in future cases.Acknowledgements
The authors thank Julie Green and Sumeet Sachdeva for coordinating the study and Ruby Endre for MR technical support. Funding support from the Prostate Cancer Canada Movember Discovery Grant (D2013-6)References
1Cunningham CH, et al. Circulation research. 2016;119(11):1177-82.
2Nelson SJ, et al. Sci Transl Med. 2013;108.
3Tyler D, et al. 2017. Proceedings of the 25th Annual meeting of ISMRM; Honolulu, Hawaii. Abstract 0726.
4Aggarwal et al. Eur. Urol. 2017.
5Granlund et al. 2016. Proceedings of the 24th Annual meeting of ISMRM; Singapore. Abstract 3690.
6Ardenkjær-Larsen JH, et al. 2003; 100(18):10158–10163.
7Walenta S, et al. Cancer Res. 2000; 60:916–921.
8Quennet V, et al. Radiother. Oncol. 2006; 81:130-135.
9Geraghty BJ, et al. Magn. Res. Med. 2017; 77(2):538-46.
Figures