3699
Hyperpolarized [1-13C]pyruvate MRS detects dynamic glucose metabolism according to stages of diabetes in mouse model1Yonsei University College of Medicine, Seoul, Republic of Korea, 2Department of Anatomy, Yonsei University College of Medicine, Seoul, Republic of Korea, 3Department of Electrical and Electronic Engineering, Yonsei University, Seoul, Republic of Korea
Synopsis
Recently, diabetes has been suggested as a risk factor for inducing cognitive impairment. Thus, a quantitative imaging method to validate the metabolic status of the brain according to the stages of diabetes may help elucidate the relationship between the development of cognitive impairment and glucose metabolism of the brain. This study performed hyperpolarized [1-13C]pyruvate imaging in the brain of both pre-diabetes (Pre-DM) and type 2 diabetes (T2DM) mouse model. It shows dynamic brain glucose metabolism according to the stages of diabetes with excellent sensitivity.
Introduction
Recently, diabetes has been suggested as a risk factor for inducing cognitive impairment. Patients with diabetes have a 2-fold risk to develop Alzheimer’s disease and a shortened conversion time from normal to mild cognitive impairment1,2. Since diabetes is a sequentially progressing metabolic disease, many factors related to metabolisms such as serum glucose level, insulin, glucagon, and GLP1 change dynamically by diabetes stages3. However, it remains unclear whether brain glucose metabolism is not affected or dynamically changed by their diabetes stage. Thus, a quantitative imaging method to validate the metabolic status of the brain according to the stages of diabetes may help elucidate the relationship between the development of cognitive impairment and glucose metabolism of the brain. We tracked real-time glucose metabolism of the brain by using hyperpolarized [1-13C]pyruvate imaging technique quantitating conversion from injected [1-13C]pyruvate to [1-13C]lactate in vivo4. To compare the metabolic stress status according to diabetic stages, we used two diabetes models, pre-diabetes (Pre-DM) and type 2 diabetes (T2DM).
Methods
All animal procedures were approved by the IACUC of Yonsei Univerisity College of Medicine (No.2015-0039). A pre-DM mouse model was constructed by fed 60% high-fat diet (HFD) for 24 weeks for seven weeks old male ICR mice. The T2DM mouse model was produced by intraperitoneally injecting 100mg/kg of streptozotocin at 4th-week during feeding HFD for 12weeks to induce beta cell damage. We measured body weight, serum glucose level, and performed glucose tolerance test. We tested cognitive status by Morris water-maze behavioral task. We hyperpolarized [1-13C]pyruvic acid (Cambridge Isotope, Tewksbury, MA) mixed with 15mM OX063 radical(Oxford Instruments, Oxford, UK) and 1.5mM Dotarem in HyperSense. We used dissolved 75mM [1-13C]pyruvic acid for tail vein injection. All MRI experiments were performed on a 9.4T animal MRI scanner using a 1H-13C dual-tuned surface transmit/receive coil or 13C single-tuned mouse head coil (Bruker BioSpin MRI, Ettlingen, Germany). For the dynamic hyperpolarized MRS, we acquired 13C free induction decay (FID) data with a flip angle of 10° and a time resolution of 1s. We acquired single time point hyperpolarized 13C free induction decay for chemical shift imaging using centric-ordered phase encoding with a flip angle of 10° from the brain scanned in a 3.5 mm-thick coronal slices. We collected data at 27 s after the start of pyruvate injection. All data were processed using MATLAB (R2016a, MathWorks, MA, USA).Result and Discussion
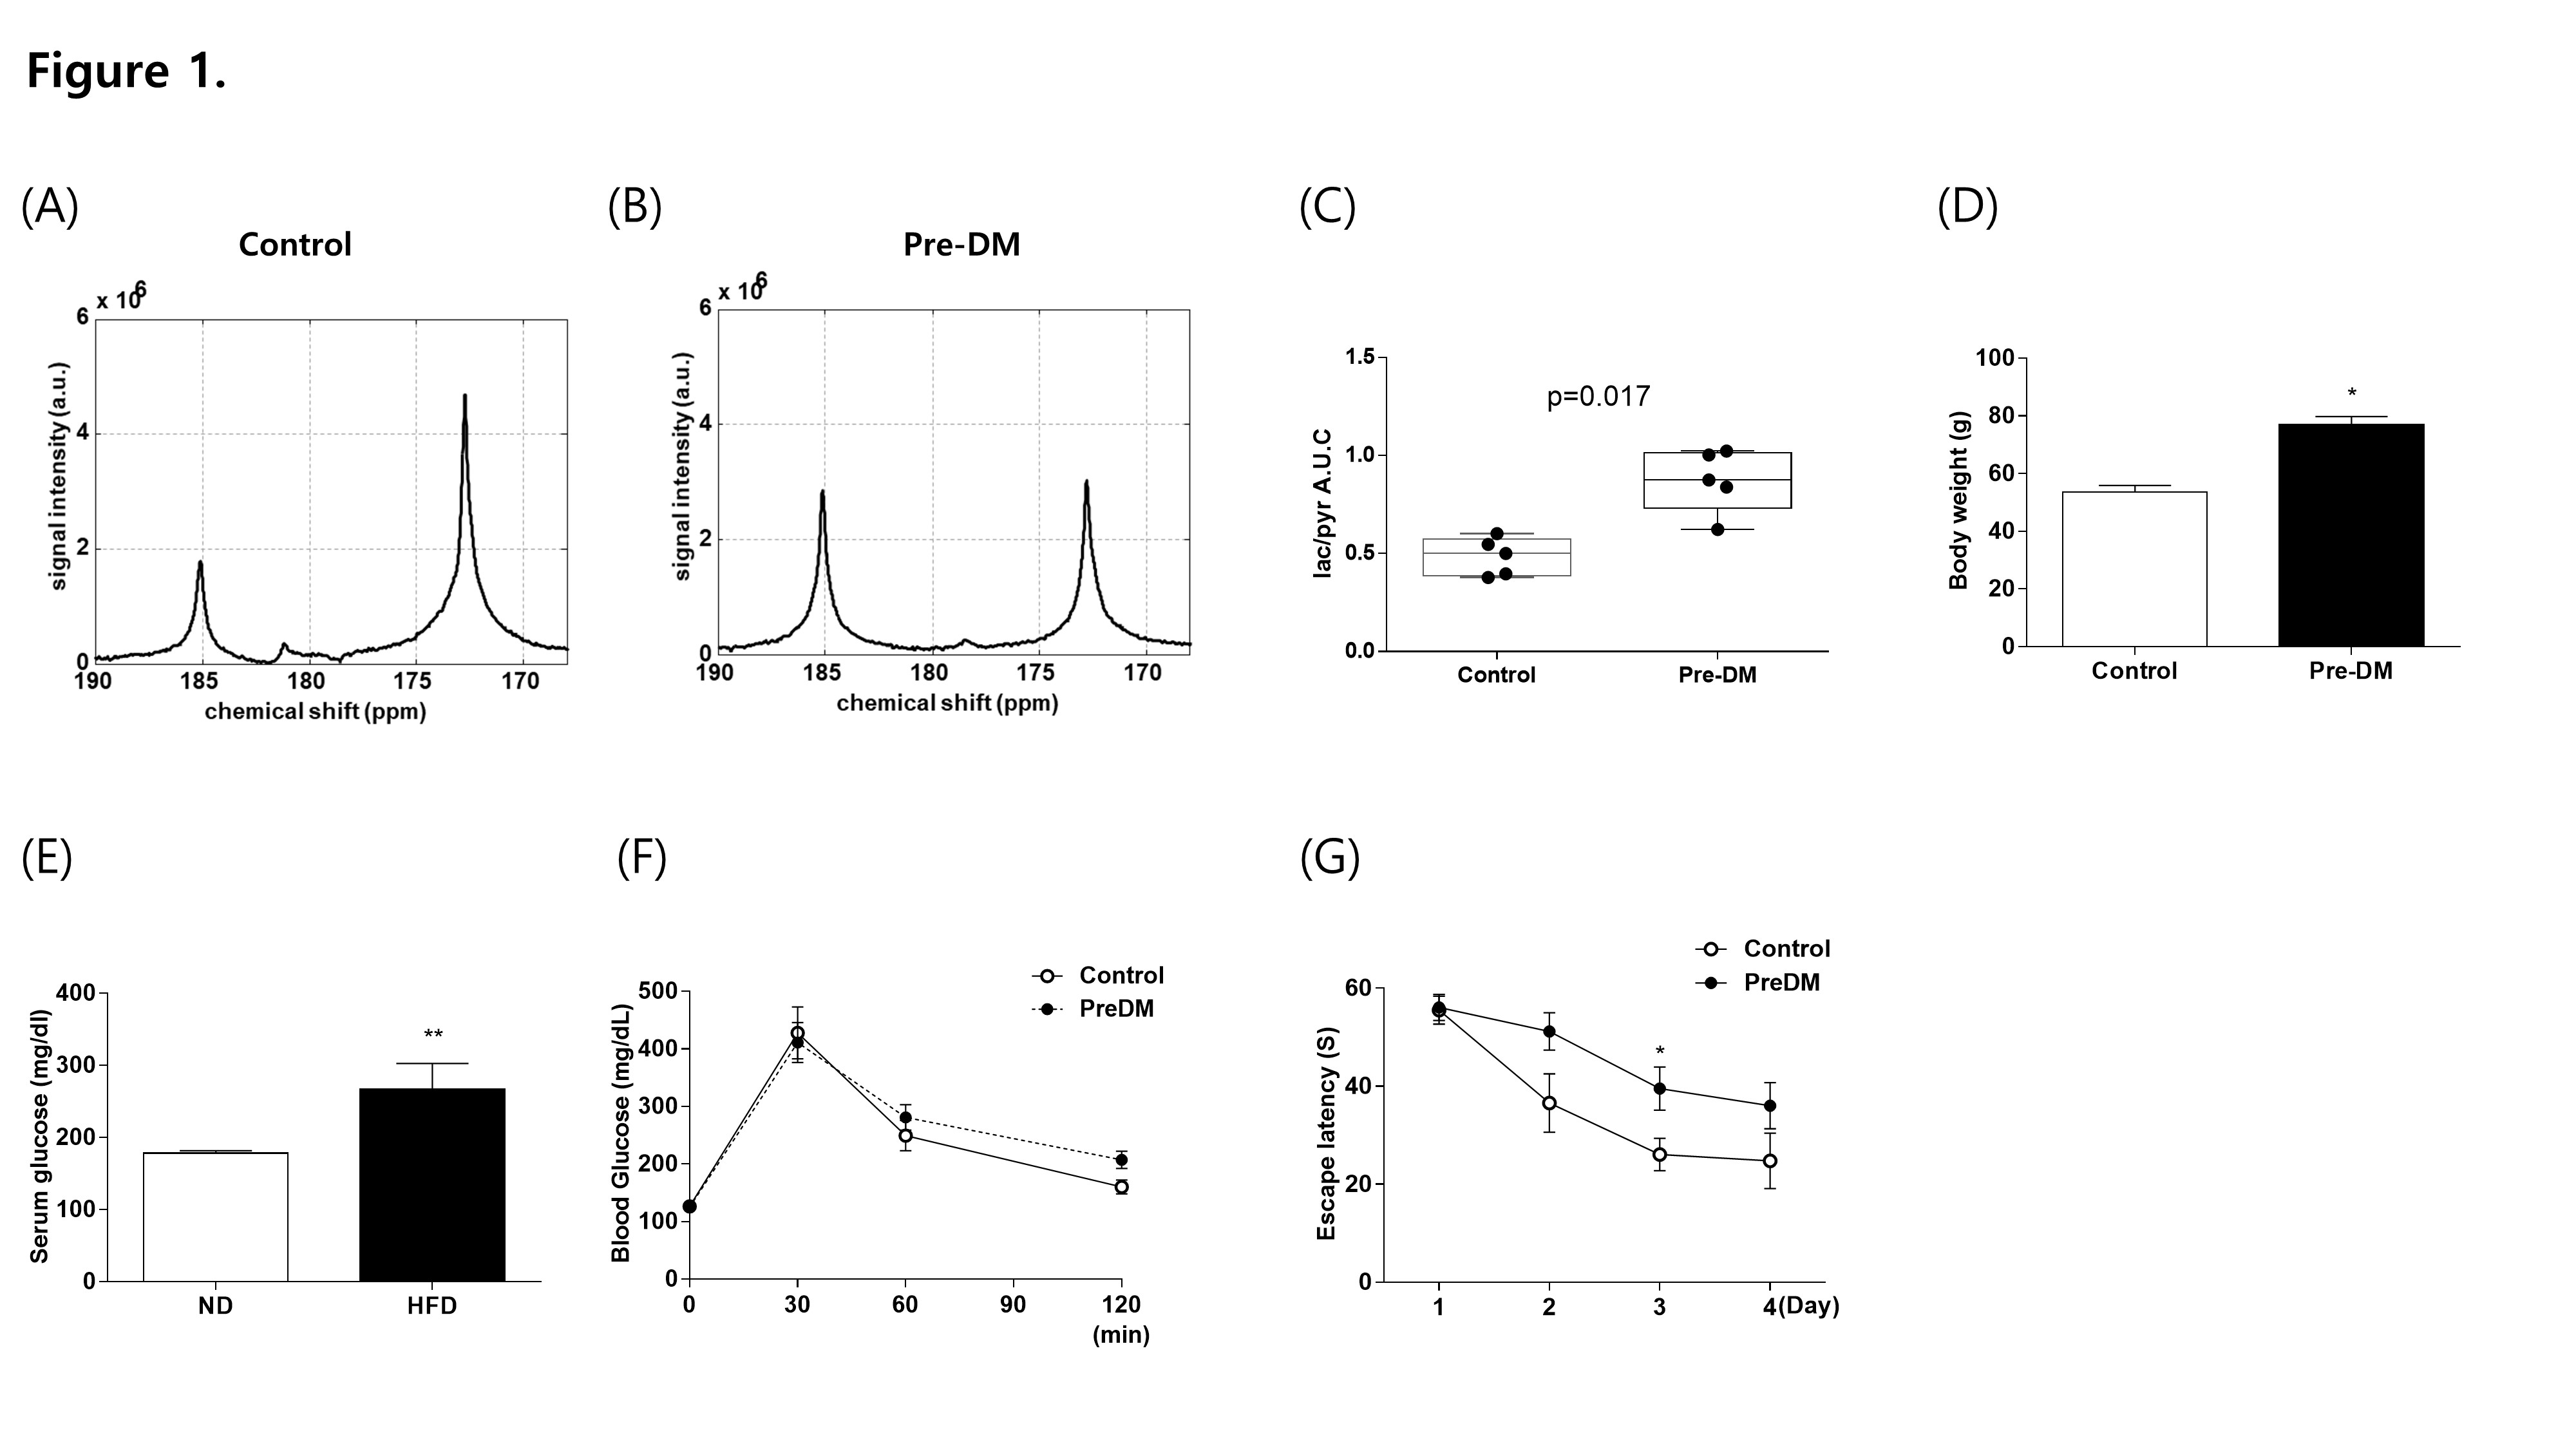
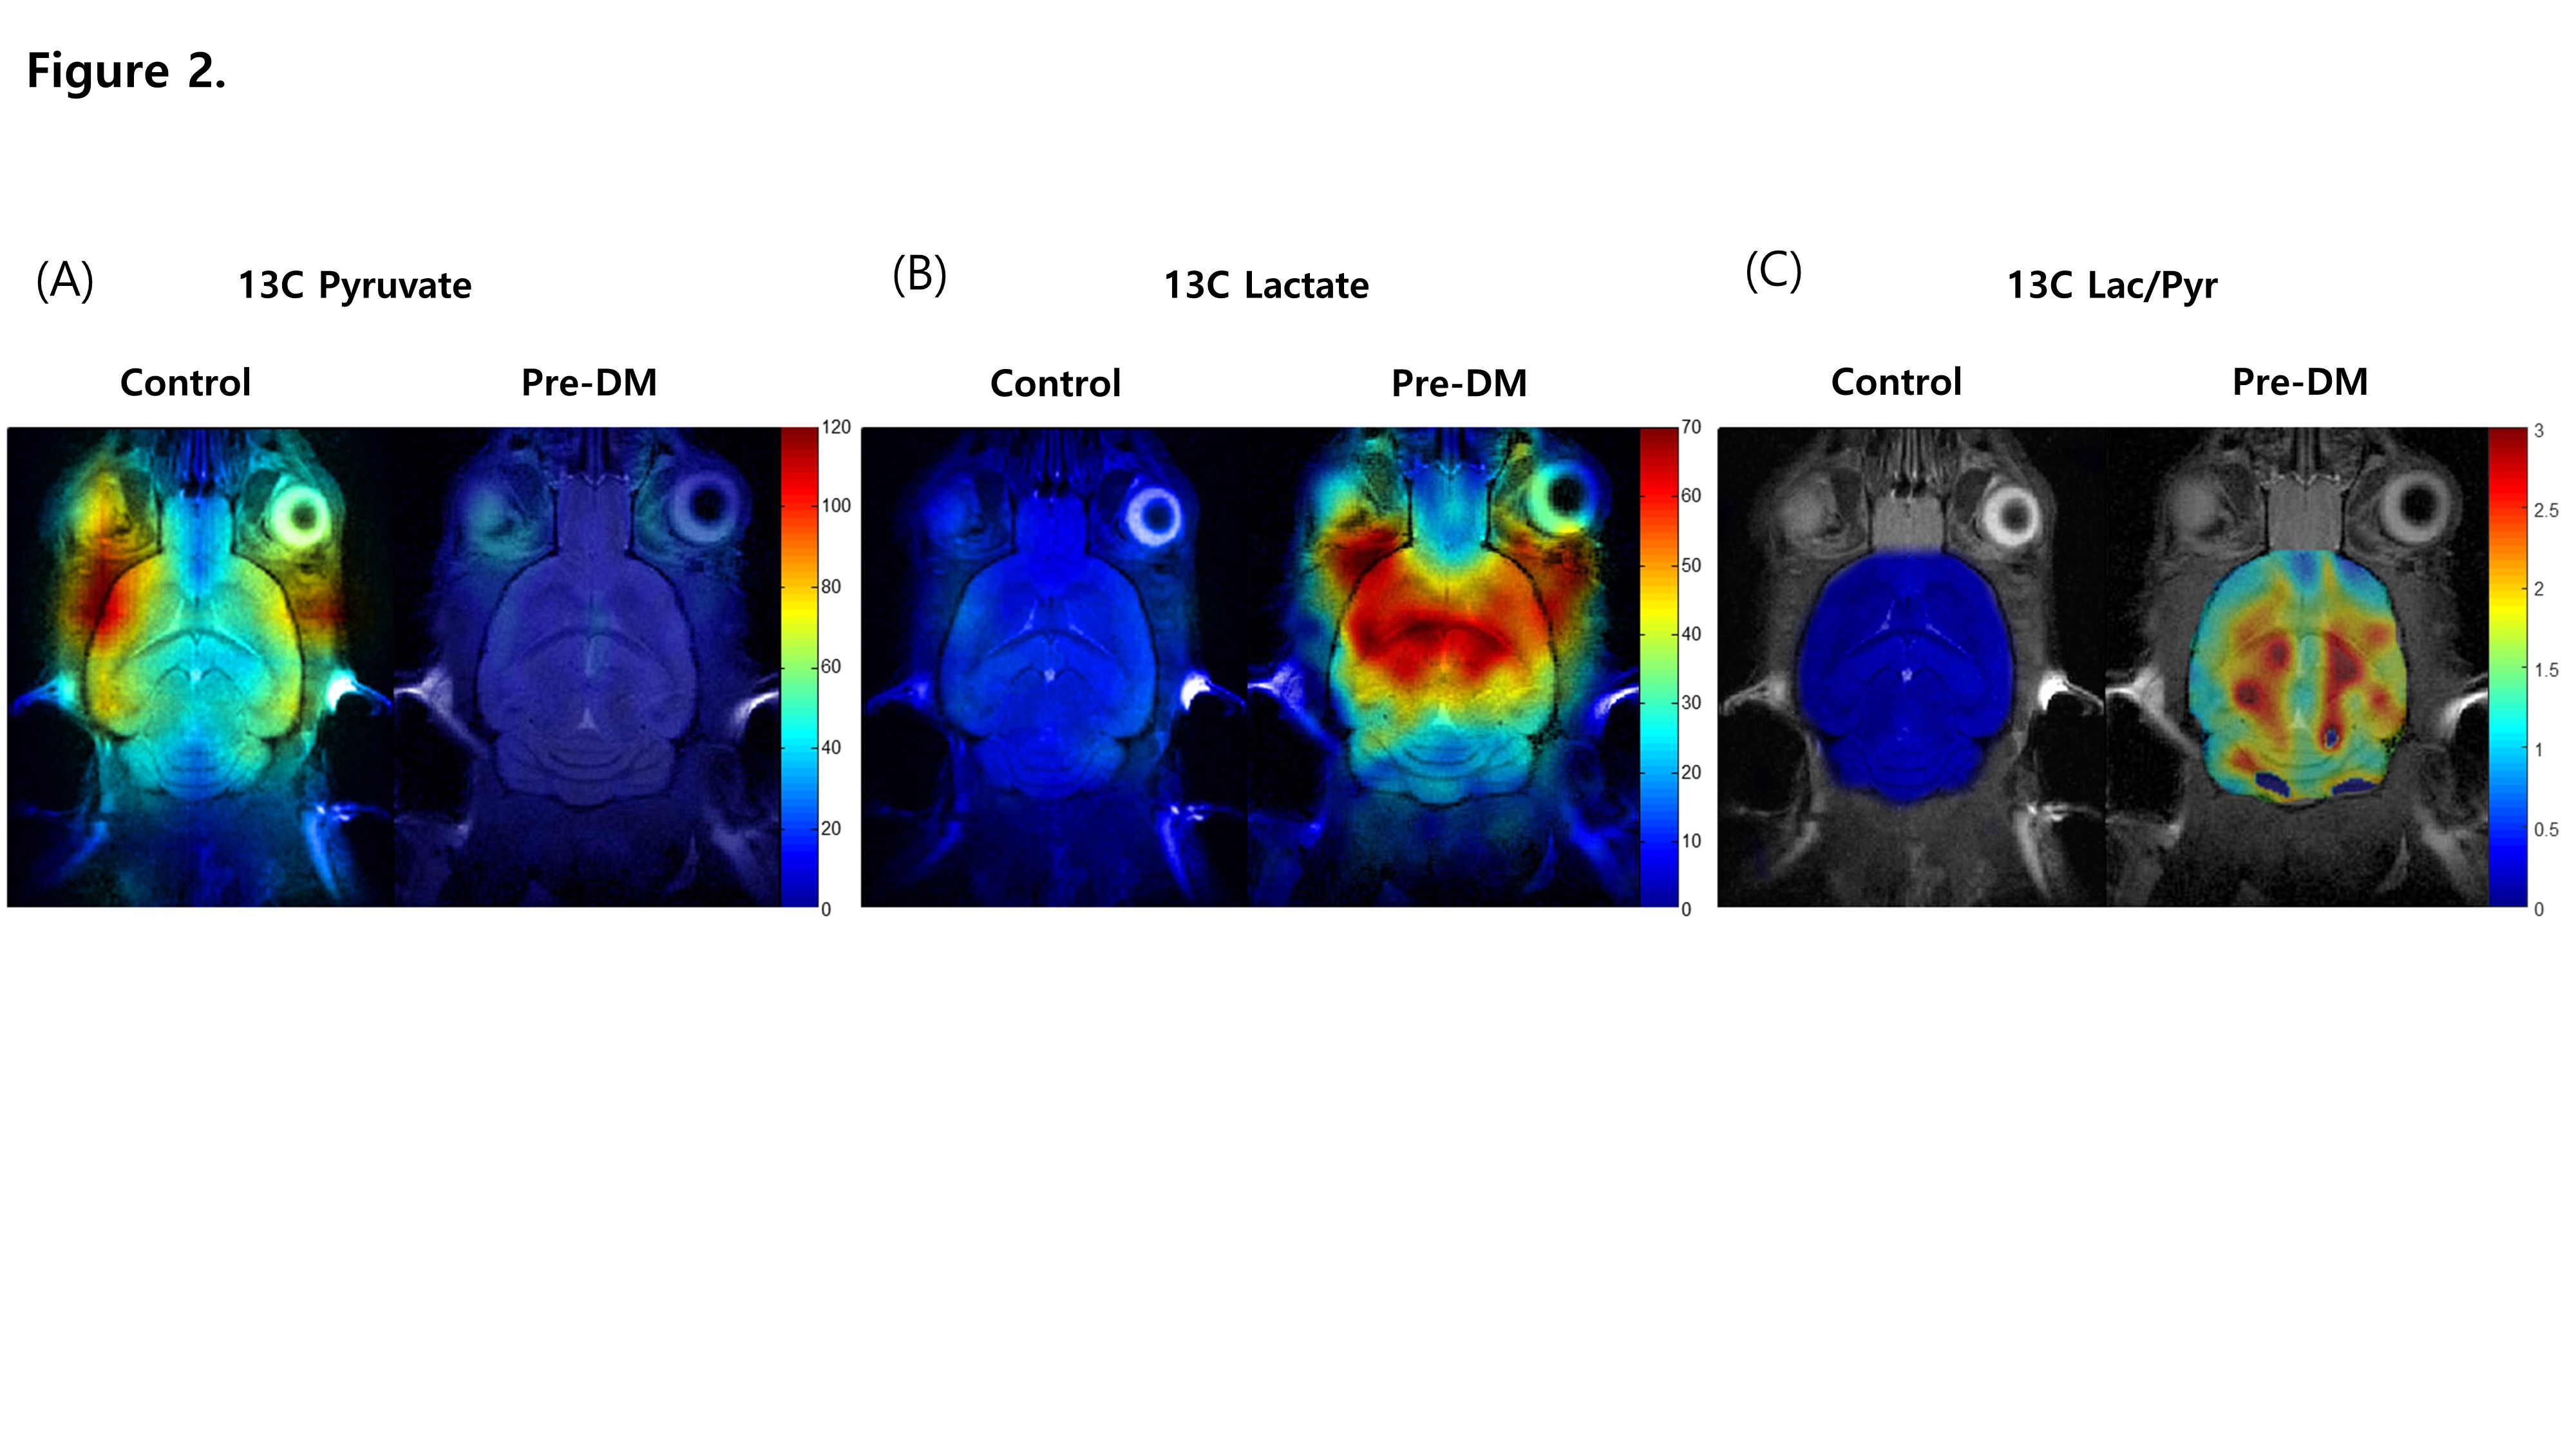
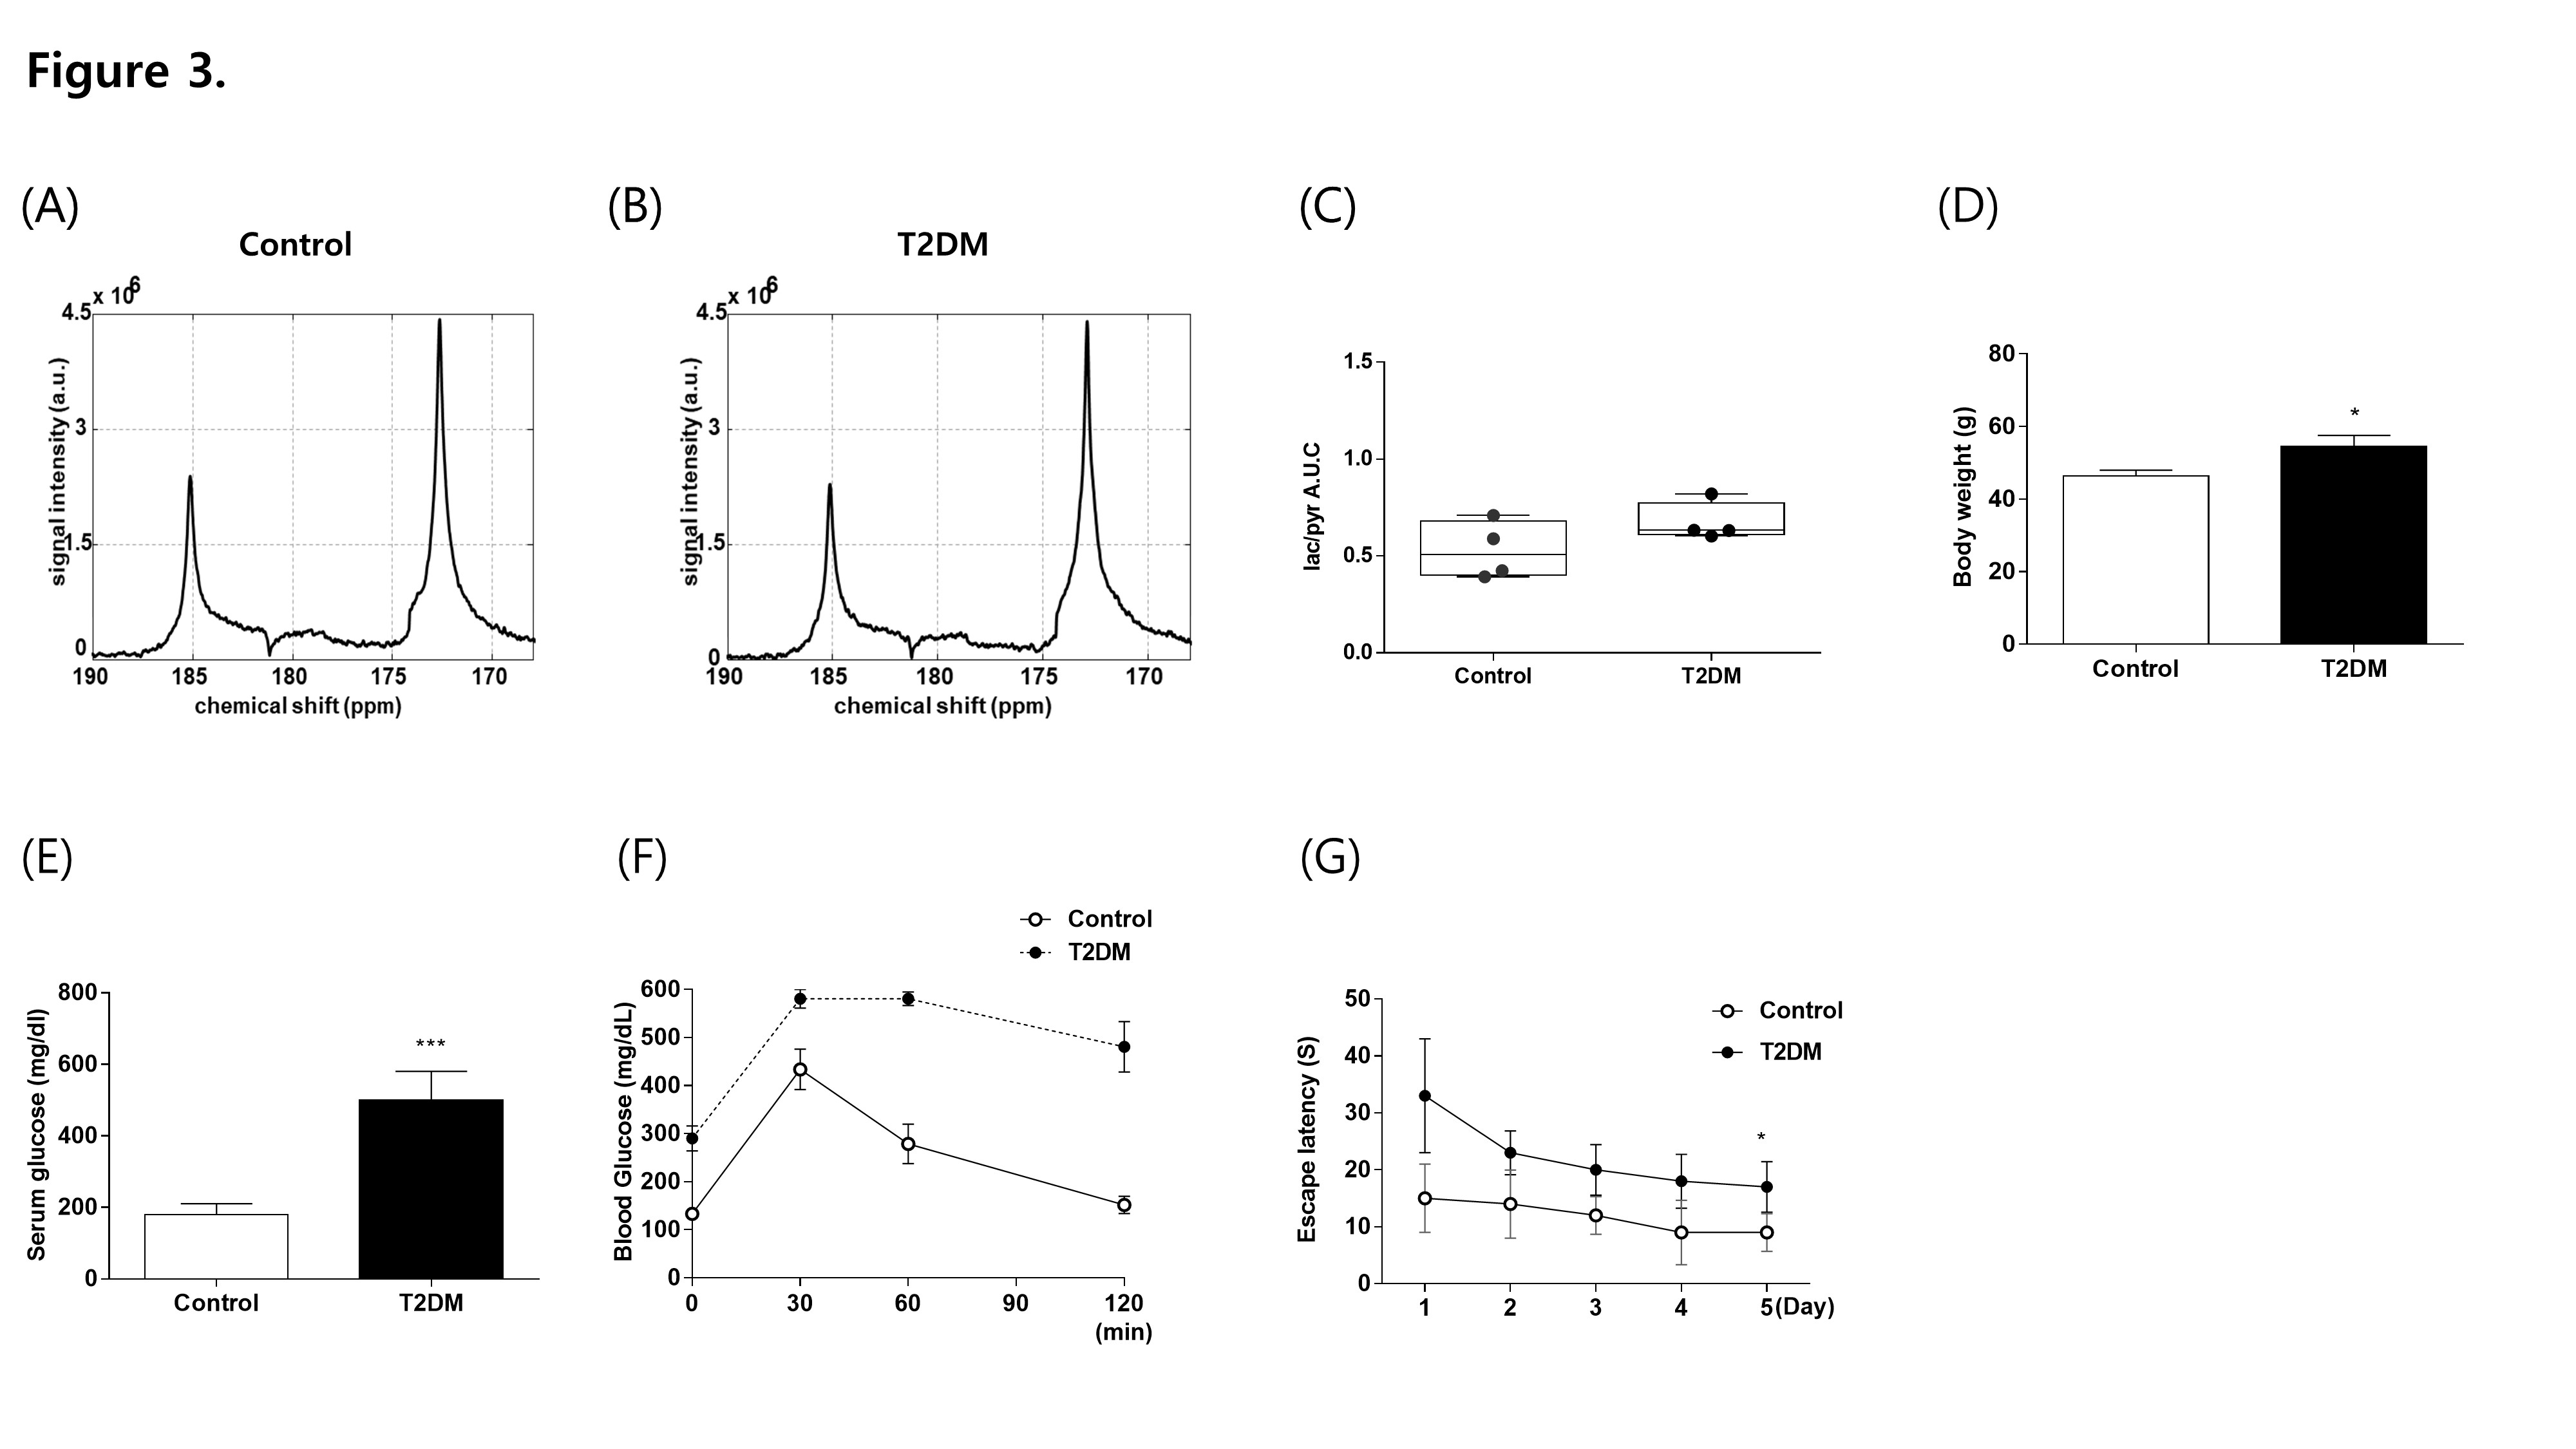
Pre-DM mice showed increased body weight (Fig1D), hyperglycemia (Fig1E), and a tendency of glucose intolerance (Fig1F). We detected hyperpolarized [1-13C]pyruvate at 173 p.p.m. and hyperpolarized [1-13C]lactate at 185 p.p.m from the brain (Fig1A, B). Pre-DM mice showed significantly higher [1-13C]lactate/[1-13C]pyruvate conversion ratio in the brain (p = 0.017) (Fig1C), and cognitive decline in water-maze behavior task (Fig1G). Hyperpolarized 13C CSI explored regional brain mapping of pyruvate and lactate signal in the brain (Fig2). The hyperpolarized [1-13C]pyruvate signal detected prominently from the veins in the retro-orbital pre-auricular area (Fig2A) in control mice, while hyperpolarized [1-13C]lactate signal mainly detected within the brain of Pre-DM mice (Fig2B). The highest [1-13C]lactate/pyruvate ratio visualized in the region containing hippocampus (Fig2C). Since hippocampus has been known to control the learning and memory of the brain, metabolic alteration in this area may induce a cognitive decline in pre-DM mice. Next, hyperpolarized [1-13C]pyruvate MRS was performed in the brain of T2DM to compare with Pre-DM. T2DM mice showed similar weight gain (Fig3D), but they showed very high fasting serum glucose level (Fig3E) and severely impaired glucose tolerance (Fig3F). It is quite impressive that conversion ratio of pyruvate to lactate in the brain of T2DM was not distinguished with control, even though T2DM showed impaired cognition in water-maze behavior test (Fig3G). Therefore, it needs to study further whether the result in T2DM indicates normal brain metabolism or accompany other metabolic alteration. This study suggests that glucose metabolism of the brain changes dynamically according to the stages of diabetes and it may represent a possibility that hyper-glucose metabolism is an early metabolic stress to induce cognitive decline.Conclusion
This study shows that hyperpolarized [1-13C]pyruvate MRS is a non-invasive imaging technique to trace dynamic brain glucose metabolism according to the stages of diabetes with excellent sensitivity. Although there is increasing clinical application of 18F FDG-PET to detect Alzheimer’s disease, limited to use it for the patients under 140mg/dl fasting serum glucose. Thus, hyperpolarized [1-13C]pyruvate MRS may be used to detect very early metabolic event inducing a cognitive decline in hyperglycemic patients.Acknowledgements
This research was supported by Basic Science Research Program through the National Research Foundation of Korea(NRF) funded by the Ministry of Education. (2017R1D1A1B03033431)References
1. Kryscio, R.J., et al., Adjusting for mortality when identifying risk factors for transitions to mild cognitive impairment and dementia. J Alzheimers Dis, 2013. 35(4): p. 823-32.
2. Ott, A., et al., Diabetes mellitus and the risk of dementia: The Rotterdam Study. Neurology, 1999. 53(9): p. 1937-42.
3. Ramlo-Halsted, B.A. and S.V. Edelman, The natural history of type 2 diabetes. Implications for clinical practice. Prim Care, 1999. 26(4): p. 771-89.
4. Day, S.E., et al., Detecting tumor response to treatment using hyperpolarized 13C magnetic resonance imaging and spectroscopy. Nat Med, 2007. 13(11): p. 1382-1387.
Figures