3691
Metabolic Interactions of Simultaneous 18F-FDG PET and Hyperpolarized 13C MRI1Department of Radiology, Stanford University School of Medicine, Stanford, CA, United States, 2Department of Neurology, Stanford University School of Medicine, Stanford, CA, United States
Synopsis
Simultaneous hyperpolarized 13C-pyruvate MRI and 18F-FDG PET imaging have the several potential applications, especially for understanding the complex metabolic processes of cancer. However, we hypothesized the relatively high concentrations of 13C-pyruvate used in hyperpolarized MRI could interfere with the 18F-FDG uptake when administrated simultaneously, because their metabolic products compete for the same pathways. In this study, we examined the effect of injected pyruvate and lactate on 18F-FDG uptake in healthy rats and in rats with implanted C6 gliomas, and discuss the metabolic interactions observed.
Background
Multimodality imaging has rapidly advanced in the last decade, and hyperpolarized 13C-pyruvate MRI and 18F-FDG PET imaging are two imaging techniques that both indirectly report on the cellular glucose metabolism. Combining the two techniques may provide better insight on the metabolic processes that drives diseases such as cancer. However, we hypothesized the relatively high concentrations of pyruvate used in hyperpolarized MRI could interfere with the 18F-FDG uptake when administrated simultaneously, because their metabolic products compete for the same pathways (1,2). In this study, we examined the effect of injected pyruvate and lactate on 18F-FDG uptake in healthy rats and in rats with implanted C6 gliomas.Methods
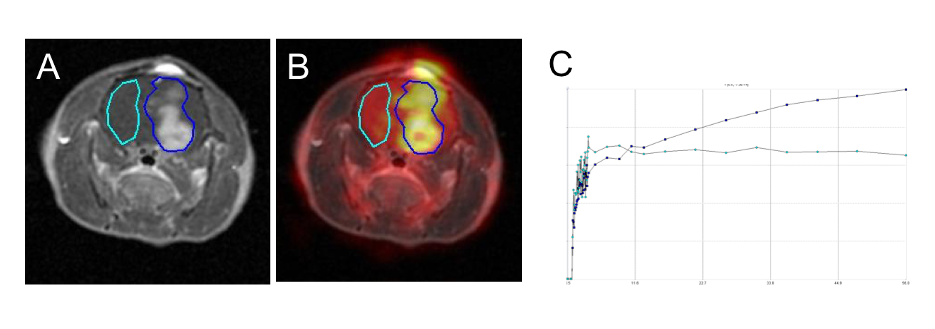
Healthy male Wistar rats (300-400g) were anesthetized with Isoflurane (1.8%-2% in 02) and placed in a Siemens Inveon D-PET, microPET scanner (Siemens Medical Solutions USA, Inc., Knoxville, TN). Pyruvate (125mM in 2 ml, n=5), lactate (125mM in 2 ml, n=4) or saline (2 ml, n=4) was injected as a bolus via a tail vein catheter followed immediately by injection of 1-mCi 18F-FDG (diluted in saline to 0.9ml) and 1 hour of dynamic PET acquisition. A second study of healthy rats (n=5) was performed using a lactate infusion (100 mmol/Kg/min, 20 min before the PET scan and during the entire scan) instead of the bolus injection protocol. A third study using the lactate infusion protocol was then performed in rats implanted with C6 gliomas (n=4, 200-250g, scanned 10-11 days after C6 implantation). The C6 rats underwent a 3T gadolinium-enhanced T1-weighted MRI scan (GE 3T Signa PET/MR scanner) the day before PET imaging. All rats were fasted for 18-20 hours prior to 18F-FDG injection. The dynamic PET data was reconstructed in 5-s frames (0-3min), in 1-min frames (3-10) and in 10-min frames (20-60min) using a fully 3D TF iterative ordered subsets expectation maximization (OSEM) algorithm. For the C6 animals, hyper-intense regions of contrast-enhanced T1-weighted MRI were used for co-registration of MR and PET images and for identifying the tumor region of interest (ROI). Visualization of radiotracer uptake, co-registration, ROI identification, and analysis of signal differences were performed using the FuseIt tool in PMOD (Version 3.7, PMOD Technologies, Zürich, Switzerland) (Fig. 1). Tumor and tissue TACs were normalized to injected dose, and expressed as %ID/g, assuming 1g/ml. The normalized uptake of radiotracer at 60 min was used for comparison between groups and in the tumor ROIs in contrast to the contralateral normal-appearing brain ROIs.Results
Healthy rats receiving a bolus injection of either pyruvate or lactate showed no significant effect on 18F-FDG uptake (p=0.12 and p=0.86 respectively, Fig. 2A and 2B), whereas lactate infusion resulted in a markedly decreased 18F-FDG signal (-31%, p=0.003, Fig. 2C). For the C6 animals, an expected increased FDG uptake were observed in the tumor versus the contralateral ROI in the saline infused animals (+28%, p=0.03). In contrast, infusion of lactate decreased the 18F-FDG uptake by 24% (p=0.007) in the healthy regions of the brain but only by 14% (non significant p=0.087) in the tumor, resulting in increased tumor/healthy brain 18F-FDG contrast (+15%) in the lactate infused animals (Fig. 2D).Discussion/Conclusion
It is well known that pyruvate, rapidly converted to intracellular lactate when present in excessive amounts, competes with glucose as a substrate for cerebral energy metabolism, and previous studies have shown that exogenous lactate affects brain 18F-FDG uptake (1,2). The affect is attributed to glucose-6-phosphate accumulation leading to product inhibition of hexokinase. This study showed that lactate infusion, which results in a greater overall dose as compared to bolus injections, could have a measurable effect on any simultaneous 18F-FDG PET study. Furthermore, a differential effect between normal brain and tumor, as seen here, may be ascribed to tumor tissue having predominately hexokinase-2, which is not subject to product inhibition (3). However, for the typical bolus doses used in in vivo hyperpolarized 13C pyruvate and 13C lactate studies, the effect on 18F-FDG uptake in rat brain was not significant. We do note that several sequential injections could potentially have an inhibitory effect as seen with the lactate infusion protocol used in this study.Acknowledgements
NIH grants R01CA176836, R01EB019018, P41EB01589, S10OD012283, S10OD018130, GE Healthcare and the Lucas Foundation.References
1) Smith D, Pernet A, Hallett WA, Bingham E, Marsden PK, Amiel SA. Lactate: a preferred fuel for human brain metabolism in vivo. J Cereb Blood Flow Metab. 2003;23:658–664.
2) Murata T, Waki A, Omata N, et al. Dynamic changes in glucose metabolism by lactate loading as revealed by a positron autoradiography technique using rat living brain slices. Neurosci Lett. 1998;249:155–158.
3) Mathupala SP, Ko YH, Pedersen PL. Hexokinase-2 bound to mitochondria: cancer's stygian link to the ‘Warburg Effect’ and a pivotal target for effective therapy. Semin Cancer Biol. 2009;19:17–24.
Figures