3690
Robust MR-based attenuation correction for PET near metal implants1Stanford University, Stanford, CA, United States, 2Applied Science Lab, GE Healthcare, Menlo Park, CA, United States
Synopsis
In simultaneous PET/MRI, the reconstruction of PET image uses an MRI-based attenuation coefficient (AC) map for accurate quantization of radiotracer activity. The AC map is typically derived from SPGR images, but these are severely distorted near metallic implants due to strong off-resonance artifacts. We investigated the influence of the metal artifacts in the MR-based AC map upon the PET image accuracy. To correct the metal artifacts in PET, we present the use of multi-spectral imaging with field-map-based determination of meta boundary and type. Our correction result mitigated the signal underestimation near metal in PET images from 50% to 8%.
Introduction
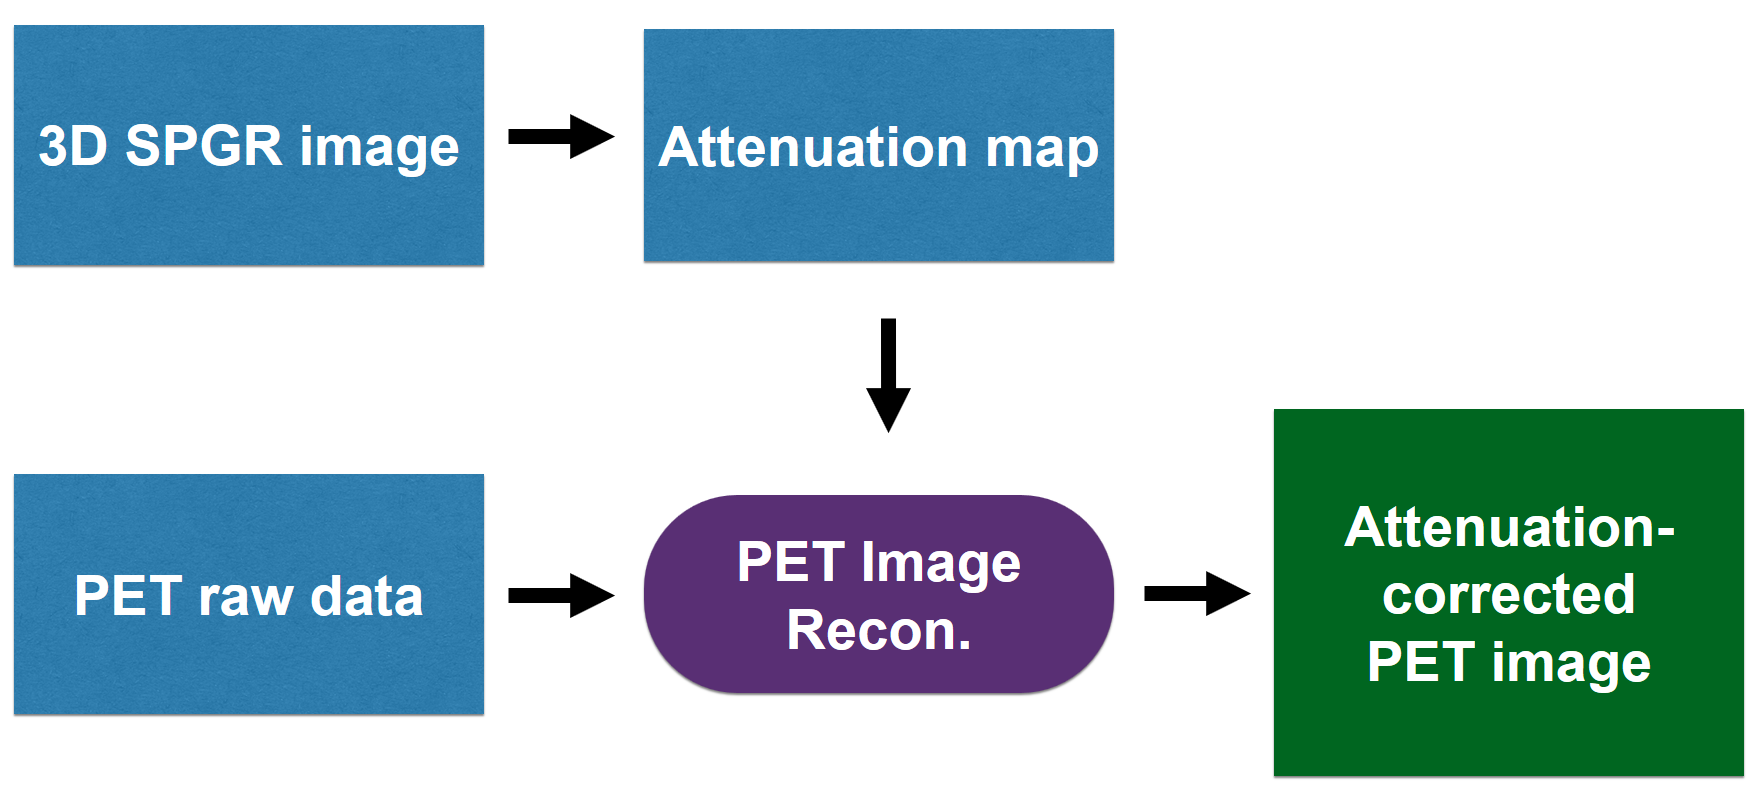
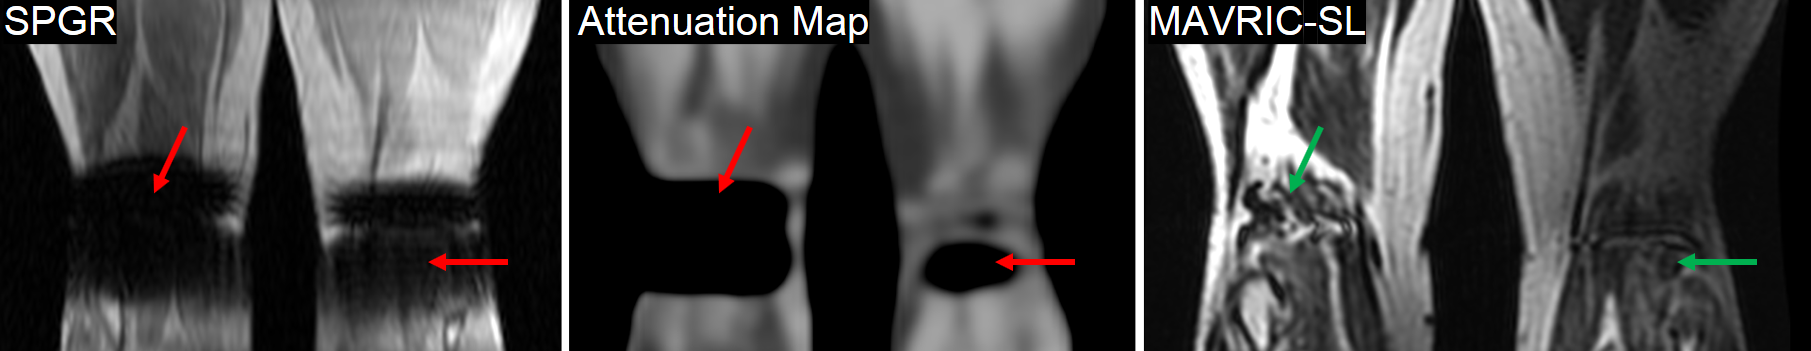
Simultaneous PET/MRI enables quantitative evaluation of the tissue metabolism (PET) co-registered with high-resolution anatomy (MRI). For accurate quantification of radioactivity with PET, correction of signal attenuation through layers of different tissues is important. In PET/MRI, this is performed by 1) acquiring 3D SPGR images with MRI, 2) forming a map of attenuation coefficients (AC) exploiting tissue types identified with SPGR images, and 3) using the AC map in the PET image reconstruction1 as shown in Figure 1. Unfortunately, the heavy signal loss artifacts in SPGR images near metallic implants can generate an erroneous AC map2,3 that, for example, assigns the AC of air to the area of metal (Figure 2). Here, we present a phantom study to investigate the propagation of metal artifacts from the MRI-based AC map to the PET image. We also propose a novel AC mapping method using MAVRIC-SL, a multi-spectral sequence designed for metal artifact correction, for detection of metal boundary and type to correct metal artifacts in the final PET image.Methods
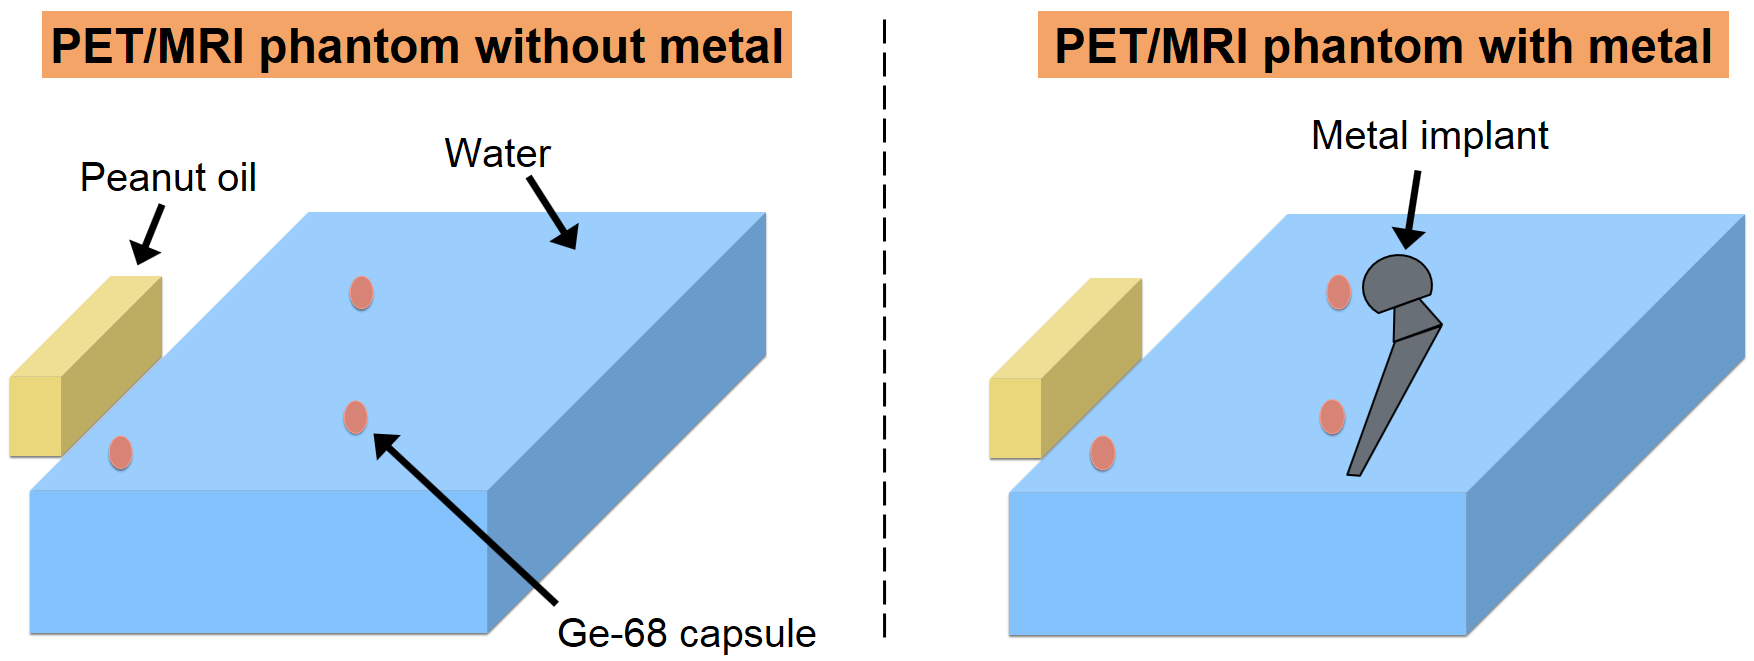
We built a phantom to generate signals for both PET and MRI. A plastic container was filled with distilled water, with a bridge of electrical tape in the middle upon which to place a metallic hip implant. Three small capsules of Germanium-68 (Ge-68, 2.17 uCi) were also placed on the bridge as signal sources for PET as shown in Figure 3. A 6-minute PET/MRI session was performed twice to image the phantom with and without the implant, respectively. The imaging experiment was performed on a 3T GE PET/MRI scanner (SIGNA PET/MR, GE Healthcare, Waukesha, WI, USA). Aside from the conventional SPGR scan, the coronal MAVRIC-SL scan was additionally performed when the metallic implant was included in the phantom. The region of the metallic implant in MAVRIC-SL images was manually segmented based on lower signal magnitude and the dipole signal-loss pattern near metal. A quantitative susceptibility mapping method using MAVRIC-SL4 was employed to determine the metal type. A linear AC for the metal type was estimated using values from previous literature5-8. The PET image of the phantom without the metal was set as the reference. The PET images reconstructed with the AC map from SPGR images with metal artifacts and those with the AC map from MAVRIC-SL images were compared with the reference PET images.Results
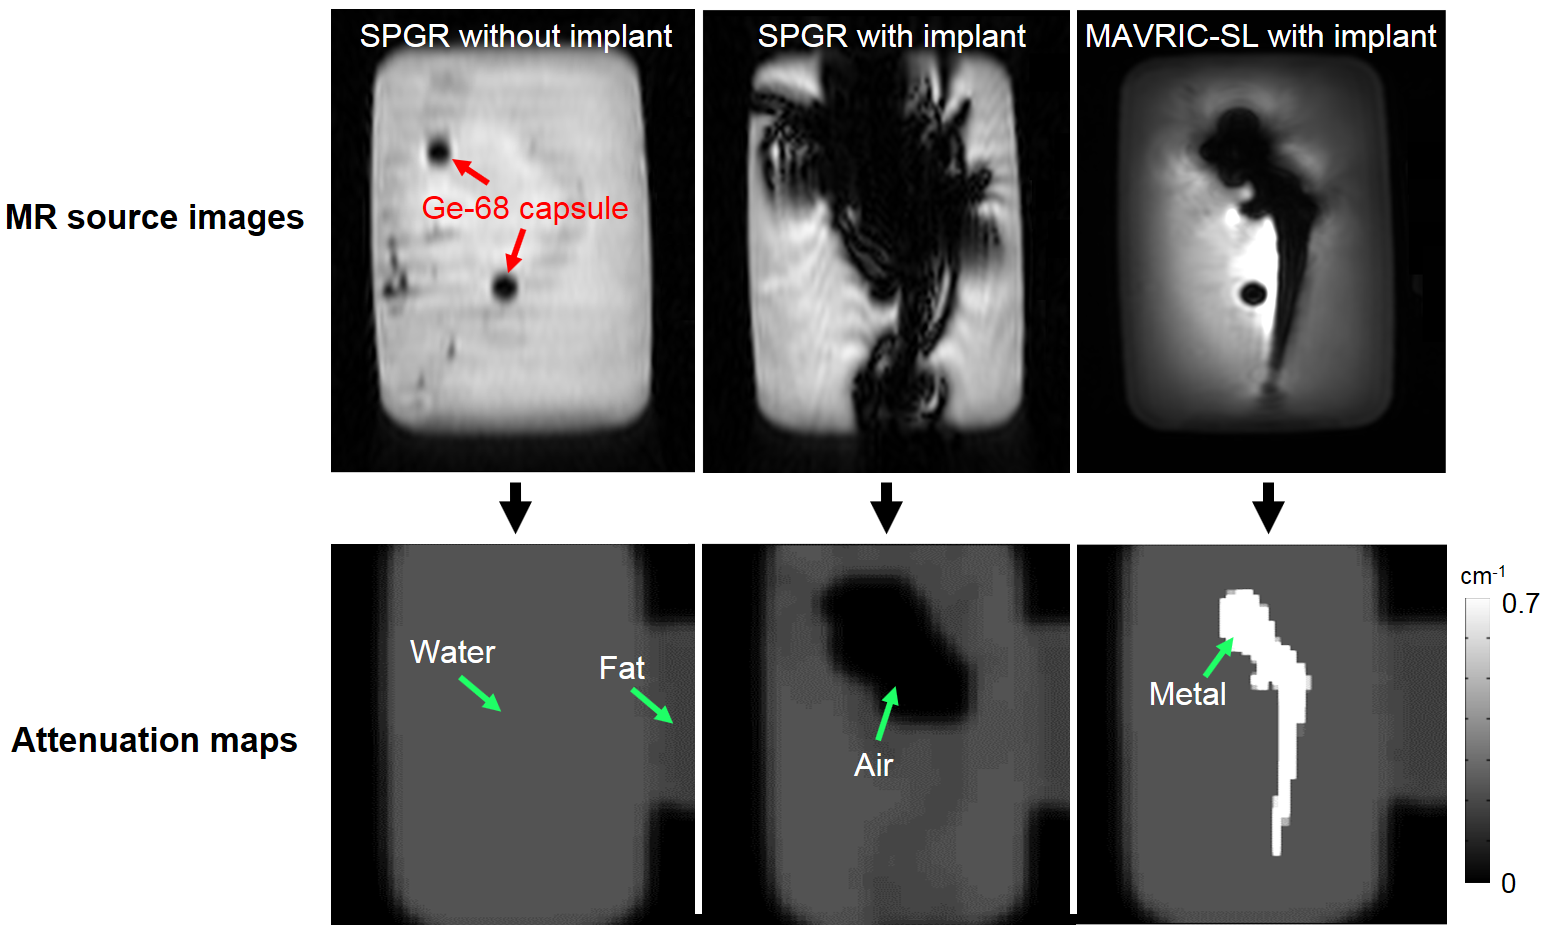
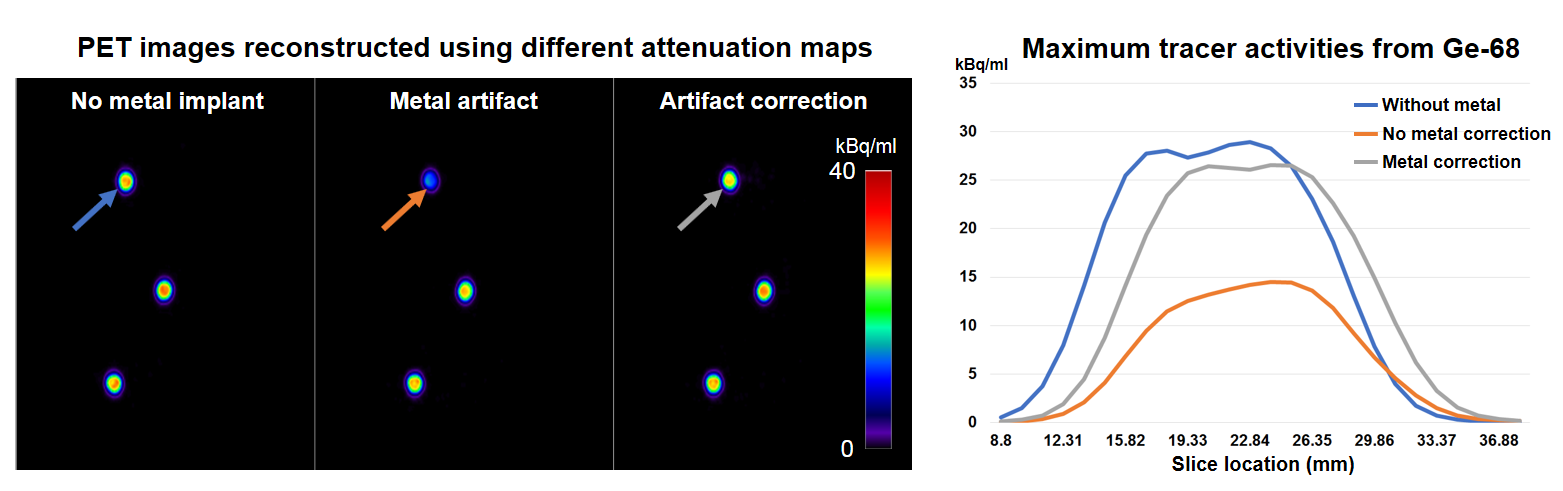
MR source images and the resulting AC maps are presented in Figure 4. Compared to the images without the implant (left column), the MR images with the metallic implant (middle column) show significant signal loss. This consequently led to the assignment of the wrong AC value (air, close to 0 cm-1) to the area of water (AC ≈ 0.1 cm-1) and the metal (AC from 0.3 to 0.7 cm-1 for metal types frequently used for implants). The right column shows the MAVRIC-SL image and the resulting AC map. The estimated susceptibility of the metal was 780 ppm, and the closest metal type was cobalt-chromium (~900 ppm), for which the AC value was set to be 0.7 cm-1 as in [7]. Figure 5 compares the resulting PET images from different attenuation maps. The maximum tracer activity of the Ge-68 capsule near the head of the implant was most severely underestimated by 50% in the PET image (28.95 kBq/ml to 14.48 kBq/ml). However, the underestimation is considerably reduced to just 8% in the PET image using correction with MAVRIC-SL (28.95 kBq/ml vs 26.57 kBq/ml). The signal profile plot along different slice locations demonstrates significant underestimation correction with MAVRIC-SL compared to the conventional method.Discussion
Misclassification of the soft-tissues and metal as air in the attenuation map due to severe signal loss near metal in the MR source images causes insufficient attenuation correction. This led to the significant signal underestimation in the reconstructed PET image (50% reduction) in our experiment. Our metal estimation approach with MAVRIC-SL demonstrated potential for correcting this underestimation problem with accurate identification of metal boundary and type. PET/MRI for patients with metal implants usually includes MAVRIC-SL for anatomic imaging near implants, so the attenuation map acquisition with MAVRIC-SL is not likely to increase the total scan time. For our method to be more practical, further differentiation of the soft-tissue types into water and fat, and automation of the metal segmentation should be developed.Conclusion
In this research, we demonstrated the severe signal underestimation of PET images in PET/MRI near metal. Our approach with MAVRIC-SL for the AC map generation showed encouraging results in the metal artifact correction by accurate metal segmentation and metal type specificationAcknowledgements
NIH R01 EB017739, GE Healthcare.References
1. G. Wagenknecht, H. Kaiser, F. M. Mottaghy, and H. Herzog. MRI for attenuation correction in PET: methods and challenges. Magn. Reson. Mater. Phy, 26:99-113, 2013.
2. C. N. Ladefoged, F. L. Anderson, S. H. Keller, J. Löfgren, A. E. Hansen, S. Holm, L. Højgaard, and T. Beyer. PET/MR imaging of the pelvis in the presence of endoprostheses: reducing image artifacts and increasing accuracy through inpainting. Eur. J. Nucl. Med. Mol. Imaging, 40:594-601, 2013.
3. I. A. Burger, M. C. Wurnig, A. S. Becker, D. Kenkel, G. Delso, P. Veit-Haibach, and A. Boss. Hybrid PET/MR Imaging: An Algorithm to Reduce Metal Artifacts from Dental Implants in Dixon-Based Attenuation Map Generation Using a Multiacquisition Variable-Resonance Image Combination Sequence. J. Nucl. Med, 56:93-97, 2015.
4. X. Shi, D. Yoon, K. M. Koch, and B. A. Hargreaves. Metallic implant geometry and susceptibility estimation using multispectral B0 field maps. Magn. Reson. Med, 77(6):2402-2413, 2017.
5. C. Reft, R. Alecu, I. J. Das, B. J. Gerbi, P. Keall, E. Lief, B. J. Mijnheer, N. Papanikolaou, C. Sibata, J. Van Dyk, and AAPM Radiation Therapy Committee Task Group 63. Dosimetric considerations for patients with HIP prostheses undergoing pelvic irradiation. Report of the AAPM Radiation Therapy Committee Task Group 63. Med. Phys, 30(6):1162-82, 2003.
6. M.J. Berger, J.H. Hubbell, S.M. Seltzer, J. Chang, J.S. Coursey, R. Sukumar, D.S. Zucker, and K. Olsen. XCOM: Photon Cross Sections Database. https://www.nist.gov/pml/xcom-photon-cross-sections-database.
7. R. Harnish, S. Prevrhal, A. Alavi, H. Zaidi, and T. F. Lang. The effect of metal artefact reduction on CT-based attenuation correction for PET imaging in the vicinity of metallic hip implants: a phantom study. Ann Nucl Med, 28(6):540-50, 2014.
8. V. P. Singh, and N. M. Badiger. Study of mass attenuation coefficients, effective atomic numbers and electron densities of carbon steel and stainless steels. Radioprotection, 48:431-443, 2013.
Figures