3689
Quantification of Oxygen Metabolism in Human Brain: Comparison of Direct 17O with Indirect 1H MR Method1Department of Radiology, Medical Physics, Medical Center – University of Freiburg, Freiburg, Germany, 2Department of Neuroradiology, University Medical Center Hamburg-Eppendorf, Hamburg, Germany, 3Department of Radiology, Athinoula A. Martinos Center for Biomedical Imaging, Massachusetts General Hospital, Charlestown, MA, United States, 4German Consortium for Translational Cancer Research Freiburg Site, German Cancer Research Center (DKFZ), Heidelberg, Germany
Synopsis
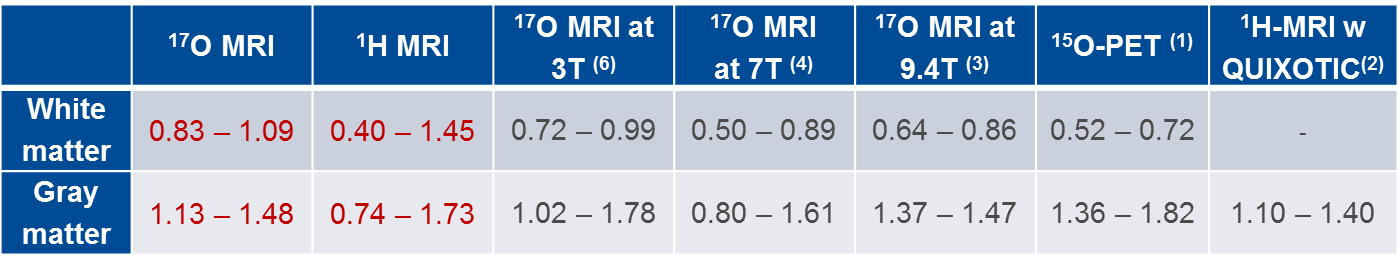
In this study, quantification of the cerebral metabolic rate of oxygen consumption (CMRO2) in human brain using direct dynamic 17O-MRI with inhalation of 17O gas was compared to indirect 1H-MRI using QUantitative Imaging of eXtraction of Oxygen and TIssue Consumption (QUIXOTIC) method. The CMRO2 results of both methods are in a good agreement with 15O-PET studies (17O-MRI: 0.83–1.09/1.13–1.48 µmol/gtissue/min in WM/GM regions; 1H-MRI: 0.40–1.45/0.74–1.73 µmol/gtissue/min in WM/GM regions). QUIXOTIC offers smaller pixels which also results in a higher variation of CMRO2 values, whereas MRI with the intracellular tracer 17O provides averaged values with less variation due to the lower spatial resolution.
Introduction
The cerebral metabolic rate of oxygen consumption (CMRO2) is a useful biomarker of oxygen metabolism, which can be altered in diseased tissues such as brain tumors. CMRO2 can be measured with nuclear medicine (15O-PET) (1), indirect 1H-MRI (2) or by direct 17O-MRI with administration of 17O-enriched gas (3–7). Recently, we applied the method of profile likelihood analysis to demonstrate that reliable measurements of CMRO2 are possible with 17O-MRI at 3T, and we proposed a flexible pharmacokinetic model for CMRO2 quantification (6). The purpose of this study is to compare 17O-MRI with 1H-MRI, which is based on Quantitative Imaging of eXtraction of Oxygen and Tissue Consumption (QUIXOTIC) method for mapping of oxygen extraction fraction (OEF), to evaluate these methods in terms of providing clinically relevant information.Material and Methods
A dynamic 4D 17O MRI data set of a male volunteer (25 years) was acquired at a clinical 3T MRI system (Magnetom TIM Trio, Siemens AG, Erlangen, Germany) with a custom-built Tx/Rx 17O quadrature head coil. A 3D ultrashort‑TE radial sequence was used with the following parameters: TRF=0.8ms; TR=8.0ms; TE=0.52ms; BW=180Hz/pixel; TR=8.0ms; spatial/temporal resolution 10mm/1min; 7500 projections with 128 sampling points per projection; in total, 45 3D data sets were acquired in 45 min.
The imaging experiment was divided into a baseline phase (9.83min), wherein the natural abundance 17O MR signal was acquired, followed by two phases with a closed gas rebreathing (RB) system: the 17O‑phase (6.33min), during which 4.5L of 70%-enriched 17O gas (NUKEM Isotopes GmbH, Alzenau, Germany) was delivered in 50 ml pulses, and a subsequent 16O‑phase phase (2min), during which the volunteer was breathing the gas stored in the RB system (which contains the exhaled 17O gas that is then reused to increase the 17O MR signal) and 1.5L of fresh 16O gas was delivered. In the final washout phase (26.45min) the volunteer was breathing room air.
For CMRO2 quantification with 1H-MRI, OEF maps were obtained using QUIXOTIC method (2) (voxel size 3.9×3.9×10mm3, 10 control and 10 tag images, 2.10min per slice) and cerebrospinal fluid (CBF) maps using pulsed arterial spin labelling (PASL) approach with the 3D GRASE readout (voxel size 1.7×1.7×4mm3). For OEF calculation, a robust R2 fitting method was used (8), where the spatial difference of the fitted R2 magnetization decay of 3×3 nearest neighboring voxels was taken into account.
Results and Discussion
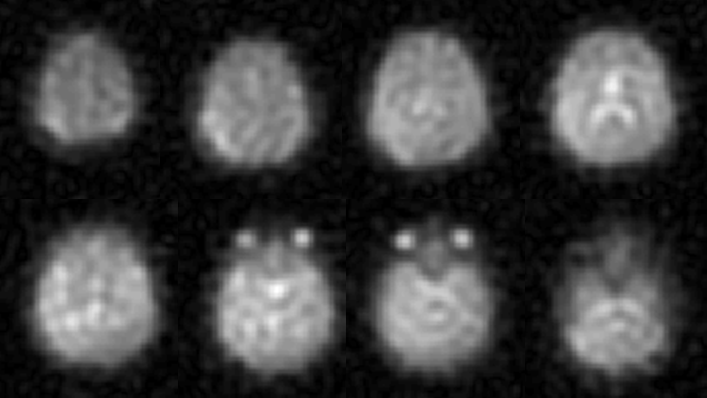
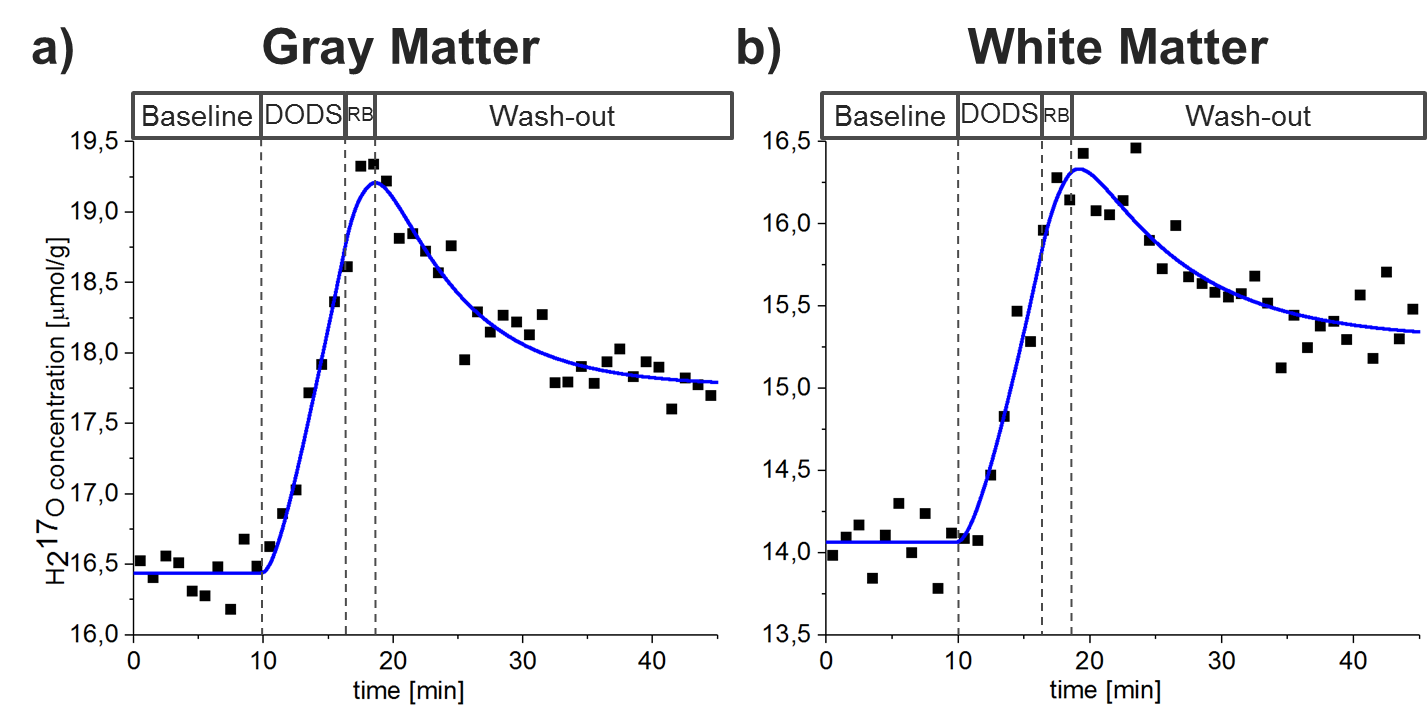
In time-averaged 17O MR images, the regions with high water content (e.g., eyes and ventricles) can be clearly identified (Fig.1).16O and 17O gas administration allowed more efficient gas handling and improved patient comfort. In Fig.2 the modified pharmacokinetic model for CMRO2 quantification (6), which incorporates the effect of 16O and 17O gas administration, is shown.
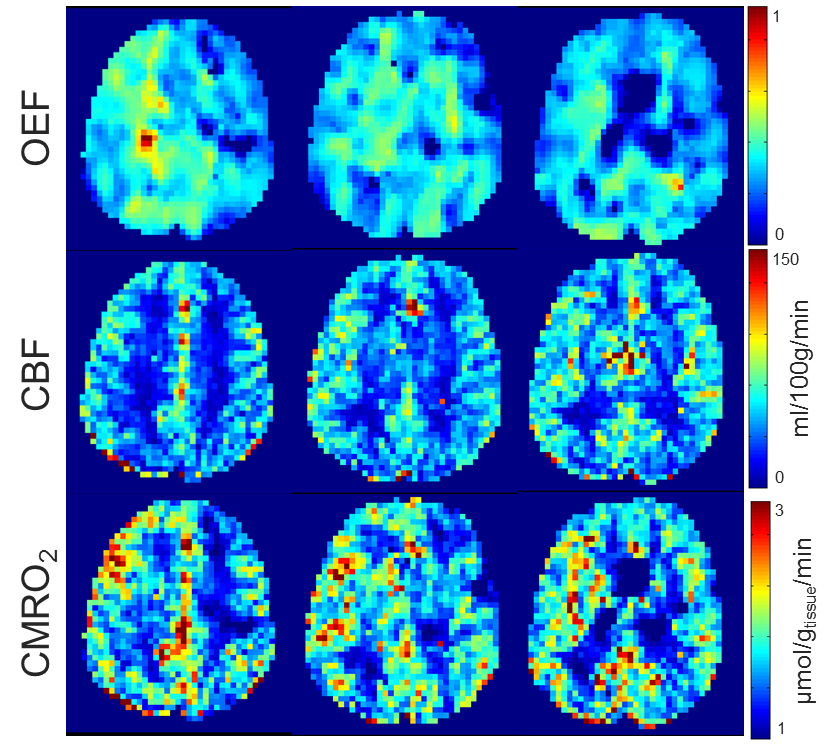
Figure 3 shows the OEF, the CBF, and the calculated CMRO2 maps. Maps are not smooth within single-tissue-regions and show high deviations of the averaged values in WM and WM regions (Tab.1). CMRO2 maps of similar quality were acquired with 17O MRI using iterative reconstruction and edge-preserving filter constructed from the gradient 1H MR data set (7). Whole brain white matter (WM)/ gray matter (GM) CMRO2 values of 0.83–1.09/1.13–1.48 µmol/gtissue/min calculated from 17O-MRI data are in a good correspondence with the results of 15O‑PET (1) and other 17O-MRI (3–7) studies. For QUIXOTIC, CMRO2 values of 0.40–1.45/0.74–1.73 µmol/gtissue/min were calculated in WM/GM regions.
Despite the high resolution provided by 1H MRI, it has several limitations. First, CBF cannot be measured reliably in WM regions due to low amount of blood capillaries. Second, an assumption of fully oxygen saturated arterial blood is not valid, e.g. for hypoxic patients causing overestimation of OEF and, thus, CMRO2 values. Third, CSF signal contamination is also a concern and may result in an underestimation of CMRO2 (9).
17O-MRI does not have these limitations and its major advantage is that oxygen metabolism is directly assessed using oxygen-17 as an intracellular tracer, whereas 1H-MRI techniques are looking more indirectly at the susceptibility effects caused by oxygen (e.g., in hemoglobin). The limitations for the widespread of 17O-MRI are low SNR due to low natural abundance of oxygen-17 nucleus, high cost of 17O gas, and requirement of special hardware. Ultra-high-field MRI systems (B0≥7T) can be used to increase SNR of 17O-MRI.
Conclusions and Outlook
Both 17O-MRI and 1H-MRI provided CMRO2 values, which are in a good agreement with 15O-PET studies. Currently, QUIXOTIC offers smaller pixels which also results in a higher variation of CMRO2 values, whereas MRI with the intracellular tracer 17O provides averaged values with less variation due to the lower spatial resolution. For a valid comparison of the methods, more volunteer measurements are to be performed.Acknowledgements
Support from NUKEM Isotopes Imaging GmbH is gratefully acknowledged.References
1. Leenders KL, Perani D, Lammertsma AA, Heather JD, Buckingham P, Healy MJ, Gibbs JM, Wise RJ, et al. Cerebral blood flow, blood volume and oxygen utilization. Normal values and effect of age. Brain 1990;113:27–47.
2. Bolar DS, Rosen BR, Sorensen AG, Adalsteinsson E. QUantitative Imaging of eXtraction of oxygen and TIssue consumption (QUIXOTIC) using venular-targeted velocity-selective spin labeling. Magn. Reson. Med. 2011;66:1550–62.
3. Atkinson IC, Thulborn KR. Feasibility of mapping the tissue mass corrected bioscale of cerebral metabolic rate of oxygen consumption using 17-oxygen and 23-sodium MR imaging in a human brain at 9.4 T. Neuroimage 2010;51:723–733.
4. Hoffmann SH, Begovatz P, Nagel AM, Umathum R, Schommer K, Bachert P, Bock M. A measurement setup for direct 17O MRI at 7 T. Magn. Reson. Med. 2011;66:1109–1115.
5. Hoffmann SH, Radbruch A, Bock M, Semmler W, Nagel AM. Direct 17O MRI with partial volume correction: first experiences in a glioblastoma patient. MAGMA 2014;27:579–87.
6. Kurzhunov D, Borowiak R, Hass H, Wagner P, Krafft AJ, Timmer J, Bock M. Quantification of oxygen metabolic rates in human brain with dynamic 17O MRI: profile likelihood analysis. Magn. Reson. Med. 2017;78:1157–1167.
7. Kurzhunov D, Borowiak R, Reisert M, Krafft AJ, Özen AC, Bock M. 3D CMRO2 mapping in human brain with direct 17O MRI: comparison of conventional and proton-constrained reconstructions. Neuroimage 2017;155:612–624.
8. Sedlacik J, Borchert P, Dührsen L, Kurzhunov D, Bolar DS, Bock M, Schmidt N-O, Buhk J-H, et al. Robust R2 fitting method for QUIXOTIC-OEF mapping. Submitted to Proceedings of 26th Annual Meeting of ISMRM; Paris, France; 2018.
9. Rodgers ZB, Detre JA, Wehrli FW. MRI-based methods for quantification of the cerebral metabolic rate of oxygen. J. Cereb. Blood Flow Metab. 2016;36:1165–1185.
Figures