3686
Joint estimation applied to attenuation correction for quiescent period respiratory gated PET data in PET/MR1GE Global Research, Niskayuna, NY, United States, 2Department of Radiology and Biomedical Imaging, University of California, San Francisco, San Francisco, CA, United States, 3GE Healthcare, Munich, Germany
Synopsis
Quiescent period gating of PET data reduces respiratory motion artifacts in PET imaging. However, a respiratory phase mismatch between attenuation map and gated PET data results in PET quantitation errors particularly for lesions in the dome of the liver. To address the problem, we apply a joint estimation (JE) technique to attenuation correction for respiratory phase gated PET data. We demonstrate on clinical PET/MR data that the JE method improves PET quantitation accuracy without an additional process of respiratory phase gating of MR data. JE has additional potential to estimate patient-specific lung tissue density and provide robustness to metallic implants.
Purpose
Quiescent period gating of PET data is a simple and practical way of reducing respiratory motion artifacts in PET imaging. However, a respiratory phase mismatch between attenuation map and gated PET data results in banana artifacts and PET quantitation errors particularly for lesions near the interface between lungs and liver. To address the problem of attenuation correction for respiratory gated PET data, we apply a joint estimation (JE) technique, also known as maximum likelihood reconstruction of activity and attenuation (MLAA), where both activity and attenuation are jointly estimated based on PET data in combination with MR information. The JE technique has the potential to improve PET quantitation accuracy without an additional process of respiratory phase gating of MR data and reconstruction of the gated MR data. The JE approach is particularly useful for PET/MR scanners with time of flight (TOF) capability, which is known to be important for the success of JE.Methods
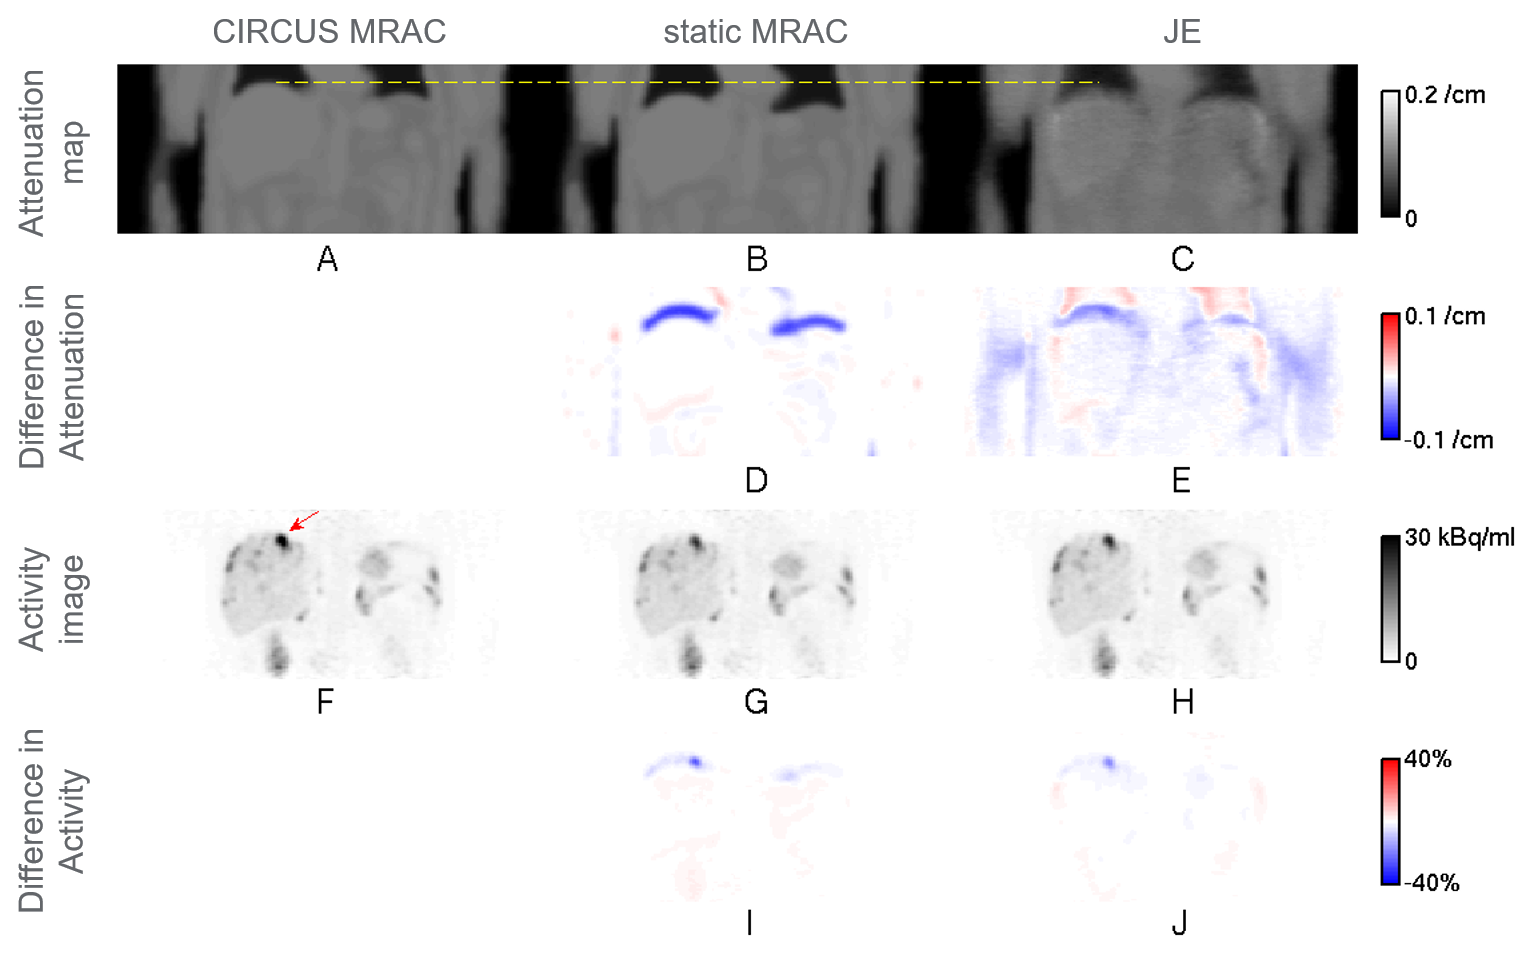
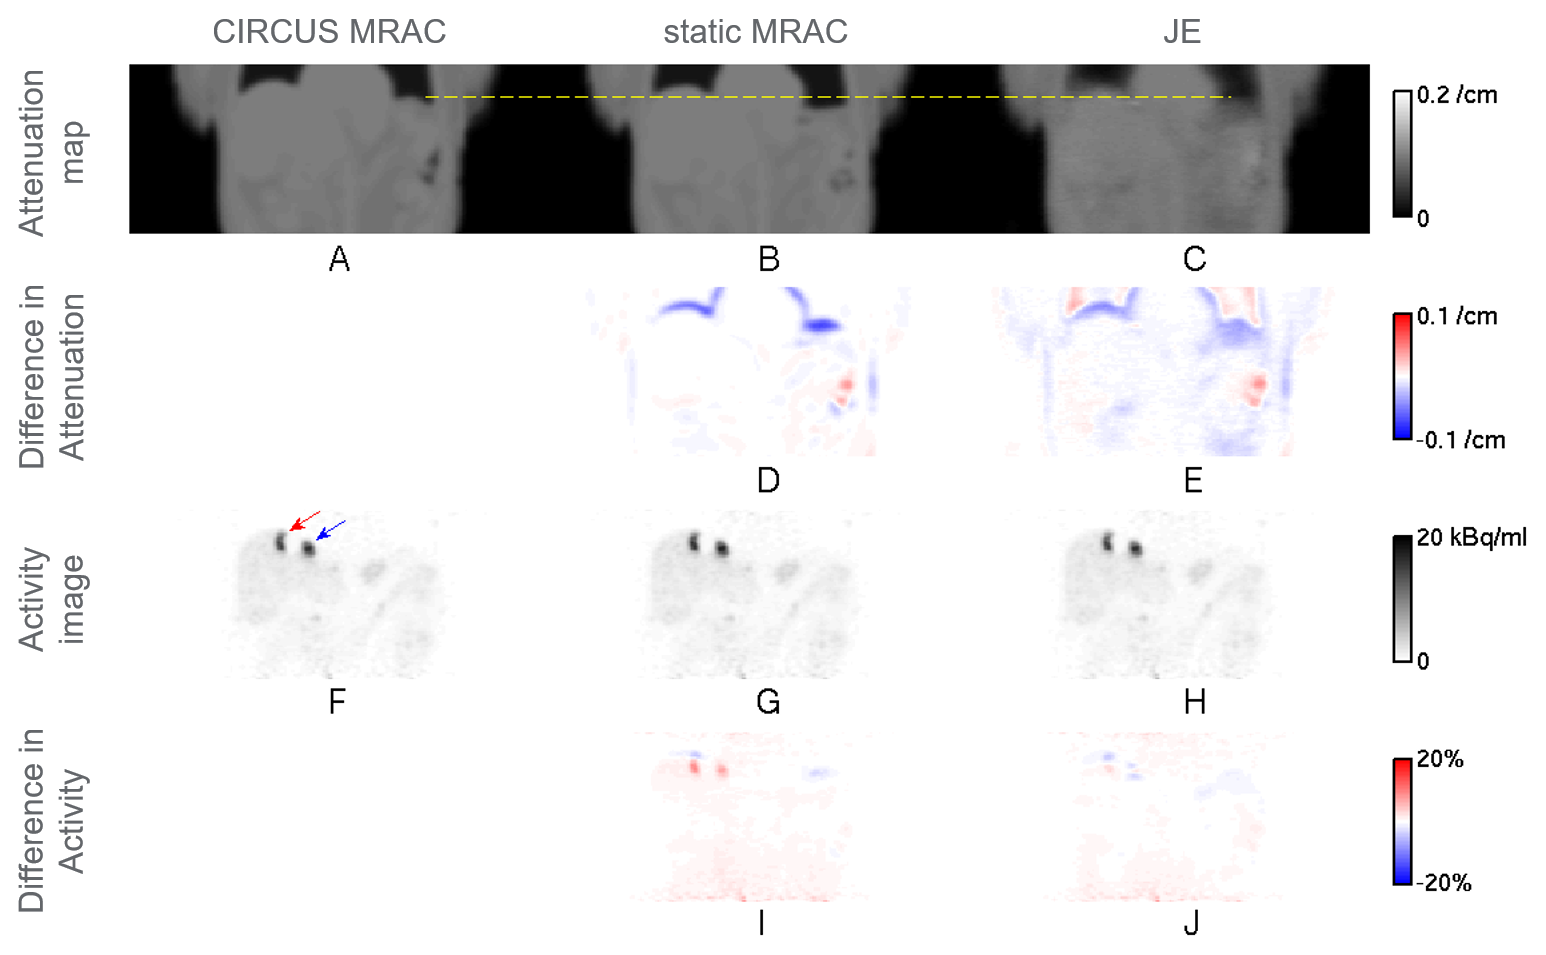
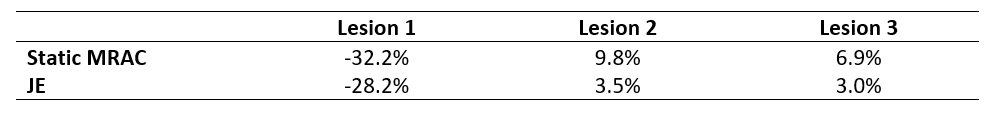
Liver-focused Ga-68 DOTATOC clinical PET/MR scans were performed on a GE SIGNA PET/MR scanner (GE Healthcare, Chicago, IL, USA). Subjects who had lesions near the dome of the liver were selectively chosen for the study. PET list-mode data in end expiration were binned for a quiescent period (phase offset of 30% and width of 50% of the normalized respiratory cycle) by using retrospective phase-based gating with bellows triggers [1]. Three attenuation correction (AC) methods for the quiescent period gated PET data were compared. First, static MR-based attenuation correction (MRAC) [2] using a dedicated 3D gradient echo (GRE) scan with Dixon-type fat-water separation (flip angle 5°, scan time 18 s, transaxial field of view (FOV) 50 cm, axial FOV 31.2 cm, and image matrix 256×256×120) was used as a baseline. Phase-mismatched static MRAC scans were chosen for the subjects. Second, the circular Cartesian undersampling (CIRCUS) strategy [3] combined with compressed sensing was used for MR data acquired for 100 s with free breathing [1,4]. The MR data were sorted, based on bellows-driven triggers, for the quiescent period and then used for generating a phase-matched PET attenuation map [1,2]. Although the ground-truth phase-matched attenuation map (gold standard) is unavailable, CIRCUS MRAC has shown to provide a reasonable phase-matched attenuation map (silver standard) in previous studies [1,4]. Therefore, the CIRCUS MRAC based attenuation map was considered as a reference in this study. Third, a JE method [5,6] using an MR-based prior was applied to the quiescent period gated PET data to generate a phase-matched attenuation map. The JE method gives more weight to the MR-based prior in strong MR signal regions such as soft tissue and less weight to the MR-based prior, equivalent to more weight to PET data, in low MR signal regions such as lungs. The baseline static MRAC was used for the MR-based prior and the initialization for JE. PET activity images were reconstructed by TOF ordered subsets expectation maximization (OSEM) (with transaxial FOV 60 cm, axial FOV 25 cm, and image matrix 192x192x89) using 2 iterations with 28 subsets, based on the attenuation map for each AC method. For three lesions near the dome of the liver (indicated by the red arrow in Figure 1F for subject 1, and by the red and blue arrows in Figure 2F for subject 2), mean standardized uptake values (SUVs) [7], SUVmean’s, were computed, and relative errors for static MRAC and JE with respect to CIRCUS MRAC were calculated as (relative error)={(measured SUVmean)-(CIRCUS MRAC SUVmean)}/(CIRCUS MRAC SUVmean).Results
Figures 1 and 2 show representative coronal slices, for subjects 1 and 2, which contain lesions near the dome of the liver, for attenuation maps generated by the three AC methods, static MRAC (baseline), CIRCUS MRAC (reference) and JE, and for PET activity images reconstructed based on the attenuation maps. Table 1 gives a comparison of relative errors in mean SUV for static MRAC and JE with respect to CIRCUS MRAC for three lesions near the dome of the liver. Relative errors for static MRAC were reduced by JE by a 4.7 percentage point on average for the lesions (based on Table 1).Discussion & Conclusion
We demonstrated feasibility of addressing respiratory phase mismatch by JE to improve attenuation correction and lesion quantitation accuracy for quiescent period gated PET data (Figures 1, 2, and Table 1). The JE method used static MRAC (with scan time 18 s) for MR-based priors, and CIRCUS MRAC (with scan time 100 s) was used as a reference. JE has additional potential to recover patient-specific lung tissue density, which is difficult to obtain by MR.Acknowledgements
No acknowledgement found.References
1. Yang J, Wiesinger F, Liu J, Hope TA, Seo Y, Larson PEZ. Phase-matched MR-based attenuation correction for quiescent period PET: A feasibility study. J Nucl Med 2017;58 (supplement 1): 650.
2. Wollenweber SD, Ambwani S, Lonn AHR, Shanbhag DD, Thiruvenkadam S, Kaushik S, Mullick R, Qian H, Delso G, Wiesinger F. Comparison of 4-class and continuous fat/water methods for whole-body, MR-based PET attenuation correction. IEEE Trans Nucl Sci 2013;60(5):3391-3398.
3. Liu J, Saloner D. Accelerated MRI with CIRcular Cartesian UnderSampling (CIRCUS): a variable density Cartesian sampling strategy for compressed sensing and parallel imaging. Quant Imaging Med Surgery 2014;4(1):57-67.
4. Yang J, Wiesinger F, Menini A, Liu J, Hope TA, Seo Y, Larson PEZ. Respiratory phase-matched MR-based attenuation correction (MRAC) for four-dimensional (4D) PET in PET/MRI: a feasibility study. In Proceedings of the 25th Annual Meeting of ISMRM, Honolulu, HI, USA, 2017. Abstract #0785.
5. Ahn S, Cheng L, Shanbhag D, Wiesinger F. Robust PET attenuation correction for PET/MR using joint estimation with MR-based priors: application to whole-body clinical TOF PET/MR data. In Proceedings of the 25th Annual Meeting of ISMRM, Singapore, 2016. Abstract #1776.
6. S. Ahn, L. Cheng, D. Shanbhag, F. Wiesinger, R. Manjeshwar. Joint reconstruction of activity and attenuation using MR-based priors: application to clinical TOF PET/MR. In Proceedings of IEEE Nuclear Science Symposium Medical Imaging Conference, San Diego, CA, USA, 2015.
7. Y. E. Erdi, O. Mawlawi, S. M. Larson, M. Imbriaco, H. Yeung, R. Finn, J. L. Humm. Segmentation of lung lesion volume by adaptive positron emission tomography image thresholding. Cancer 1997;80:2505-2509.
Figures