3685
Applications of ZTE-derived Attenuation Correction Maps to Neuropediatric Cases: A Preliminary Analysis1Applications & Worflow, GE Healthcare, Orsay, France, 2Applications & Workflow, GE Healthcare, Cambridge, United Kingdom, 3INSERM U1129, Université Paris Descartes, CEA-SHFJ, Paris, France, 4Centre de NeuroImagerie de Recherche (CENIR), Institut du Cerveau et de la Moelle épinière (ICM), Paris, France, 5Imagerie Moléculaire In Vivo, IMIV, CEA, INSERM, CNRS, Université Paris-Sud, Université Paris Saclay, CEA-SHFJ, Orsay, France
Synopsis
PET/MR is a promising imaging modality for pediatric applications due to its lower radiation dose compared to PET/CT. However, commonly implemented MR-derived Attenuation Correction (MRAC) methods have not been fully evaluated for pediatrics brain applications. Consequently, we aimed at comparing different MRAC methods (Atlas, ZTE and High-resolution ZTE) on pediatric patients. Since the current gold standard AC data (i.e. CT) is missing, the different MRAC methods are ranked in comparison with the results found in the literature to determine if current knowledge regarding MRAC methods applied on adults might be extended to the considered pediatric population.
Introduction
PET/MR is thought to be a promising imaging modality for pediatric neurological applications due to its lower radiation dose compared to PET/CT, in which the CT contributes half the dose. However, to the best of our knowledge, commonly implemented MR-derived Attenuation Correction (MRAC) methods for the head have not been fully evaluated for brain PET/MR in pediatrics. Commonly implemented MRAC methods include the Atlas-based1 and the UTE/ZTE-based2-4 (Zero Echo Time) methods.Purpose
Here, we aimed at comparing different MRAC methods (Atlas, ZTE and High-resolution ZTE-based) in pediatrics for brain application. Since we are missing the current gold standard AC data (i.e. CT), the different MRAC are ranked in comparison with the results found in the literature to determine if current knowledge regarding MRAC methods applied on adults might be extended to the considered pediatric population.Methods
Seventeen children with refractory epilepsy were scanned (age 13.8±2.5 years, min/max=8/18 years, 10 women) on the SIGNA PET/MR scanner (GE Healthcare, Waukesha, WI, USA) with an 8-channel brain coil as part of an approved research protocol. The patients were injected with 18F-FDG at the dose of 3MBq/kg according to the current clinical recommendations.
The PET acquisition lasted 30 minutes during which MR acquisitions were performed. A two-point Dixon (LAVA-flex) was first acquired to derive the atlas based AC. This was followed by a ZTE with 2.4mm isotropic resolution and a high resolution ZTE (ZTE-HR) with 1.6mm isotropic resolution. 3D-T1 weighted MR was also performed for anatomical reference.
Four AC maps were derived. One used the atlas approach based on the Dixon acquisition1. For the ZTE and the ZTE-HR acquisitions, the AC maps were derived using the normalized histogram based approach2-6; the fourth AC map, referred as “Partial”, was generated by segmentation of the LAVA-Flex data in three tissue classes (air, fatty- and non-fatty tissue), without including bone.
The PET data were reconstructed using the TOF-OSEM algorithm using the four AC maps (6 iterations, 28 subsets, field-of-view 300x300x250 mm, with PSF modelling, attenuation, scatter correction, voxel-size =1.56x1.56x2.78mm). The images were then scaled to standardized uptake values (SUV) co-registered and normalized to a PET template in MNI space using SPM8.
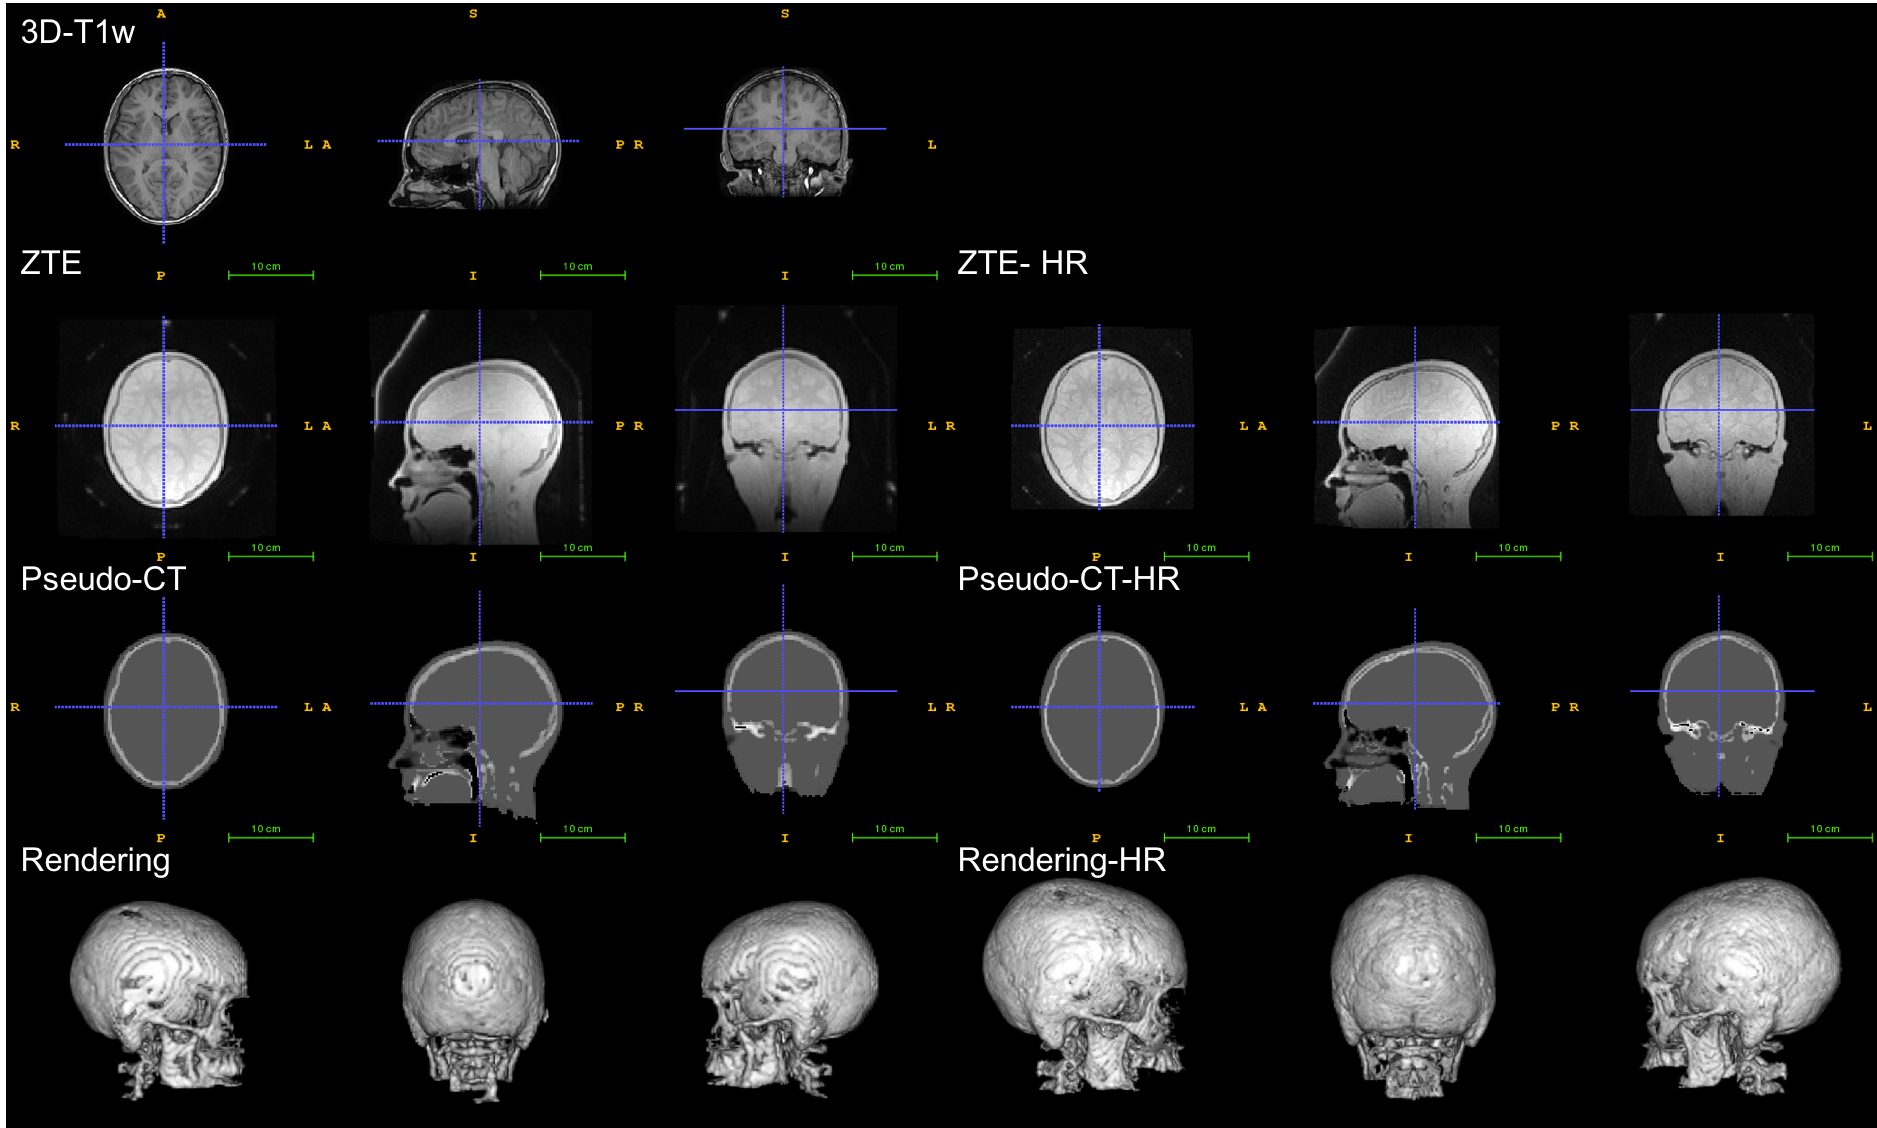
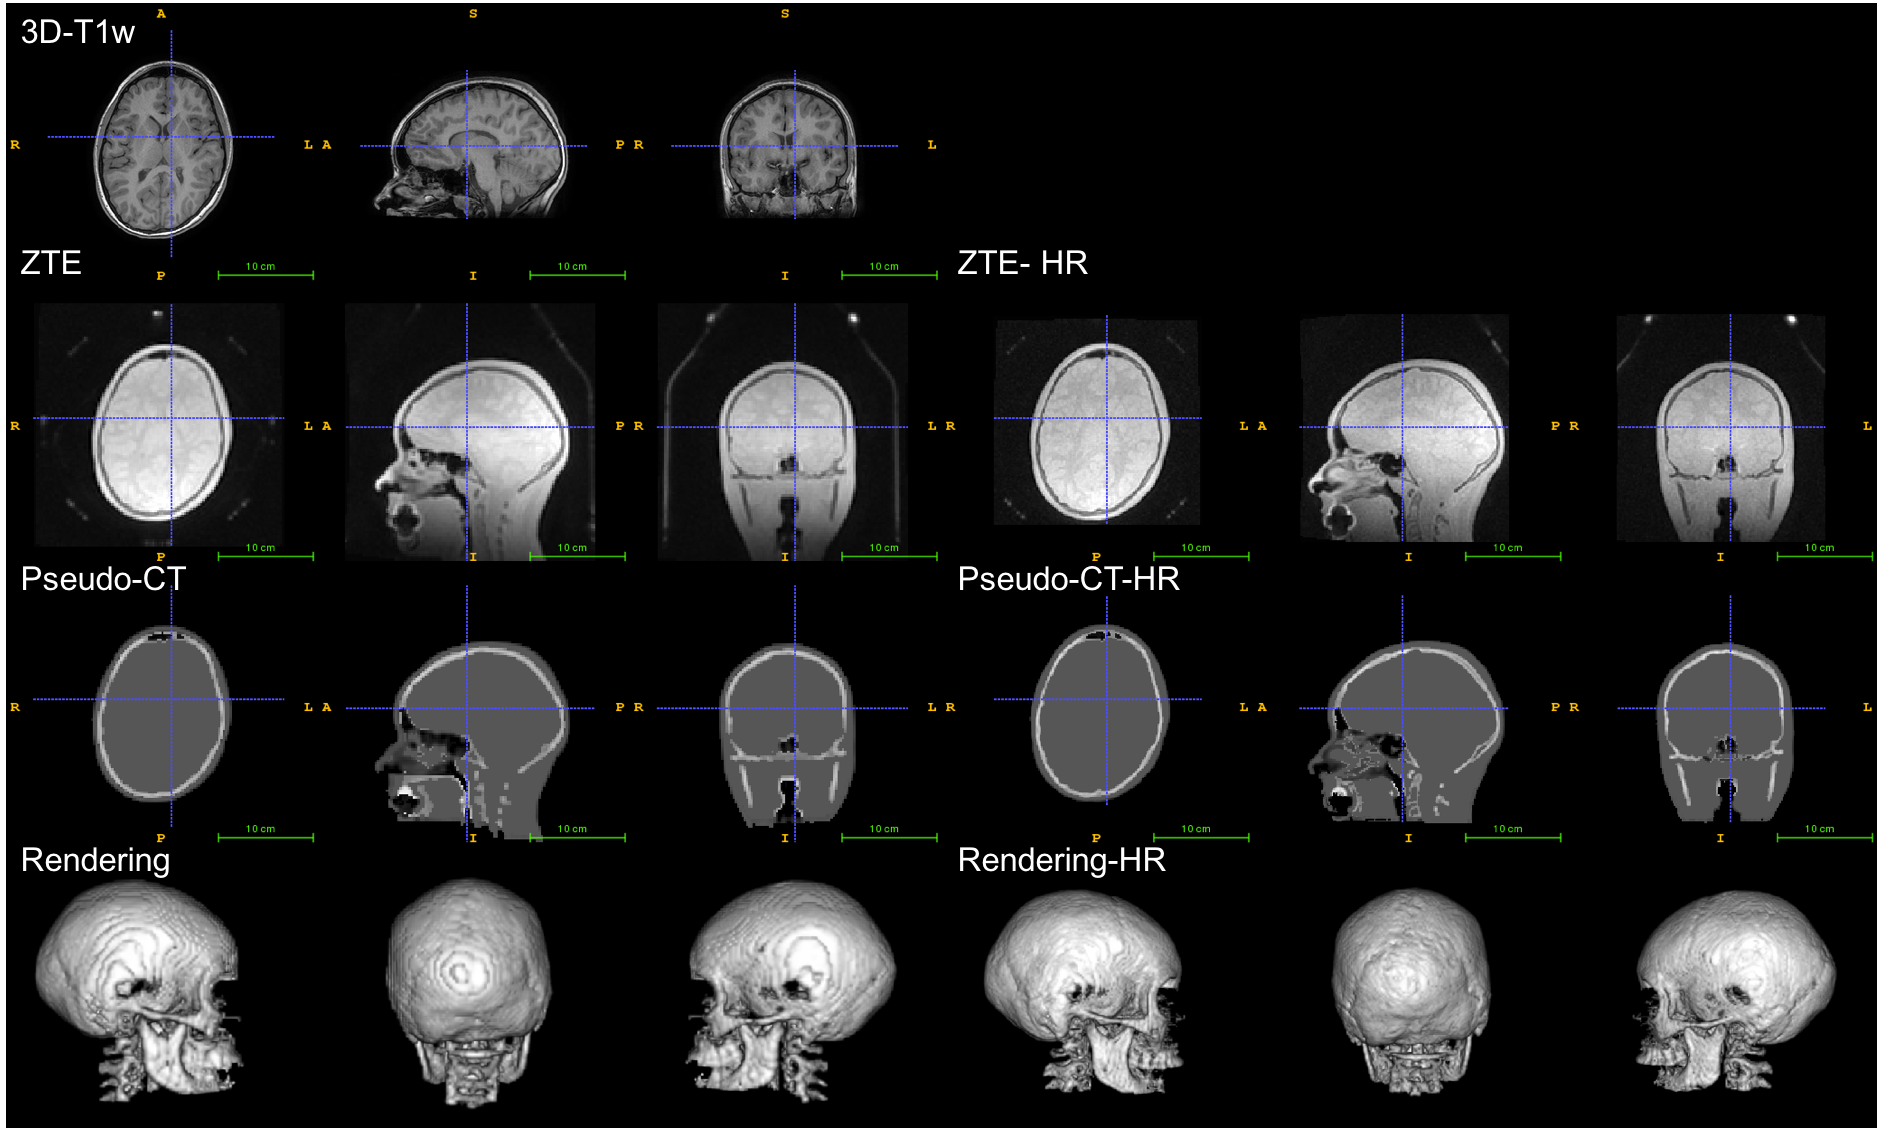
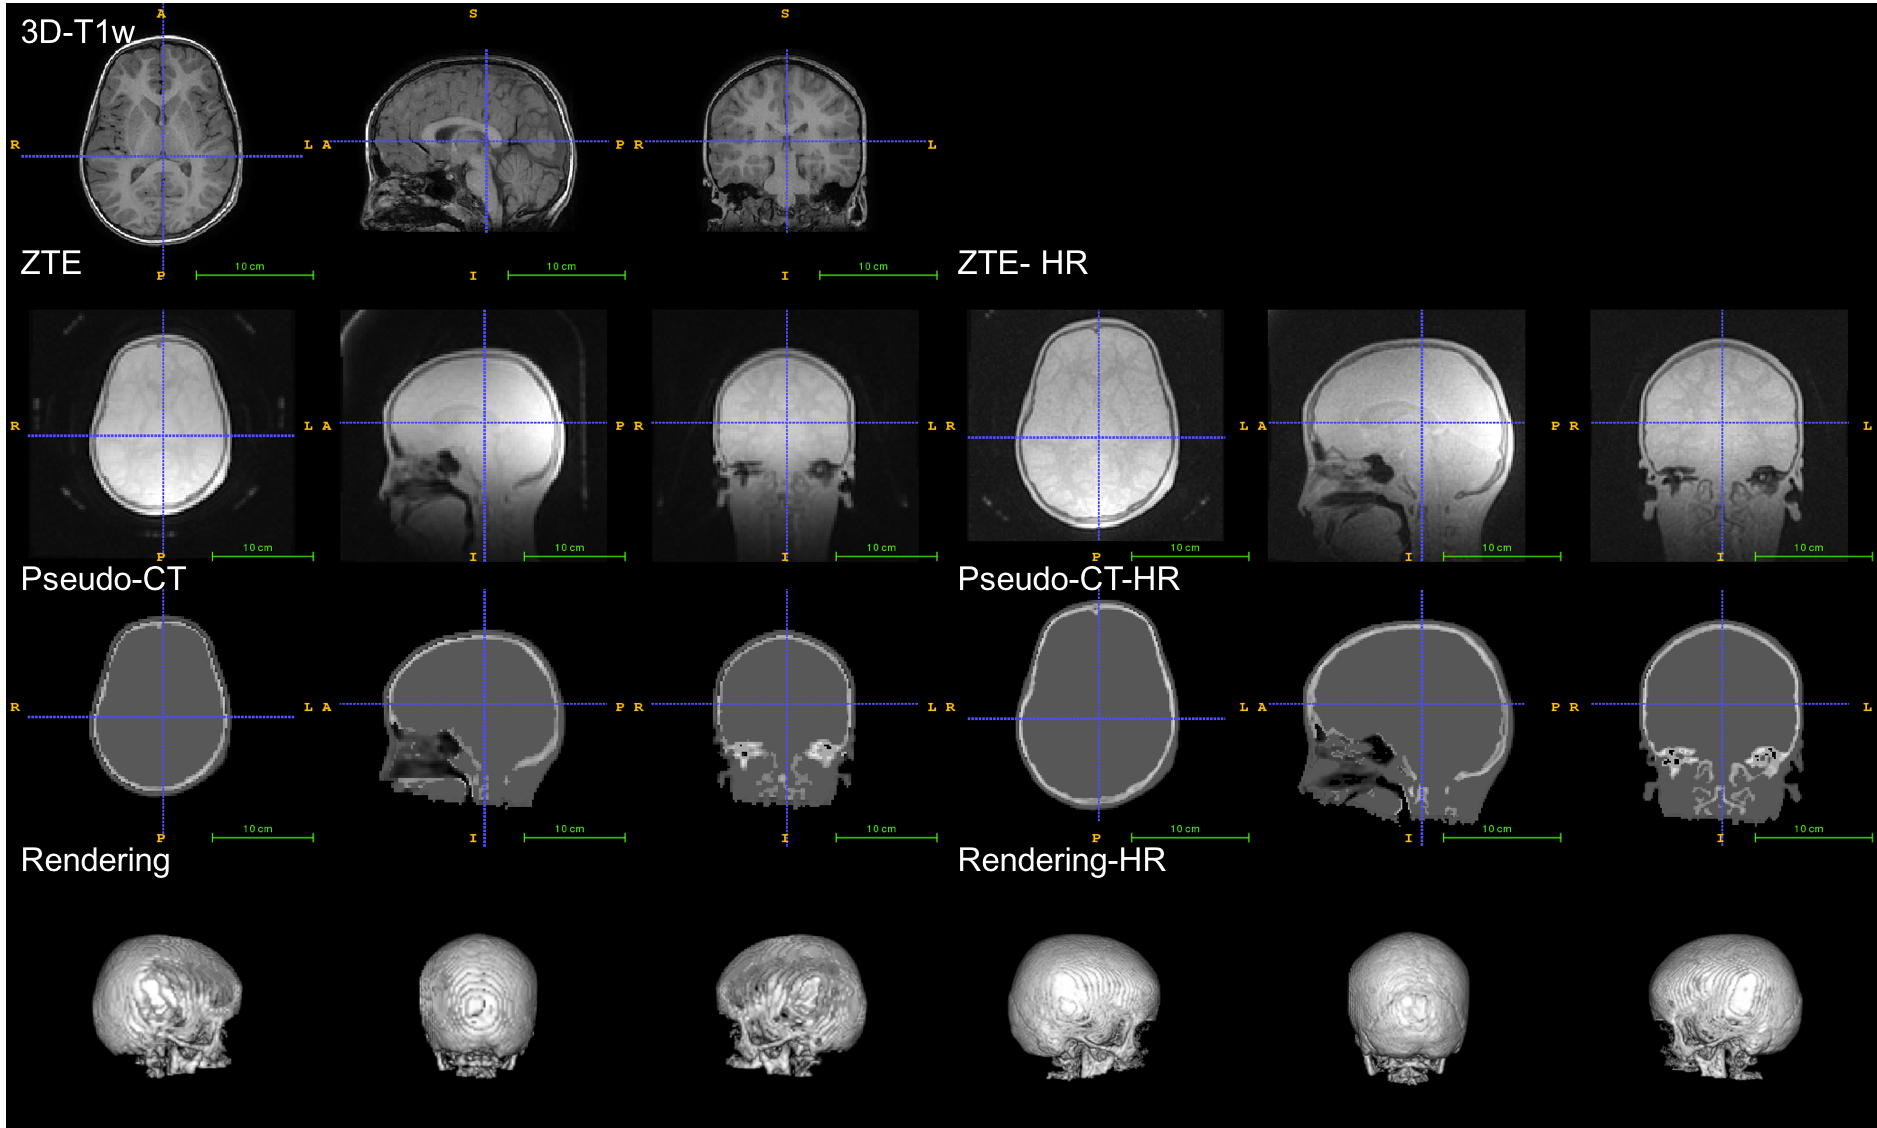
As the CT to derive the gold standard AC maps were not available (CT is not performed anymore in epilepsy workup and was not added in the present pediatric protocol for ethical reasons), the differences obtained using each MRAC method with respect to the gold standard could not be computed. As an alternative evaluation approach, a visual inspection was performed to check that the basic anatomical features were consistent with anatomical 3D-T1w and the mean differences between the MRAC methods and the atlas-based method were computed and compared to results found in the literature for adults5-6.
Results
The atlas, the ZTE and ZTE-HR approaches were applied successfully for all subjects. Visual inspection of the pseudo-CTs generated with the atlas and ZTE approaches showed that the different approaches gave consistent results as far as anatomy was concerned (figures 1, 2 and 3).
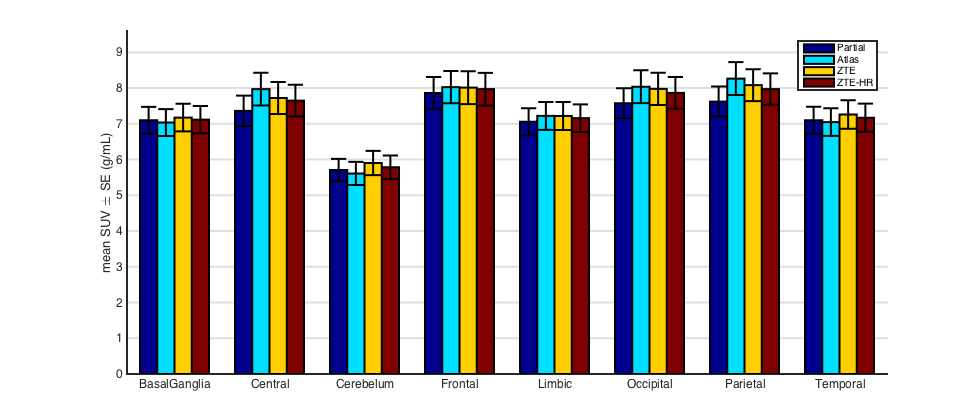
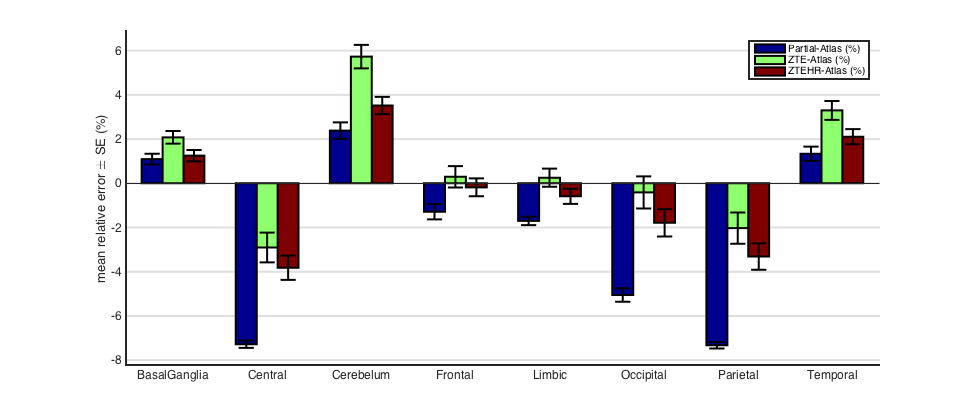
The mean SUVs (with standard error) and the mean difference relative to the atlas approach for the different brain regions are given in figures 4 and 5, respectively. From the literature6, we learn that compared to a CT-based AC, for most brain regions, “Partial” AC leads to substantial PET activity underestimation (~-10%), atlas AC leads to a mild overestimation (~5%) and ZTE AC lead to a reduced difference (~±2.5%). Comparing this mean relative difference to the mean SUVs in figure 4 and relative difference in figure 5 showed the same trend in our pediatric data: the values when using ZTE and ZTE-HR AC maps lie between the “Partial” AC and the Atlas AC (the two worst cases). Comparing the ZTE-AC to the ZTE-HR-AC showed a difference less than 1% for all brain regions.
Discussion and conclusion
In this preliminary study, the different MRAC approaches were applied successfully to pediatric data (8-18 years). All the tested MRAC methods generate pseudo-CT consistent with the anatomy of the individual subjects. In terms of accuracy, we can only conclude that the same trend as in the adult literature was observed between the different MRAC methods. This suggests that the relative performance of the MRAC methods observed on adults might be extended to the considered pediatric population. However, we cannot conclude about the exact accuracy. No major differences in PET quantification were observed between ZTE and ZTE-HR.
The main limitation of this study is the lack of gold standard. Future work will focus on determining the accuracy of each method on pediatric data.
Acknowledgements
This work has been partly supported by the Lidex-PIM project funded by the IDEX Paris-Saclay, ANR-11-IDEX-0003-02.References
- Wollenweber SD, Ambwani S, Delso G, et al. Evaluation of an Atlas-Based PET Head Attenuation Correction Using PET/CT and MR Patient Data. IEEE transactions on nuclear science. 2013;60(5):3383-90.
- Wiesinger F, Sacolick LI, Menini A, et al. Zero TE MR bone imaging in the head. Magnetic resonance in medicine 2016;75(1):107-14.
- Sekine T, Ter Voert EE, Warnock G, et al. Clinical Evaluation of Zero-Echo-Time Attenuation Correction for Brain 18F-FDG PET/MRI: Comparison with Atlas Attenuation Correction. Journal of nuclear medicine. 2016;57(12):1927-32.
- Yang J, Wiesinger F, Kaushik S, et al. Evaluation of sinus/edge corrected ZTE-based attenuation correction in brain PET/MRI. J Nucl Med November 1, 2017 vol. 58 no. 11 1873-1879
- Schramm G, Rezaei A, Willekens S, et al. Validation of ZTE head attenuation correction in the GE SIGNA PET/MR - initial results. Journal of Nuclear Medicine. 2017;58(supplement 1):644.
- Khalifé M, Fernandez B, Jaubert O, et al. Subject-specific bone attenuation correction for brain PET/MR: can ZTE-MRI substitute CT scan accurately? Phys. Med. Biol. 62 (2017) 7814–7832
Figures