3677
Automated tumour definition in diffusion imaging from Gaussian mixture modelling of intrinsically-registered PET data in breast cancer: pilot study1Department of Circulation and Medical Imaging, NTNU, Norwegian University of Science and Technology, Trondheim, Norway, 2St.Olavs Hospital, Trondheim University Hospital, Trondheim, Norway, 3Department of Physics, NTNU, Norwegian University of Science and Technology, Trondheim, Norway, 4Department of Radiology and Nuclear Medicine, Trondheim University Hospital, Trondheim, Norway, 5Department of Clinical and Molecular Medicine, NTNU, Norwegian University of Science and Technology, Trondheim, Norway, 6Department of Oncology, Trondheim University Hospital, Trondheim, Norway, 7Section of Oncology, Department of Clinical Science, University of Bergen, Bergen, Norway, 8Department of Oncology, Haukeland University Hospital, Bergen, Norway
Synopsis
Simultaneous positron emission tomography and magnetic resonance imaging (PET/MRI) is an emerging technique in breast cancer practice, allowing collection of morphologic parameters in addition to real-time metabolism. Though feasibility has been demonstrated, the best approach to utilize PET/MRI has not yet been validated. This study focus on evaluating a Gaussian mixture model (GMM) based segmentation technique from PET images with intrinsic MRI registration as a proxy for regions-of-interest (ROIs) manually drawn on post contrast images. The application of the method has been evaluated in a neoadjuvant treatment response assessment setting using apparent diffusion coefficient (ADC) values.
Introduction
Diffusion weighted imaging (DWI) in breast cancer is a useful tool for early treatment response evaluation1, where increased apparent diffusion coefficient (ADC) has been shown to indicate response. Segmentation of tumour on DWI may be confounded by noise and lack of conspicuity, and regions-of-interest (ROIs) on post-gadolinium contrast (post-contrast) images, manually drawn and transferred to DWI, are commonly used. Simultaneous positron emission tomography and magnetic resonance imaging (PET/MRI) is an emerging technique in breast cancer practice2-4. In this PET/MRI study, specific uptake values (SUV) from intrinsically registered PET-images are used to automatically classify tumour tissue using Gaussian mixture modelling (GMM), to investigate the potential for using PET segmentation as a surrogate for post-contrast ROIs. We compare the spatial overlay of PET and post-contrast ROIs, and examine resulting ADC metrics and change in tumour size in longitudinal test cases from a breast cancer cohort.Methods
Acquisition: Six biopsy-proven, locally advanced breast cancer patients from a prospective study cohort underwent simultaneous PET/MRI (3T mMR, Siemens Healthcare) following 18F-FDG injection. All patients received one baseline scan, and four were monitored through treatment. In addition to standard T2 weighted and dynamic contrast-enhanced (DCE) imaging, DWI was performed with parameters: axial bilateral ssEPI, TR/TE 9000/77ms, b-values=0, 50, 120, 200, 400, 700mm-2s, resolution 2x2x2.5mm. PET acquisition was concurrent with DWI and contrast sequences.
Image Processing: Following acquisition, PET attenuation correction was performed based on Dixon MRI. Geometric distortion in DWI was corrected using reverse-phase b0 images5 and ADC maps were calculated using a mono-exponential decay model for b=200mm-2s and above. PET and post-contrast images were resampled to match DWI resolution using elastix6.
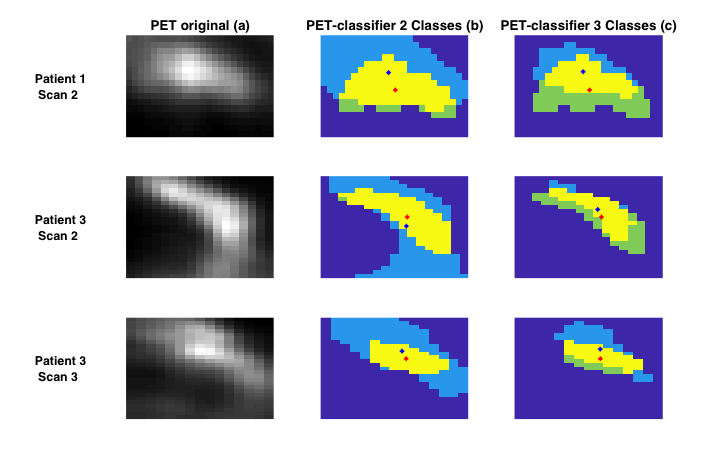
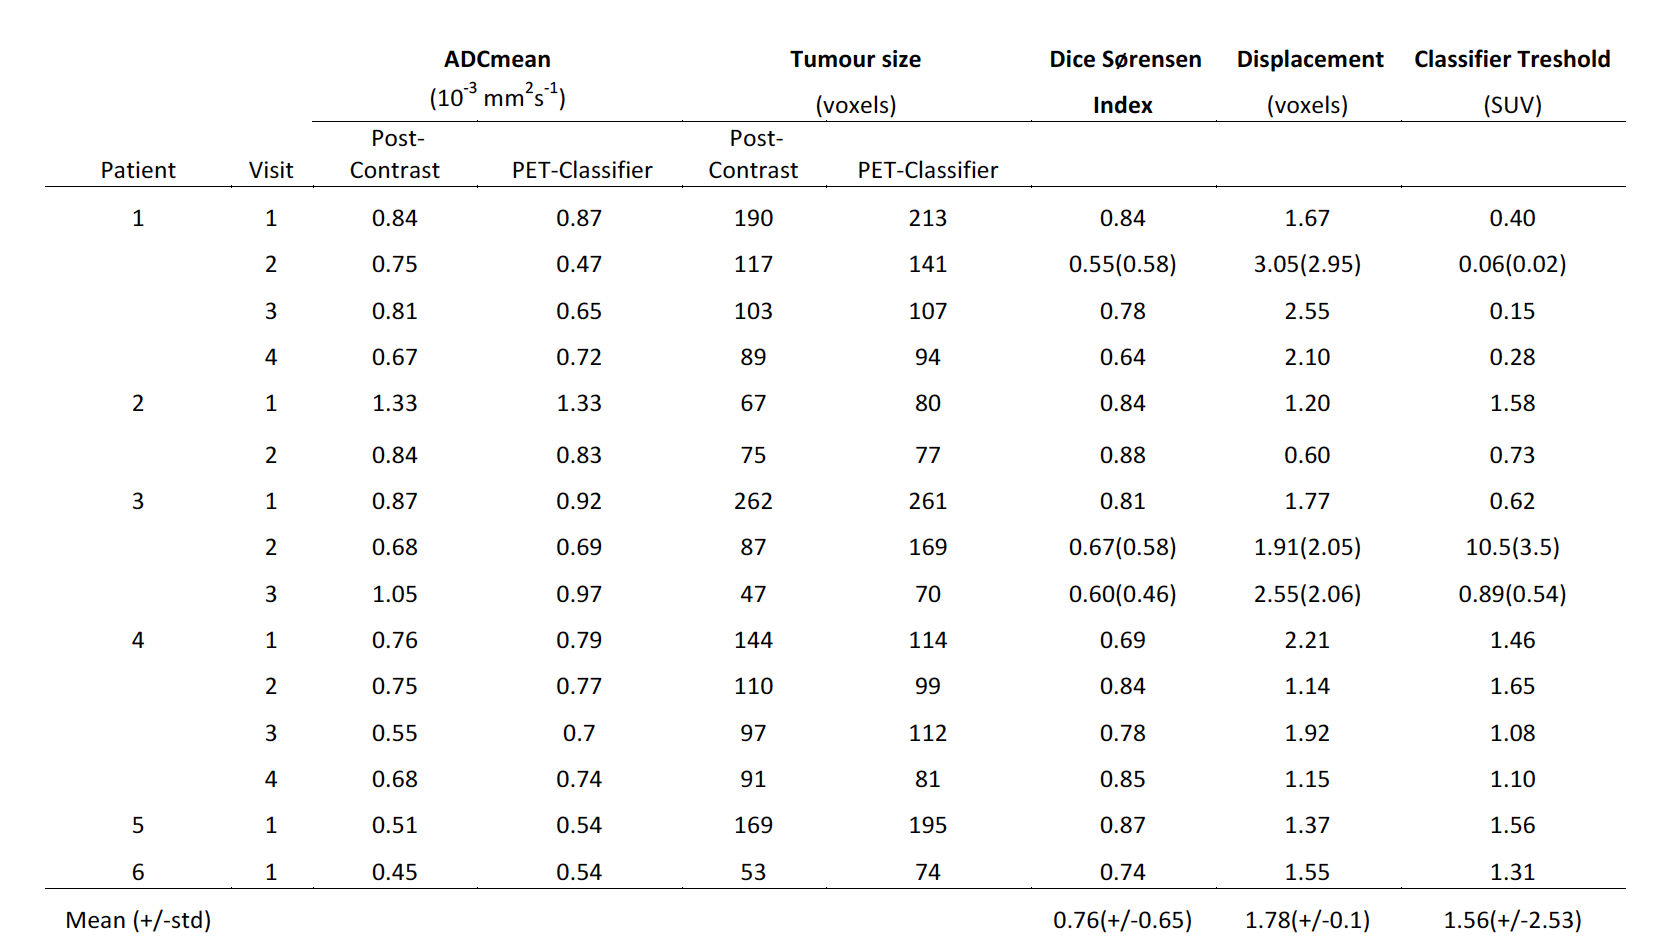
Method Evaluation: Image sections containing possible tumour and normal tissue were taken from PET images in the central slices of the breast, with GMM analysis assigning two voxel classes; in three cases, three voxel classes were needed (Figure 2). Standard manual ROIs were also obtained by segmenting the tumour on the post-contrast image. The overlap of tumour ROIs between the automatic and manual segmentation methods were assessed by Dice-Sørensen index and centre-of-gravity displacement. Mean±std tumour ROI ADC values were calculated in both the manually segmented and automatically classified ROIs, and compared by a paired t-test.
Response Classification: Of the longitudionally monitored patients, three received neoadjuvant endocrine therapy and one received olaparib. DCE volumes at the MRI scan closest to therapy midpoint were used to evaluate clinical response to treatment, where a decrease in DCE-MRI whole-tumour volume was considered treatment response.
Results
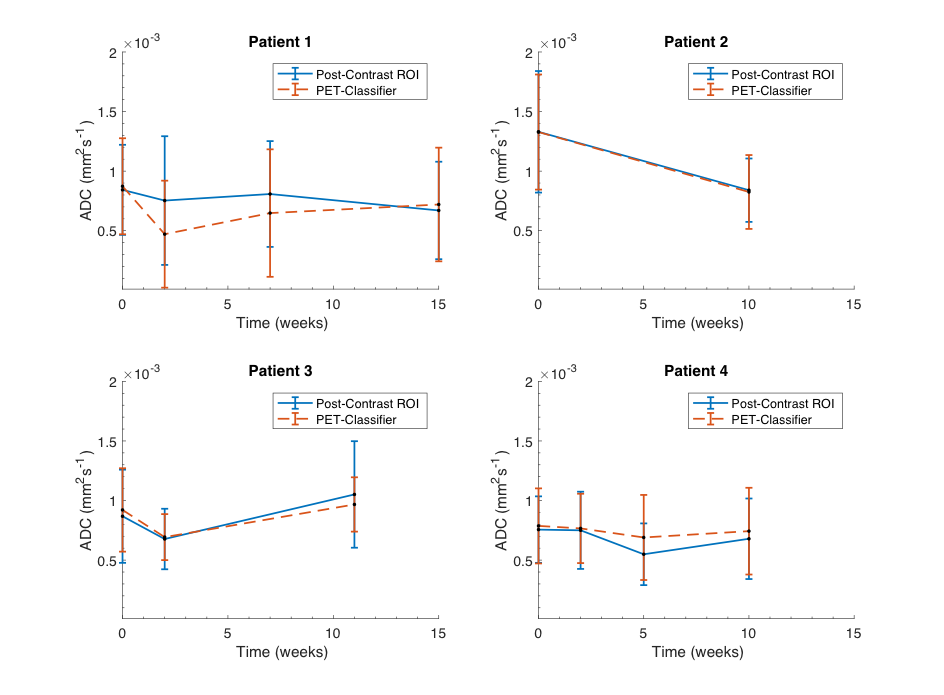
Method Evaluation: Figure 1 illustrates the GMM classification based on SUV values, and the correspondence with manual ROIs from post-contrast images; full results are given in Table 1. Average Dice-Sørensen index was 0.76, indicating good spatial concordance of the automatic PET-classifier and the manually drawn post-contrast ROIs. The PET tumour class is displaced (patient 1 scan 2) and overestimated (patient 3 scan 3) compared to post-contrast ROIs in the cases with the lowest Dice-Sørensen index. Resulting ROI ADC values were not significantly different (p=0.95) and matched across scans for all patients, with excellent agreement in two cases (Figure 3). In addition, similar tumour size was reflected by both segmentation methods in individual scans, and overall trends across scans matched in all but one patient (Figure 4).
Response Classification: Based on change in whole-tumour volume, patients 1 and 3 were considered responders, and patients 2 and 4 non-responders. Patients 2 and 4 demonstrated decrease and patient 3 an increase in ADC values in correspondence with clinical response status.
Discussion
Our pilot results show that a naïve, automated tumour segmentation using SUV values from intrinsically-registered PET images successfully captures comparable ADC changes during neoadjuvant breast cancer treatment as found by manual ROIs from post-contrast images. The intrinsic registration of simultaneously acquired PET/MRI data may give insight into concordance of areas of increased metabolism and perfusion, without errors from registration and intra-scan motion, and potentially remove the need for gadolinium contrast in those patients receiving PET. The performance of the automated tumour segmentation have the potential to provide detailed metabolic, microstructural and functional information, such voxel-wise SUV-ADC values. While this pilot cohort is too small to draw general conclusions, these preliminary results demonstrate the potential of a GMM-based tumour segmentation technique in PET images with intrinsic MRI registration as a proxy for traditional tumour definition in post-contrast images. However, more work is needed to define the best SUV-threshold levels from both two and three voxel classes, and to investigate SUV-variation across scans (demonstrated by patient 3). In addition, the results highlight tumour heterogeneity, both in treatment response and in presentation of MRI derived characteristics, and illustrate the continuing need for development of multi-parametric imaging in the clinic.Acknowledgements
We acknowledge support from the liaison Committee between the Central Norway Regional Health Authority and the Norwegian University of Science and Technology.References
1. Pickles MD, Gibbs P, Lowry M and Turnbull LW. Diffusion changes precede size reduction in neoadjuvant treatment of breast cancer. Magn Reson Imaging. 2006; 24: 843-7.
2. Jena A, Taneja S, Singh A, et al. Reliability of 18F-FDG PET Metabolic Parameters Derived Using Simultaneous PET/MRI and Correlation With Prognostic Factors of Invasive Ductal Carcinoma: A Feasibility Study. AJR Am J Roentgenol. 2017; 209: 662-70.
3. Romeo V, D'Aiuto M, Frasci G, Imbriaco M and Nicolai E. Simultaneous PET/MRI assessment of response to cytotoxic and hormone neo-adjuvant chemotherapy in breast cancer: a preliminary report. Med Oncol. 2017; 34: 18.
4. Margolis NE, Moy L, Sigmund EE, et al. Assessment of Aggressiveness of Breast Cancer Using Simultaneous 18F-FDG-PET and DCE-MRI: Preliminary Observation. Clin Nucl Med. 2016; 41: e355-61.
5. Teruel JR, Fjosne HE, Ostlie A, et al. Inhomogeneous static magnetic field-induced distortion correction applied to diffusion weighted MRI of the breast at 3T. Magn Reson Med. 2015; 74: 1138-44.
6. Klein S, Staring M Fau - Murphy K, Murphy K Fau - Viergever MA, Viergever Ma Fau - Pluim JPW and Pluim JP. elastix: a toolbox for intensity-based medical image registration.
Figures