3675
Contrast Agent Assessment: Comparison of Quantitative TechniquesMatthew Tarasek1, Jeannette Roberts2, Deirdre Cassidy 3, Jason Castle2, Concetta Gringeri3, Desmond Yeo1, Randall Carter2, and Brian Bales2
1MRI, GE Global Research, Niskayuna, NY, United States, 2Life Sciences, GE Global Research, Niskayuna, NY, United States, 3Life Sciences, GE Healthcare UK, United Kingdom, United Kingdom
Synopsis
Contrast agents are widely used in magnetic resonance imaging (MRI) examinations to enhance the visualization of certain pathologies and anatomical structures to improve diagnostic accuracy. Contrast agents shorten the longitudinal relaxation time (T1) of water molecules, and subsequent signal enhancement in T1-weighted (T1W) images can be observed. In this work, we compare quantitative T1W imaging and T1 mapping for detection of contrast agent deposition in select rat brain structures. Results are presented for two distinct brain structures in a cohort of six rats: three saline controls and three injected with manganese chloride contrast agent.
Purpose:
Contrast agents are widely used in magnetic resonance imaging (MRI) examinations to enhance the visualization of certain pathologies and anatomical structures to improve diagnostic accuracy.1 Contrast agents shorten the longitudinal relaxation time (T1) of water molecules, and subsequent signal enhancement in T1-weighted (T1W) images can be observed. It has been reported that T1W imaging methods do not consistently provide enough sensitivity and reproducibility for reliable detection of T1 changes.2 In this work, we compare quantitative T1W imaging and T1 mapping for detection of contrast agent deposition in select rat brain structures. Results are presented for two distinct brain structures in a cohort of six rats: three saline controls and three injected with manganese chloride contrast agent (MnCl2(aq)).Methods:
Six female Sprague Dawley rats were used in this study. Three control rats were injected with saline and three test rats were injected with 0.15 mmol/kg MnCl2(aq). MR Imaging tests were performed (in vivo brain scans) on a clinical 3T GE MR750 scanner (GE Healthcare, Waukesha, WI) using a rat-sized transmit/receive quadrature Litz rat coil (Doty Scientific). Three sets of imaging data were acquired: (i) pre-injection: acquired on the naïve rats before injection, (ii) post-injection scan 1: acquired after a saline injection was given to control rats (concurrent MnCl2(aq) injections were given to contrast-enhanced rats), and (iii) post-injection scan 2: acquired after a second injection session similar to post-scan 1. During imaging, rats were anaesthetized using isofluorane and their core body temperature was monitored by a calibrated fiber-optic rectal thermometer (SA Instruments, Stony Brook NY). Body temperature was maintained at 36-37oC by an MR compatible small animal heating system (SA Instruments). Quantitative T1 data sets were acquired using a 2D inversion recovery (IR) sequence at the following TI values: 100, 250, 800, 1200, 2000 with all times in ms. Other parameters included flip-angle (FA) = 180°/90°, recovery time (TR) = 2500ms, echo time (TE) = 3ms, field-of-view (FoV) = 6cm2, matrix 256 x128, number of averages (NEX) = 1, full brain slice coverage, 0.8 mm thick. Data processing for T1 mapping datasets included (i) T1 fitting per-pixel in a user-defined ROI covering the entire brain (Fig. 1c), (ii) registration of 3D rat brain atlas slice to the acquired data (Fig. 1a) according to reference 5, and (iii) final selection of an ROI within the atlas-registered T1 map for statistical analysis (Fig. 1b and d). All computation was performed in Matlab (Mathworks, Natick, MA). T1W data sets were acquired using 2D spin echo sequence with the following imaging parameters: FA = 90°, TR = 500ms, TE = 16ms, FoV = 6cm2, matrix 256 x128, NEX = 2, full brain slice coverage, 0.4 mm thick. All data processing for T1W images was done using CineTool, version 8.5.0 (GE Healthcare).Results:
The plots in Fig. 2 top-bottom show the T1 relaxation time-constant values for all rats (pre-injection, post-injection scan 1, and post-injection scan 2) in the olfactory bulb and pituitary gland brain regions. The top plot shows all the data in the multi-slice acquisition. Here, 3 slices covered the olfactory bulb brain structure and 2 slices were needed to cover the pituitary gland. The multi-slice/multi-rat data was combined and averaged into a single plot-point in Fig. 2 bottom. In the contrast-enhanced rats, we see a T1 change of 13% and 37%, pre- to post-injection 1 for the olfactory bulb and pituitary gland respectively. Most notably, the reproducibility of T1 estimates was within 1% from postscan 1 to postscan 2 (Table 1), and within 4% for all control rats’ brain structures across all scan sessions. Data collected for T1W scans indicates a >2-fold increase in measurement uncertainty, in addition to significant observable signal changes in measured brain structures between prescan values and postscan 1/postscan 2 (Table 1 - T1W Data).Discussion and Conclusion:
Results suggests that use of direct T1 mapping can provide a more quantitative and repeatable measure of contrast deposition with more than 2-fold reduction in measurement uncertainty at the concentration levels used in this study. The issues with the T1W imaging data may be explained by signal and contrast bias due to inhomogeneities in the RF transmit and receive field, as previous work has shown that this can lead to >20% magnitude intensity variation at 3T.2-4 We conclude that T1 mapping may provide a quantitative advantage for accuracy and reproducibility over T1W imaging for contrast agent assessment in the rat olfactory bulb and pituitary gland brain structures.Acknowledgements
No acknowledgement found.References
[1] Caravan et al. Chem. Rev., 99:2293-2352(1999) [2] Weiskopf et al. Front. Neurosci., 7:95(2013) [3] Lutti et al. Magn. Reson. Med., 64:229–238(2010) [4] Thomas et al. Magn. Reson. Med., 53:1452-1458(2005). [5] Tarasek et al. "Non-rigid atlas registration for improved quantitative assessment of rat brain regions with limited inherent anatomical contrast" Proceedings of International Society for Magnetic Resonance in Medicine (ISMRM), 27th Scientific Meeting, Paris, France, 2018 submittedFigures
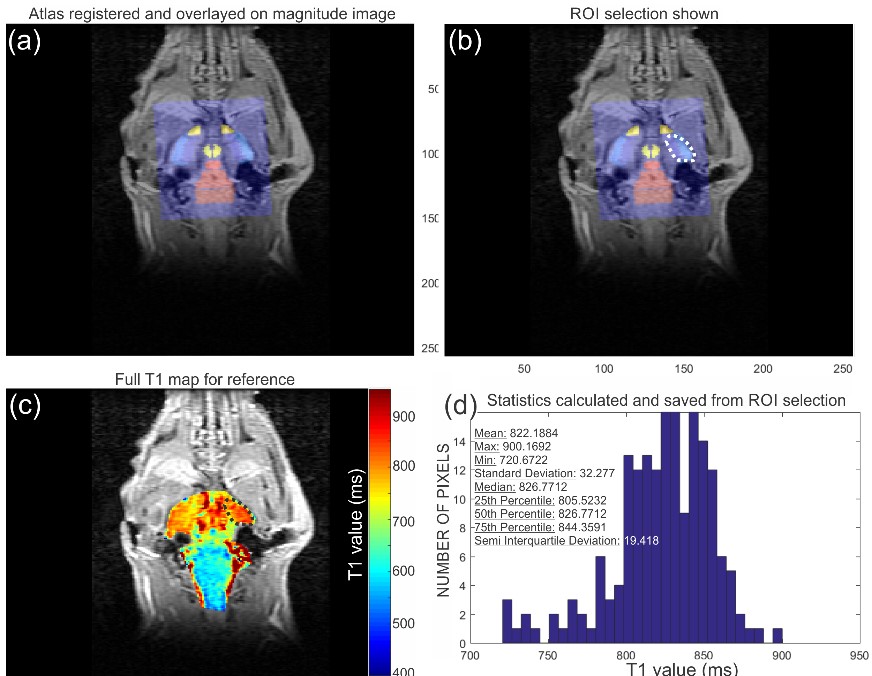
Fig. 1 Example of data
output from processing code5. (a) Shows the rat atlas registered to
the slice of interest. (b) Shows an ROI selected from the registered image in
(a). (c) Shows the ROI location on the full (previously calculated) T1
map of this slice. Here signal intensity (S) was fit per pixel to S(t) = S0(1 - 2*e^(-t/T1) where (t) is the inversion
time of different images in the acquisition. (d) Shows the histogram and
statistics calculated from the T1 map in (c) for the ROI shown.
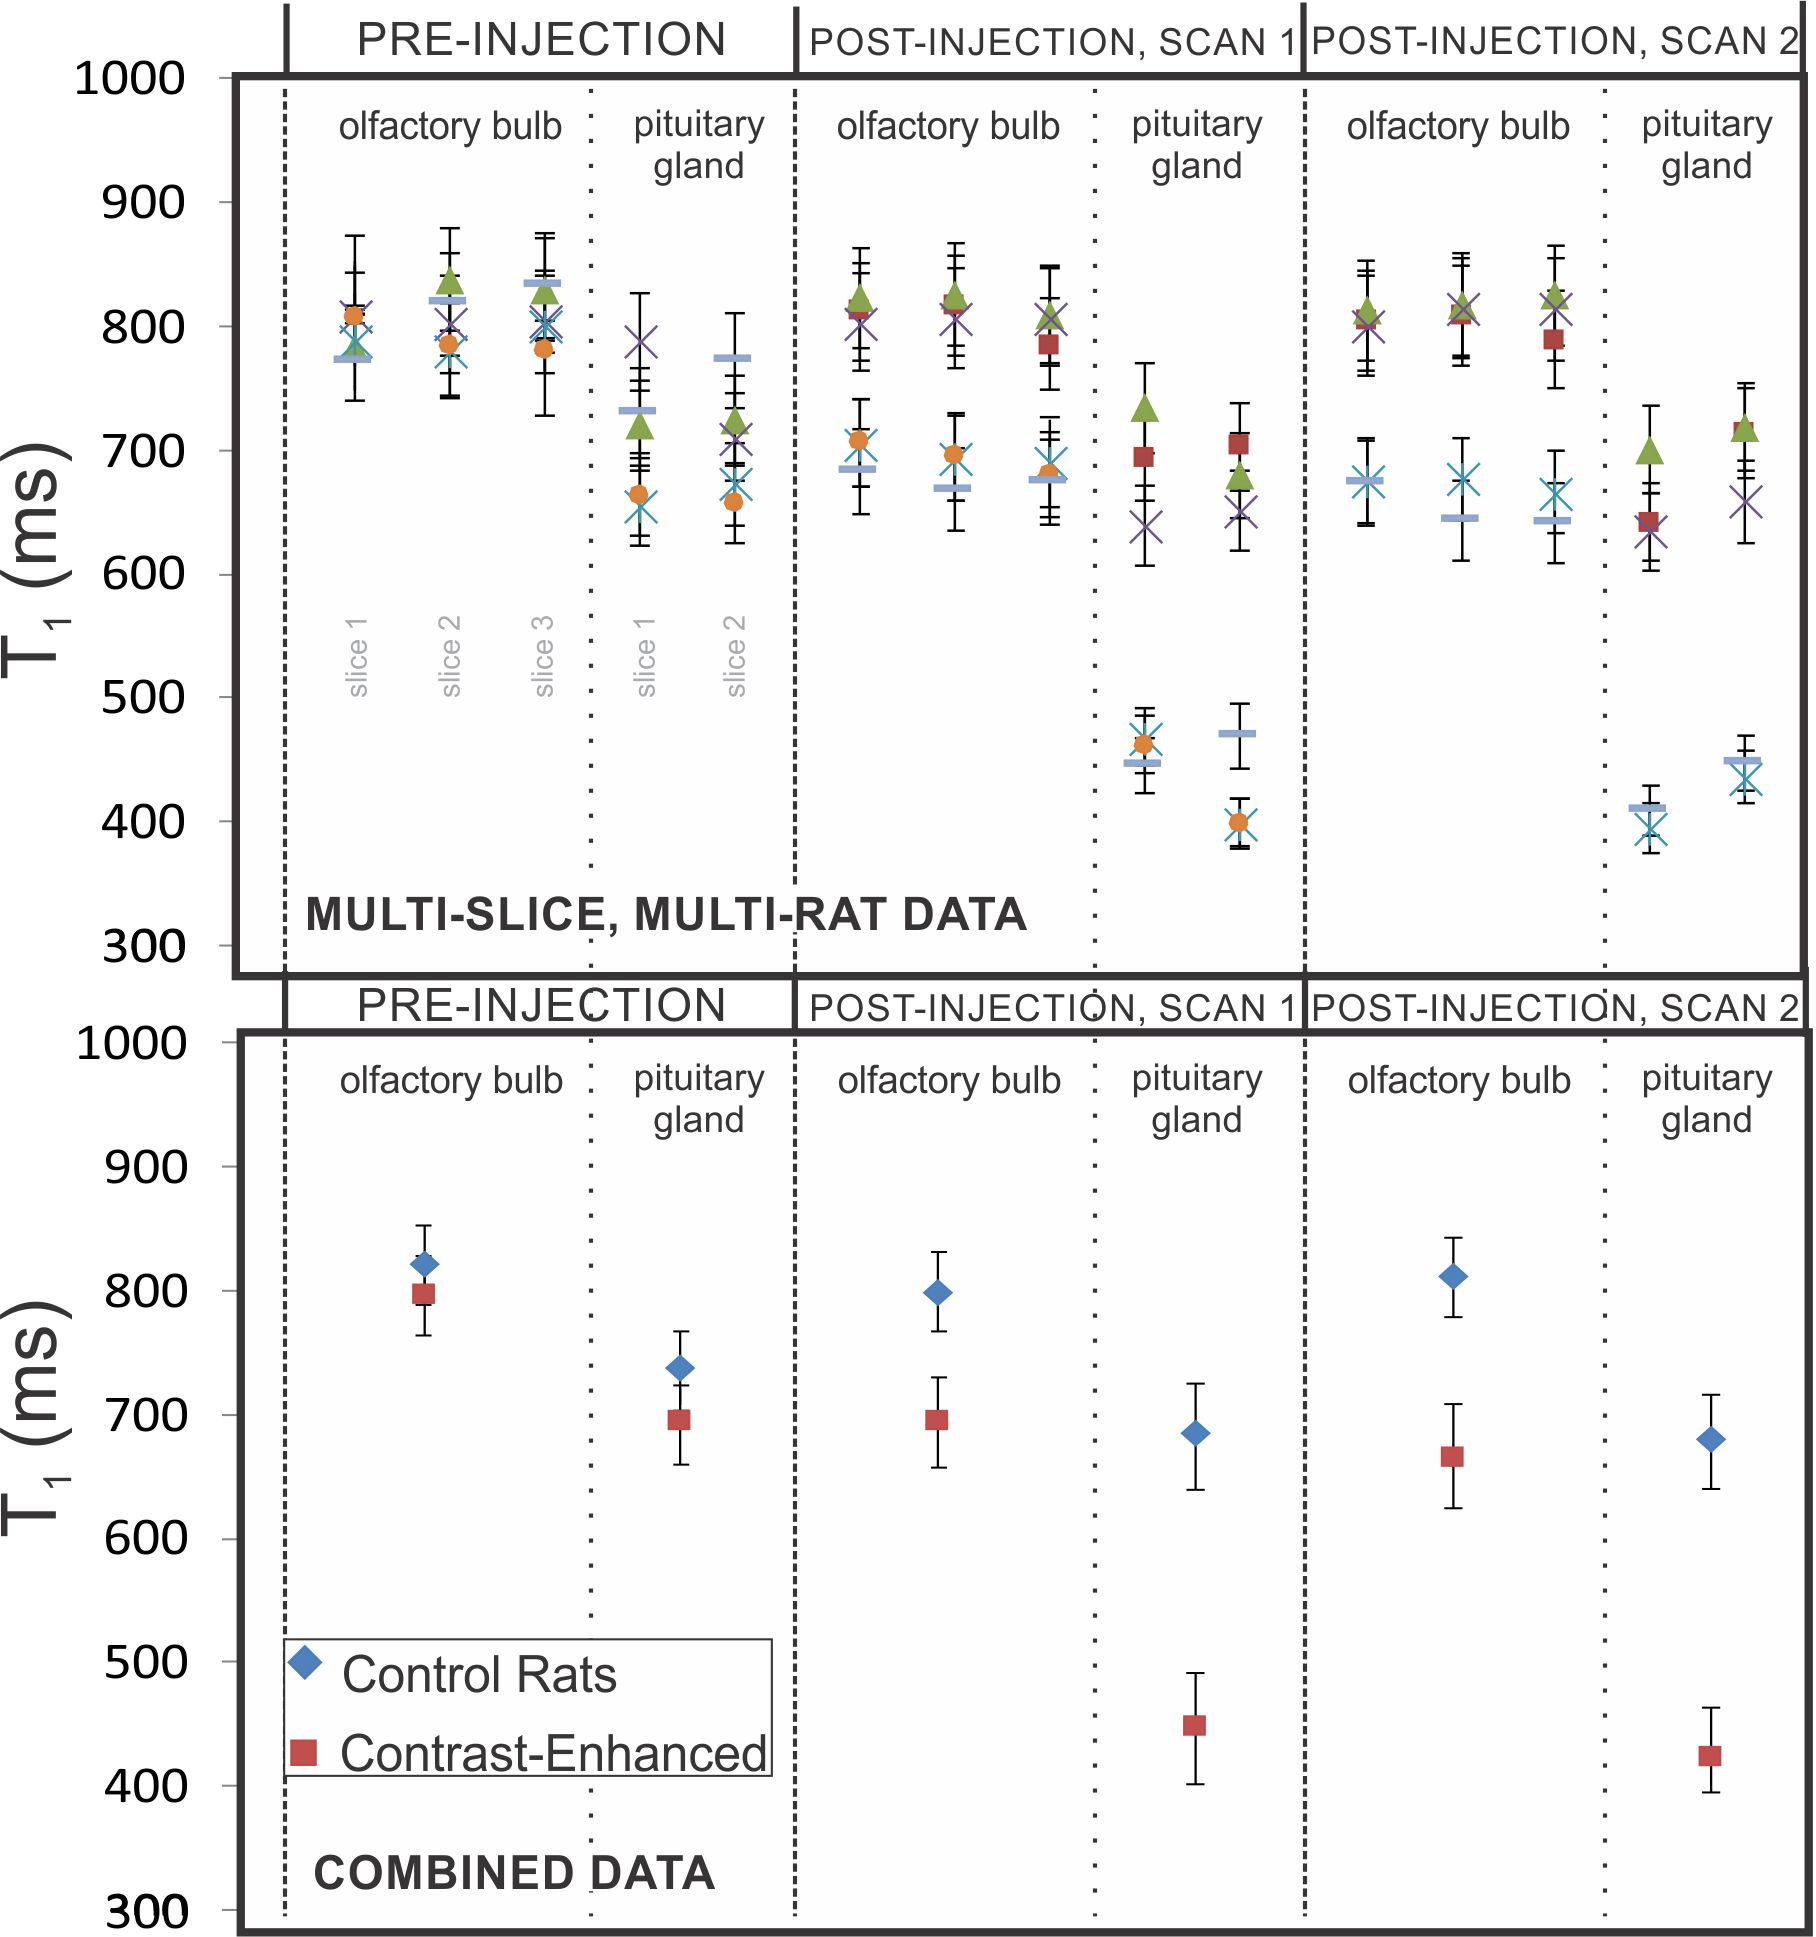
Fig. 2 (Top) Shows all the calculated T1 values for the olfactory
bulb and pituitary gland brain structures in 6 rats. Three slices were needed
to cover the olfactory bulb and two slices were needed to cover the pituitary
gland. (Bottom) Shows each grouping
of multi-slice/multi-rat data averaged to a single plot-point for clarity. “Control
rats” (3 in total) were given a saline injection just prior to post-injection
scan 1 & 2 and “Contrast-enhanced” rats (3 in total) were given MnCl2(aq)
injection just prior to post-injection scan 1 & 2. See
text for more details.
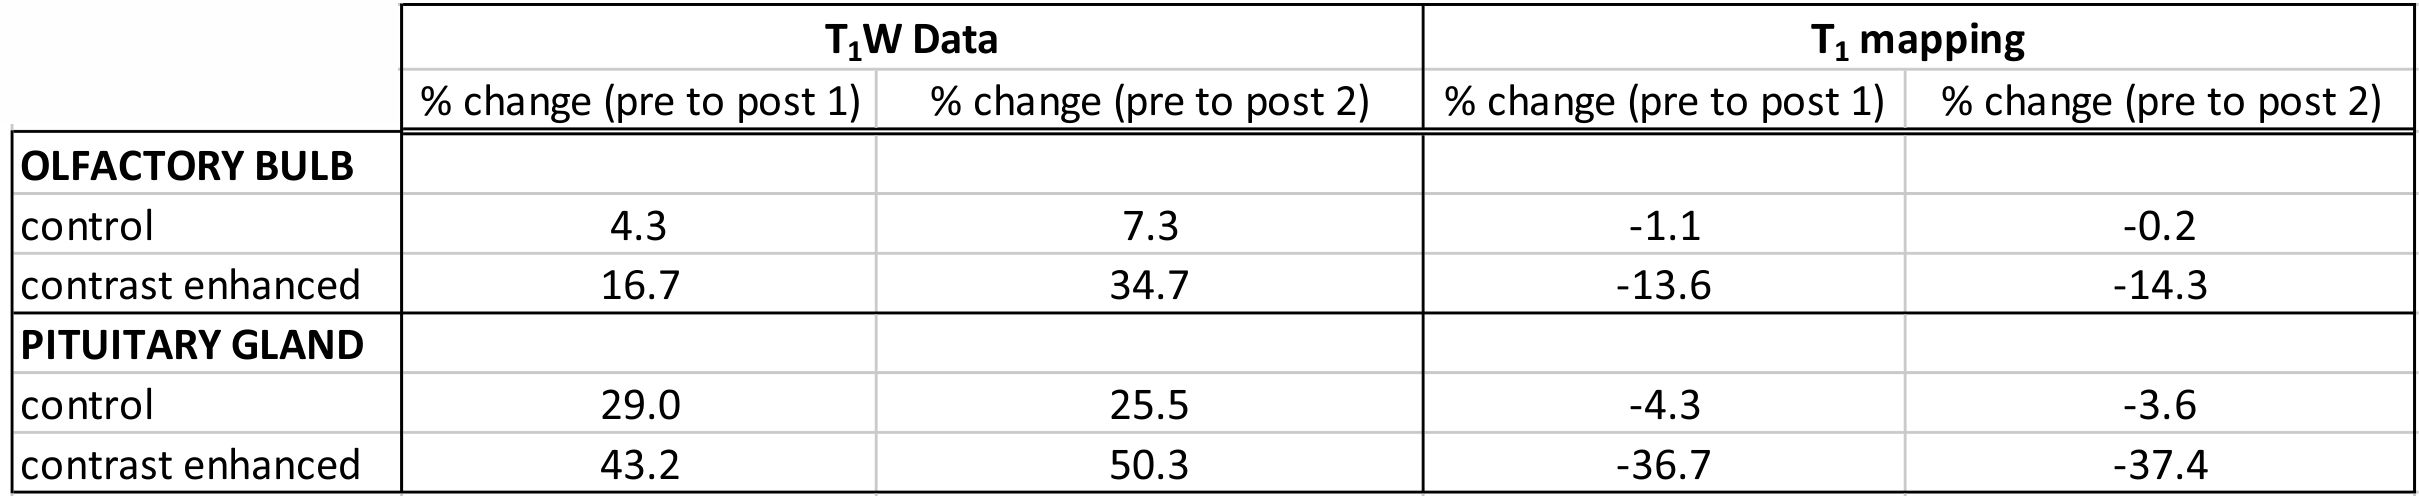
Table
1. Data summary for quantitative analysis of T1W
data (left two columns) and T1 mapping data (right two columns). Results are
the calculated % parameter change (normalized
average signal intensity in brain structure(s) for T1W and average absolute T1 value in brain
structure(s) for T1 mapping). Brain structures (i.e. Olfactory Bulb and
Pituitary Gland) are assigned in the far-left column.