3674
Optimized Fluorine-19 MRI Quantification and Characterization of Inflammation in Atherosclerotic Plaques in Mice at 3T1Department of Radiology, Lausanne University Hospital (CHUV) and University of Lausanne (UNIL), Lausanne, Switzerland, 2Center for Biomedical Imaging (CIBM), Lausanne, Switzerland, 3Division of Angiology, Lausanne University Hospital (CHUV), Lausanne, Switzerland, 4Department of Fundamental Oncology, University of Lausanne (UNIL), Lausanne, Switzerland
Synopsis
Establishing a direct quantification and monitoring of inflammation in diseases such as atherosclerosis in a clinical setting is one of the main goals of fluorine-19 (19F) MRI of perfluorocarbons (PFCs). To this end, with 19F imaging and a denoising algorithm, we demonstrated the feasibility of quantitative 19F MRI in small inflammation sites such as atherosclerotic plaques in mice at 3T (average PFCs concentration per plaque=0.49±0.10mM; average plaque volume=2.8±1.1mm3). In a second step, with imaging flow cytometry, we characterized and visualized the PFC-incorporating immune cell populations involved in the inflammation process, which were mainly dendritic cells, macrophages and neutrophils (ratio 9:1:1).
Introduction
One of the ultimate goals of fluorine-19 (19F) MRI of perfluorocarbon emulsions (PFCs) is the direct quantification and monitoring of inflammation in diseases such as atherosclerosis in patients in a clinical setting.1,2 To this end, two different aspects of the atherosclerosis inflammation process were investigated, namely quantification and characterization of the inflammation in the plaques. The first aspect was an optimization of the inflammation quantification through wavelet denoising. Given that 19F is not naturally abundant in the body and that the concentration of injected PFCs is relatively low, especially in atherosclerotic plaques in mice where the signal is often buried in the noise, 19F MR imaging with a sufficiently high signal-to-noise (SNR) ratio is challenging. Therefore, besides optimizing the pulse sequence, a potential image quality improvement is to apply a wavelet denoising filter during the image reconstruction. Here, the image is transformed to the wavelet domain, where undesired noise is stored in low-magnitude coefficients, while signal is concentrated in large-magnitude coefficients. After shrinking the low-magnitude coefficients, the undesired noise is removed without affecting the signal.3 The second aspect was the characterization of the cell populations that take up PFCs in the inflammation process of the atherosclerotic plaques through imaging flow cytometry, in order to better understand the mechanisms of signal generation in 19F MR images. Therefore, we here aimed to: 1) demonstrate the feasibility of optimized 19F MRI in small atherosclerotic plaques at 3T, including quantification after wavelet denoising, and 2) characterize and visualize the PFC-incorporating immune cell populations involved in the inflammation process.Methods
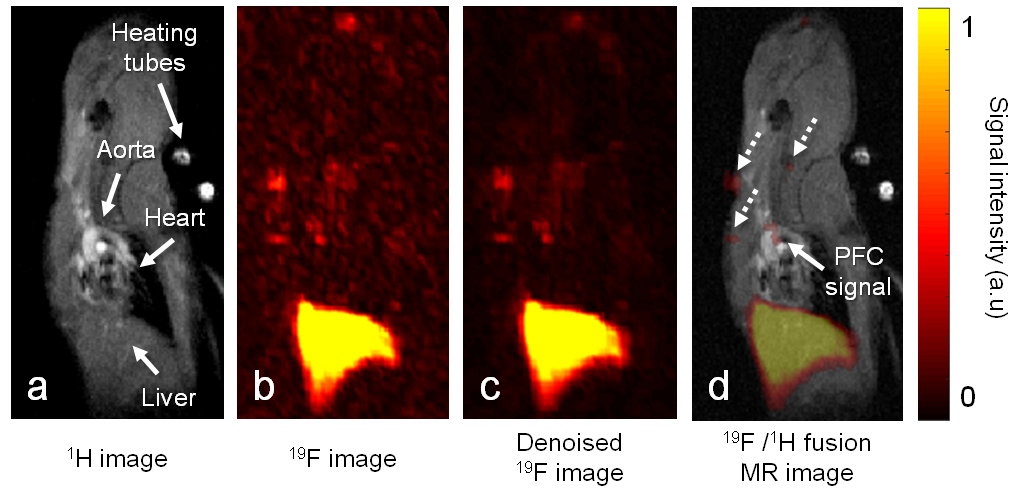
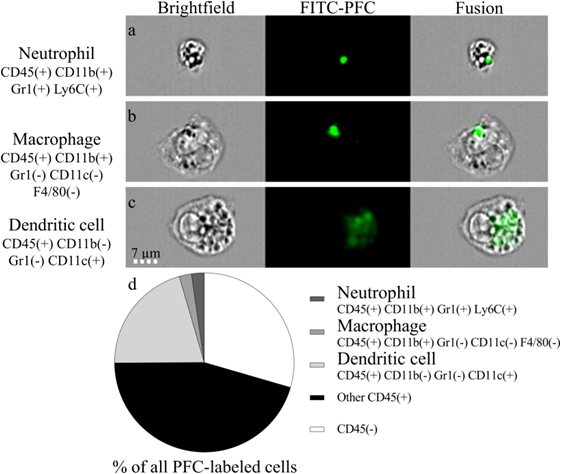
Images were acquired on a 3T clinical scanner (Prisma, Siemens) with a volume RF coil tunable to both 1H and 19F frequencies (Rapid Biomedical). An ECG-triggered 2D 1H GRE sequence was acquired for the localization of the plaques in the aorta and its branches, and an optimized 3D TSE pulse sequence4 (voxel size 0.78×0.78×1 mm3, echo train length 13, and TR/TE=1070/13 ms) was used for the acquisition of 19F images. C57BL/6 apolipoprotein-E-knockout (ApoE−/−) mice were fed with a high-fat diet to exacerbate atherosclerosis. Thirteen animals received 2×200μL of perfluoropolyether (PFPE, Celsense) intravenously, 1 and 2 days before imaging. An external reference with a fixed PFC concentration (CPFC=22mM) was placed next to the mouse and used for absolute quantification. Images were reconstructed with and without a wavelet denoising filter.5 The atherosclerotic plaques were segmented after 19F-1H co-registration and thresholding. The signal intensity of each plaque (SIplaque) relatively to the external reference was used in order to calculate the MRI-derived PFC concentration with both reconstruction schemes. The standard deviation of each SIplaque (SDplaque) was interpreted as an indicator of the precision in concentration measurement. The volume of the plaques (signal-volume) and the SI-signal-volume product (i.e. the 19F signal-integral) were also quantified. Five additional ApoE−/− mice were injected with fluorescein-isothiocyanate (FITC) PFPE and five control ApoE−/− mice were injected with non-fluorescent-PFPE for post-mortem imaging flow cytometry6 (ImageStream) to visualize all cells of the small aortic leukocyte populations.Results
In all mice, 19F MR hotspots were detected in the aorta or the brachiocephalic artery (Figure 1). SNR in the plaques in images with the standard reconstruction scheme was 7.8±1.8. The MRI-derived PFC concentrations were 0.56±0.09mM and 0.49±0.10mM (P=0.001) for the standard and denoised images, while the plaque signal-volume varied from 4.5±1.0mm3 to 2.8±1.1mm3 for standard and denoised images (P<0.001), respectively. SDplaque on average decreased by 47% from plaques of non-denoised 19F images to plaques of denoised 19F images. Among leukocytes, the PFC-labeled cells were mainly dendritic cells, macrophages and neutrophils at a ratio of 9:1:1. Small PFC spots were observed in macrophages (area=4.6±4.2µm2) and neutrophils (area=3.7±1.8µm2), as opposed to the dendritic cells (area=22.0±18.0µm2, Figure 2). The PFC signal-integral (area×relative brightness) for dendritic cells was ~20× higher than that of macrophages and neutrophils.Discussion and Conclusions
We demonstrated the feasibility of using 19F MR for the noninvasive quantification of PFCs at clinical magnetic field strength and in inflammation sites such as atherosclerotic plaques in mice. The lower SDplaque confirmed that wavelet denoising allows for increased precision in concentration measurement in 19F images. The significantly lower plaque size and concentration obtained from the denoised images were most likely caused by the discarding of very small signals by the wavelet filter. Through imaging flow cytometry, we characterized the plaques immune cell populations and demonstrated that the advanced plaques studied here contained more dendritic cells than macrophages, which agrees well with previous studies.7 In conclusion, we have developed a quantitative 19F MRI technique for inflammation studies of low-SNR signals on a human MRI system that contributes to the translation of 19F MRI to the human setting.Acknowledgements
This work was supported by grants from the Swiss National Science Foundation (PZ00P3-154719) to RBvH, as well as by the Centre d’Imagerie BioMédicale (CIBM) of the UNIL, UNIGE, HUG, CHUV, EPFL, and the Leenaards and Jeantet Foundations.References
1. Chen et al. Quantitative magnetic resonance fluorine imaging: today and tomorrow. Nanomed Nanobiotechnol. 2010.
2. van Heeswijk et al. Fluorine MR Imaging of Inflammation in Atherosclerosis Plaque in Vivo. Radiology. 2015.
3. Donoho et al. Adapting to Unknown Smoothness via Wavelet Shrinkage. Stanford University. 1994.
4. Colotti et al. Characterization of Perfluorocarbon Relaxation Times and their Influence on the Optimization of Fluorine-19 MRI at 3 Tesla. Magn Reson Med. 2016.
5. Yerly et al. Coronary Endothelial Function Assessment Using Self-Gated Cardiac Cine MRI and k-t Sparse SENSE. Magn Reson Med. 2016.
6. Basiji et al. Imaging flow cytometry. J Immunol Methods. 2015.
7. Choi et al. Flt3 Signaling-Dependent Dendritic Cells Protect against Atherosclerosis. Immunity. 2011.
Figures