3670
Time makes the difference: Comparison of ADC values obtained with OGSE and PGSE sequences for differentiation of human head and neck tumors1Department of Diagnostic Imaging and Nuclear Medicine, Graduate School of Medicine, Kyoto University, Kyoto, Japan, 2Hakubi Center for Advanced Research, Kyoto University, Kyoto, Japan, 3Department of Otolaryngology, Head and Neck Surgery, Graduate School of Medicine, Kyoto University, Kyoto, Japan, 4Siemens Healthcare GmbH, Erlangen, Germany
Synopsis
The correlation of ADC values with different diffusion times, as obtained from OGSE and PGSE, was investigated in patients with head and neck tumors. A significant decrease of ADC values in head and neck cancers was noted with the increase of diffusion time (p < .0.05). Care needs to be taken when interpreting OGSE-ADC and PGSE-ADC values, as flow effects will contribute to these values, which was suspected in light of the (artefactual) increase of ADC values using PGSE compared to OGSE.
Introduction
It is well known that ADC values strongly depend on diffusion time, stressing the need for a proper inscription of the actual diffusion time on clinical MRI scanners.1 Their change along diffusion times may provide important information to characterize tumor tissues and microstructures. Thus, our purpose was to investigate the correlation of diffusion parameters in patients with head and neck cancers, using the different diffusion times obtained from oscillating gradient spin-echo (OGSE) and pulsed gradient spin-echo (PGSE).Methods
This IRB approved prospective study included 10 patients diagnosed with head and neck tumors. Head and neck MRI was performed using a 3T system (MAGNETOM Prisma, Siemens Healthcare, Erlangen, Germany) equipped with a dedicated head and neck coil. DWI was performed with prototype sequences using b-values of 0 and 700 s/mm2, using a) OGSE with trapezoid cosine waveforms2 (frequency = 50 Hz; effective diffusion time = 4.3ms) and b) pulsed gradient spin-echo (PGSE) (diffusion gradient pulse duration [δ] = 10ms; diffusion gradient separation [Δ] = 86ms); repetition time/echo time, 7,000ms/113ms; field of view, 220×220mm2; matrix, 82×82; slice thickness, 5.0 mm; and acquisition time, 2min43sec for OGSE and 2min23 sec for PGSE. DWI was additionally scanned on a phantom with incorporated compartments exhibiting a range of ADC values using polyvinylpyrrolidone (10-40% PVP), covering clinical values from malignant to benign lesions.3 SPAIR and T1W images were also acquired and used as the anatomical reference for the delineation of ROIs in head and neck lesions and CSF (cerebrospinal fluid) space on ADC maps. A relative ADC change was calculated as (OGSE-ADC – PGSE-ADC) / OGSE-ADC x 100 (%). ADC values with different diffusion times were compared using Wilcoxon test, and ADC changes in different tissue types were compared using Mann-Whitney test.Results
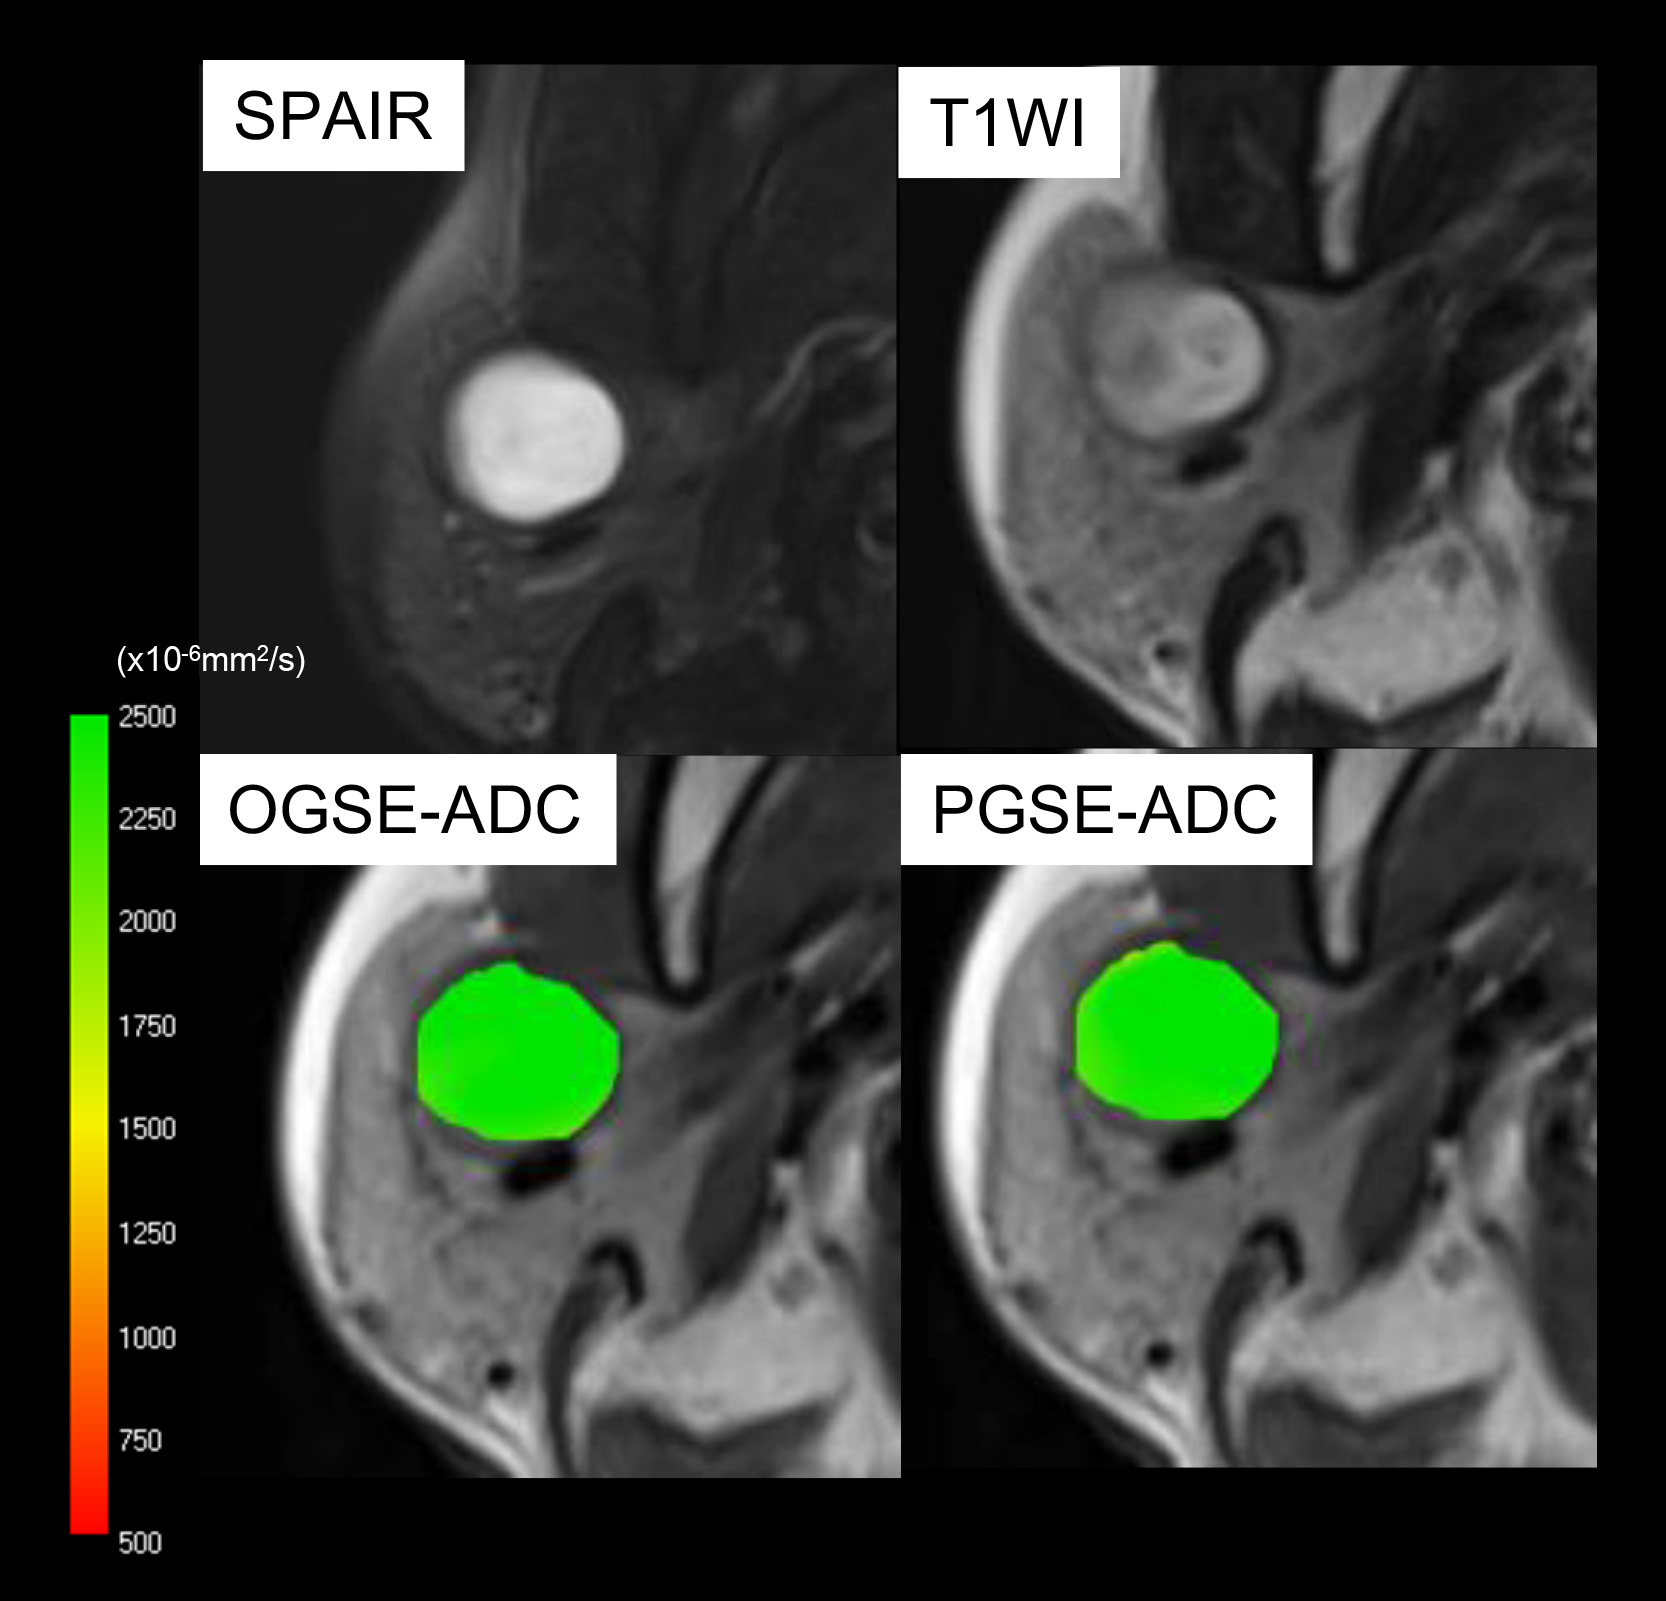
7 malignant and 4 benign head and neck lesions were included in the study. The representative ADC parametric maps of nasopharyngeal cancer are shown in Fig.1. There was a remarkable decrease of ADC values using PGSE compared to OGSE. Fig.2 demonstrates that ADC values do not change in (purely) cystic lesion. ADC values in various solutions of PVP also indicated almost no change of ADC values (0.2-1.1% of ADC change). Fig.3 summarizes the distribution of ADC values using OGSE and PGSE for malignant and benign lesions and CSF space. ADC values significantly decreased in malignant lesions, and increased in CSF with the increase of diffusion time (p < 0.05). There was no significant difference of ADC values between different diffusion times in benign lesions.
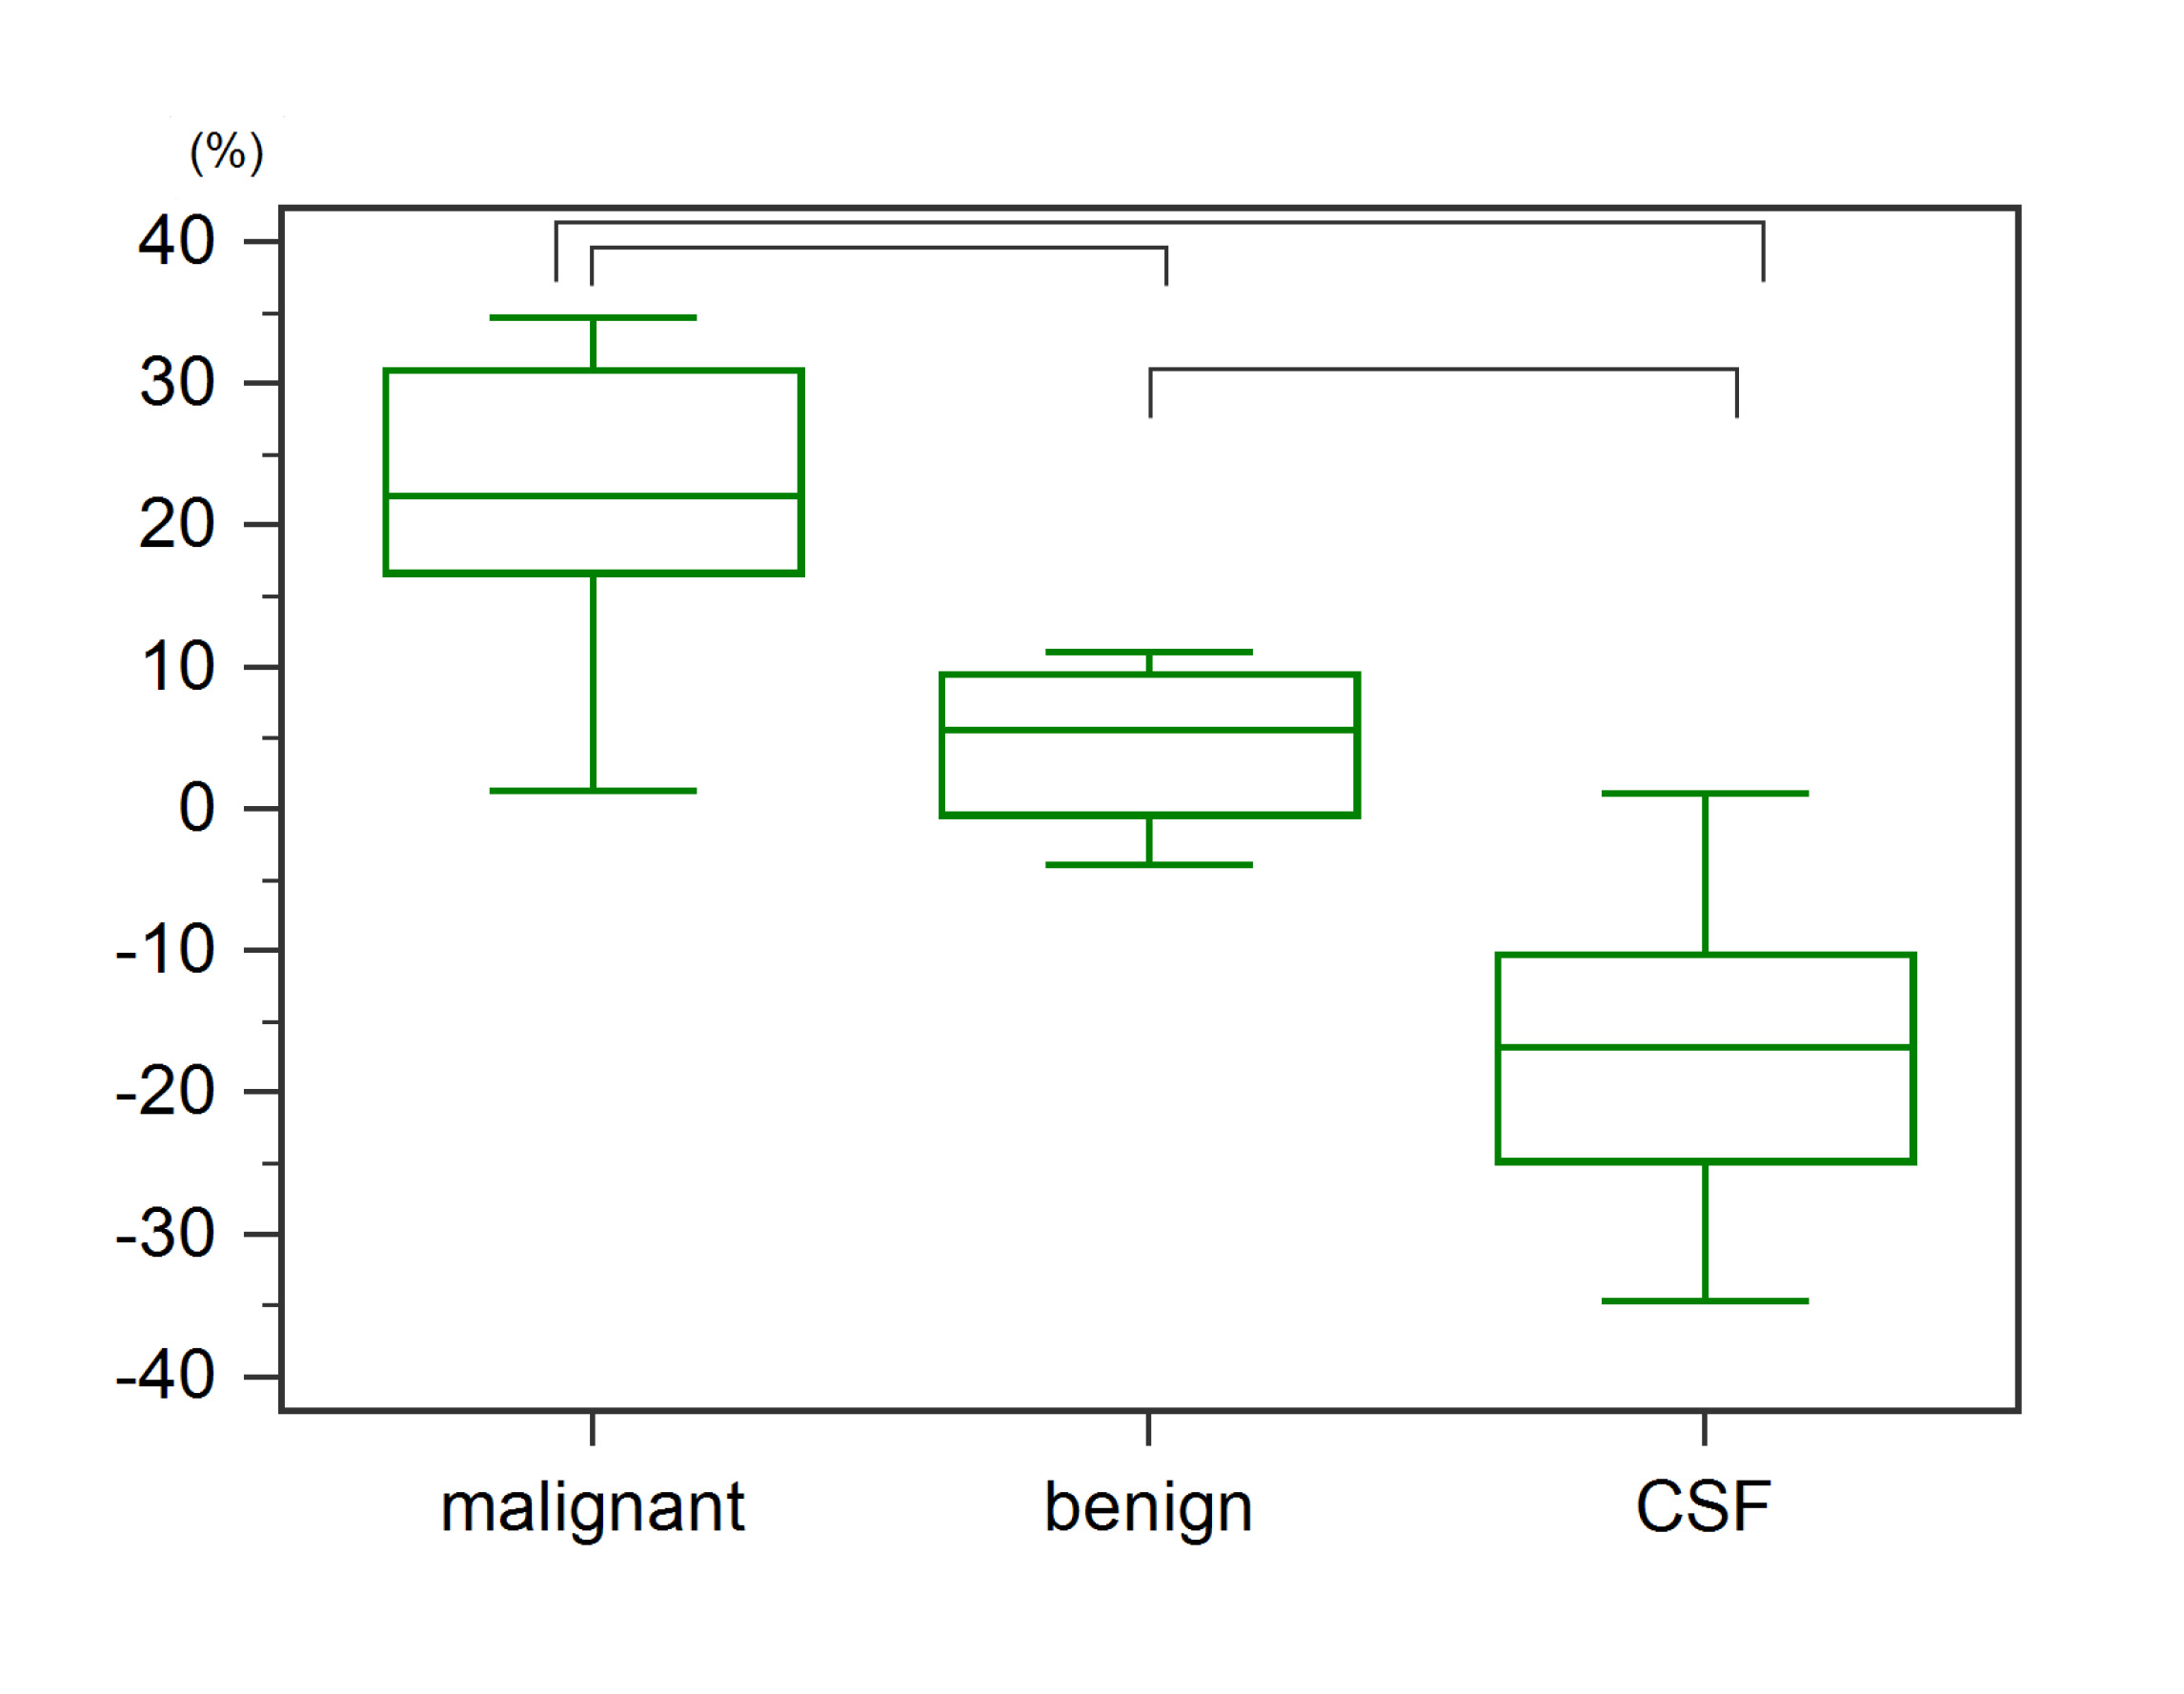
Relative ADC changes between OGSE-ADC and PGSE-ADC are summarized in Fig.4. ADC changes in malignant lesions were significantly larger than in benign lesions or CSF (p < 0.05). ADC changes in benign lesions were also significantly larger than in CSF space (p < 0.05). The negative change of the ADC value in CSF was related to flow effects which have different impact on the DWI signal for PGSE and OGSE.4 This explanation is further confirmed by the high ADC values found for CSF, both OGSE and PGSE, above the water diffusion coefficient.
Discussion
OGSE sequences which enable shorter diffusion times are currently evaluated in clinical settings, and diffusion-time-dependent ADC values have been investigated in intracranial epidermoid cysts5 or breast tumors.6 However, the clinical investigation to associate ADC values in head and neck tumors with different diffusion times has not been performed elsewhere as far as we know. The observed decrease of ADC values with the increase of diffusion time in tumors is well in agreement with the literature and our previous results.7,8,9 This suggests the hypothesis that diffusion hindrance increases with diffusion time in the tumor, as more molecules hit many boundaries, such as cell membranes. Significant difference in ADC changes between malignant and benign lesions indicate that comparing ADC values at different diffusion times, facilitated by OGSE sequences, might help increasing diagnostic accuracy for the differentiation of these lesions without the use of contrast agents. OGSE-ADC values in CSF space were significantly lower than those in PGSE-ADC: higher frequencies apparently yield smaller ADC values.4 In addition, MPG of cosine-waved OGSE is intrinsically insensitive to flow, while PGSE exhibits flow sensitivity. Accordingly, OGSE-ADC values might exclude flow effects, which results in smaller OGSE-ADC as compared to PGSE-ADC values. This is a pitfall which needs to be addressed since flow will affect ADC values more severely in PGSE as compared to OGSE, and ADC changes will hardly reflect diffusion hindrance correctly in this case.Conclusion
PGSE-ADC values exhibit a significant decrease as compared to OGSE-ADC values in head and neck cancers. Care needs to be taken in interpreting these results since flow effects might influence ADC changes, as observed in the CSF space.Acknowledgements
The authors would like to thank Mr. Katsutoshi Murata and Mr. Yuta Urushibata from Siemens Healthcare K.K. for the excellent and knowledgeable support.
This work was supported by Hakubi Project of Kyoto University and MEXT KAKENHI Grant No. 15K19786.
References
(1) Bourne R. The trouble with apparent diffusion coefficient papers. J Med Radiat Sci. 2015 Jun; 62(2): 89–91.
(2) Van AT, Holdsworth SJ, Bammer R. In Vivo Investigation of Restricted Diffusion in the Human Brain with Optimized Oscillating Diffusion Gradient Encoding. Magn.Reson.Med. 2014;71(1):83-94.
(3) Piperpaoli C, Sarlls J, Nevo U, et al. Polyvinylpyrrolidone (PVP) Water Solutions as Isotropic Phantoms for Diffusion MRI Studies. Proceedings of the 17th Annual Meeting of ISMRM, Honolulu, 2009, p. 1414.
(4) Does MD, Parsons EC, Gore JC, et al. Oscillating Gradient Measurements of Water Diffusion in Normal and Globally Ischemic Rat Brain. Magn Reson Med. 2003;49(2):206-15.
(5) Andica C, Hori M, Kamiya K, et al. Spatial Restriction of Intracranial Epidermoid Cysts Analyzed Using Diffusion-Weighted Imaging with Shorter Diffusion Times. Magn Reson Med Sci. 2017 in press.
(6) Li H, Arlinghaus L, Chakravarthy A, et al. In vivo imaging of mean cell size and density of human breast tumors. Proceedings of the 24th Annual Meeting of ISMRM, Honolulu, 2017, p.0863.
(7) Hope TR, White NS, Kuperman J, et al. Demonstration of Non-Gaussian Restricted Diffusion in Tumor Cells Using Diffusion Time-Dependent Diffusion-Weighted Magnetic Resonance Imaging Contrast. Front Oncol. 2016 2;6:179.
(8) Iima M, NobashiT, Imai H, et al. Investigation of diffusion signal behavior at different diffusion times in a human hepatocellular carcinoma xenograft model. Proceedings of the 24th Annual Meeting of ISMRM, Singapore, 2016, p. 3418.
(9) Iima M, Yamamoto A, Tateya I, et al. Comparison of non-Gaussian diffusion parameters using different diffusion times in head and neck tumors. Proceedings of the 25th Annual Meeting of ISMRM, Honolulu, 2017, p.2519.
Figures
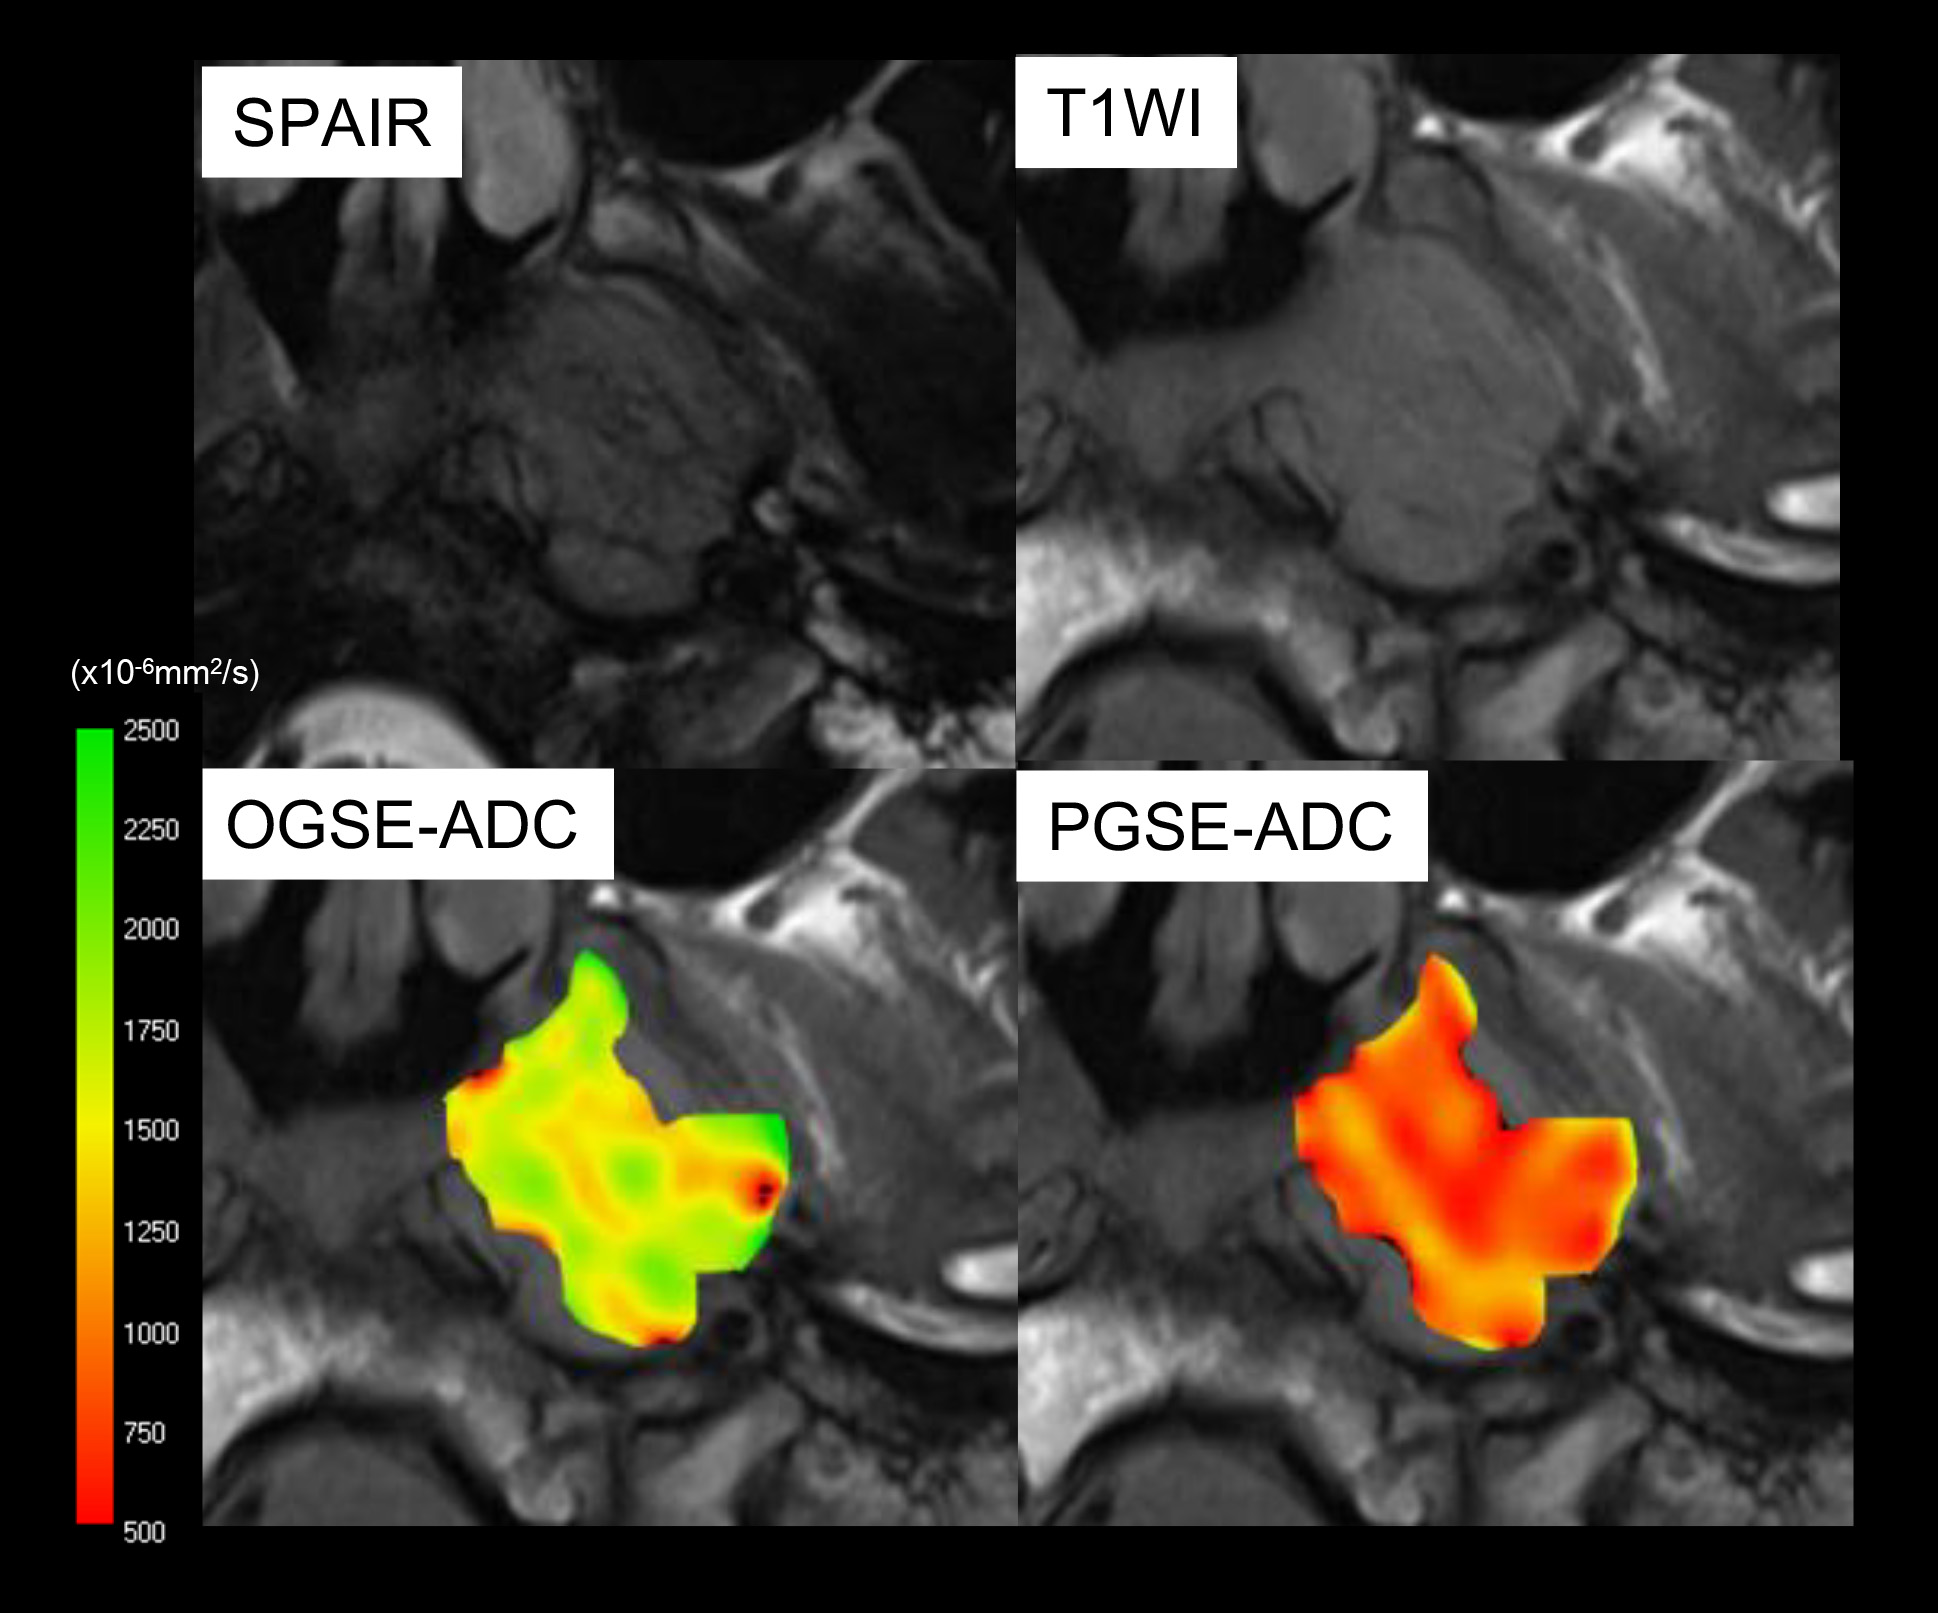
Figure 1: SPAIR and T1W images, and ADC maps using OGSE and PGSE of left nasopharyngeal cancer. PGSE-ADC values (red) of the tumor are remarkably lower than OGSE-ADC values (yellow-green). ADC maps of the lesion were overlaid to T1W images.