3668
Is MRI all we need? Prediction of conversion between normal cognitive function, mild cognitive impairment and Alzheimer’s disease1BioMedical Engineering, Georgia Institute of Technology and Emory University, Atlanta, GA, United States, 2Radiology and Imaging Sciences, Emory University, Atlanta, GA, United States
Synopsis
. In this study, we aimed to use machine learning methods to establish the quantitative value of MRI alone in the prediction of changes between disease states such as from normal cognitive function (NC) to mild cognitive impairment (MCI), and MCI to AD, and compare with the combined predictive power of MRI, PET, neuropsychological evaluations and CSF analysis. Very high overall accuracy can be achieved using both RF and DNN methods. Interestingly, predictive power of MRI features is very close to all features combined, suggesting MRI might contain much of the information provided by neuropsychological evaluations, PET scans among others combined. The methodology adopted in this study also provides a framework for evaluating the value of different imaging techniques in a quantitative manner.
Introduction
Recent clinical trials have shown that the reduction of amyloid burden does not lead to cognitive improvement in Alzheimer’s disease (AD)[1,2], which prompted for research efforts on the prevention and early interventions on high-risk patients. A number of potential predictive biomarkers are promising, including MRI, bioanalysis of cerebrospinal fluid (CSF), neuropsychological evaluations, positron emission tomography (PET), although their quantitative values have not been well established. In this study, we aimed to use machine learning methods (Random Forest and Neural Network [3]) to establish the quantitative value of MRI features in the prediction of changes between disease states such as from normal cognitive function (NC) to mild cognitive impairment (MCI), and MCI to AD, and compare with the combined predictive power of MRI, PET, neuropsychological evaluations and CSF analysis. We defined the goal of machine learning tasks as the prediction of the diagnosis status (NC, MCI or AD) at a future time point for a patient using metrics/features of the patient obtained at an earlier time point.Methods
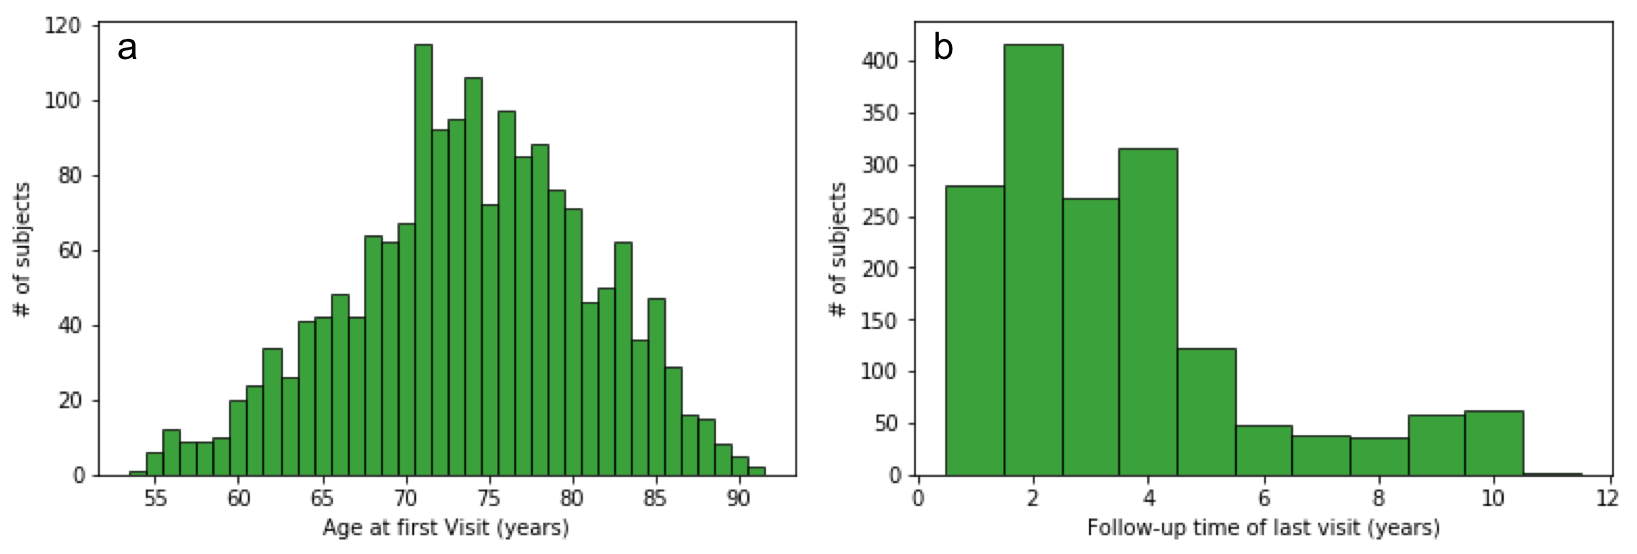
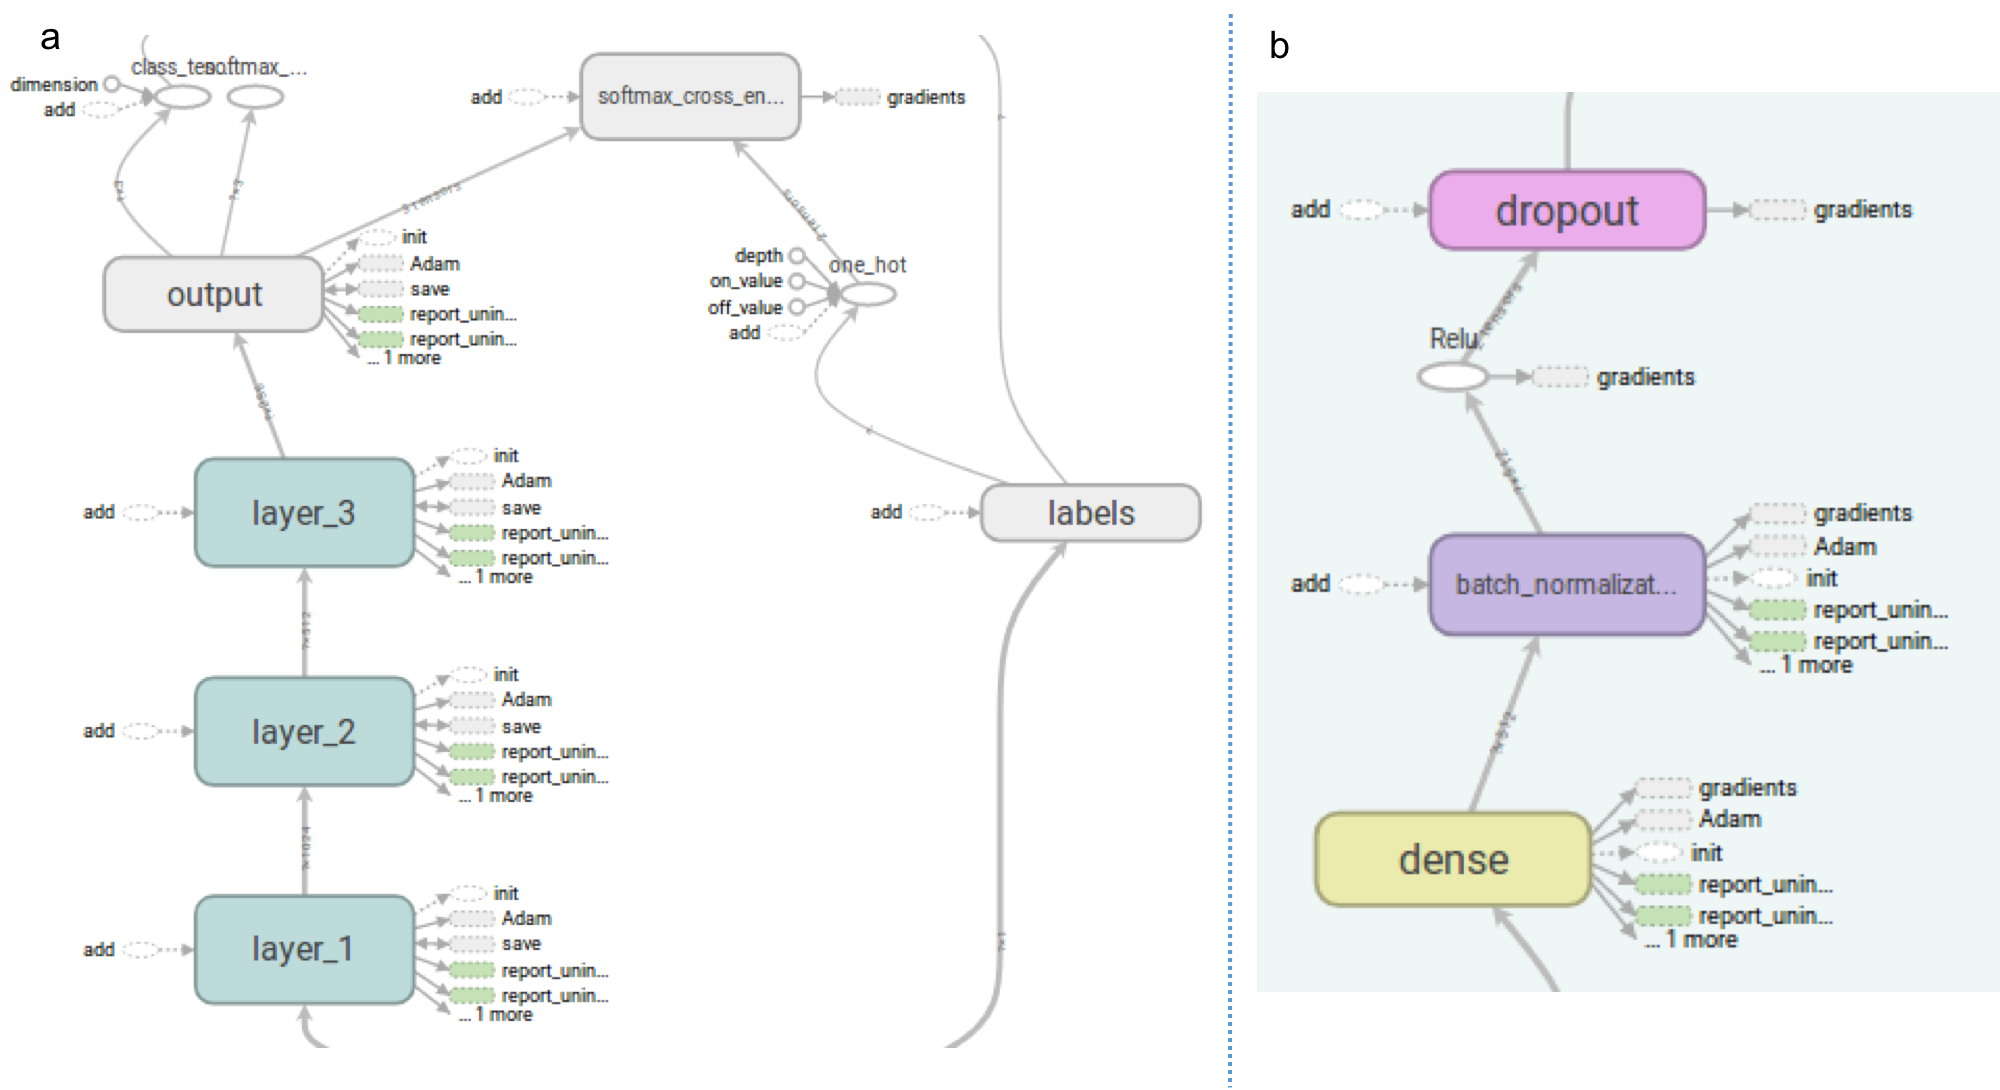
The data was obtained from Alzheimer’s Disease Neuroimaging Initiative (ADNI), prepared for the TADPOLE challenge (https://tadpole.grand-challenge.org/). A total of 1730 subjects were included with a mean±SD age of 73.8 ±7.2 years at their first visit, who had an average of 5.2 visits over 3.23±2.4 years. Figure 1 shows histograms of the number of subjects as a function of their age at the first visit and the longest follow-up duration. We compared the performance of predictive power of two sets of features: 1) the first feature set included Freesurfer output of T1-weighted image, subject demographic information (age, gender, race etc) and current diagnosis status; 2) the second feature set included all data available from the dataset including Freesurfer output of T1-weighted image, DTI, neuropsychological assessments, CSF biomarker, demographic information, current diagnosis status as well PET imaging metrics. In order to model progression of disease over time, the time between the visits (defined as ∆t) was entered specifically as a feature. Both Random Forest (RF) and deep neural network (DNN) were used in these prediction tasks. The data was partitioned to subsets for training and validation phases using the leave-last-time-point-out approach. Specifically, for a subject with N visits, all pairs of points from the first N-1 visits was included in the training dataset, and each of first N-1 visits was paired with the Nth visit and included in the validation dataset. For RF, we used an ensemble of 100 decision trees. Each tree was trained with a class balanced bootstrap sample of the training set, and the number of features to consider when looking for the best split is set as the squared root of the feature numbers as recommended for classification [4]. For DNN, we used a 3-layer neural network with 1024, 512, and 256 nodes for each layer (Figure 2, see figure caption for details).Results
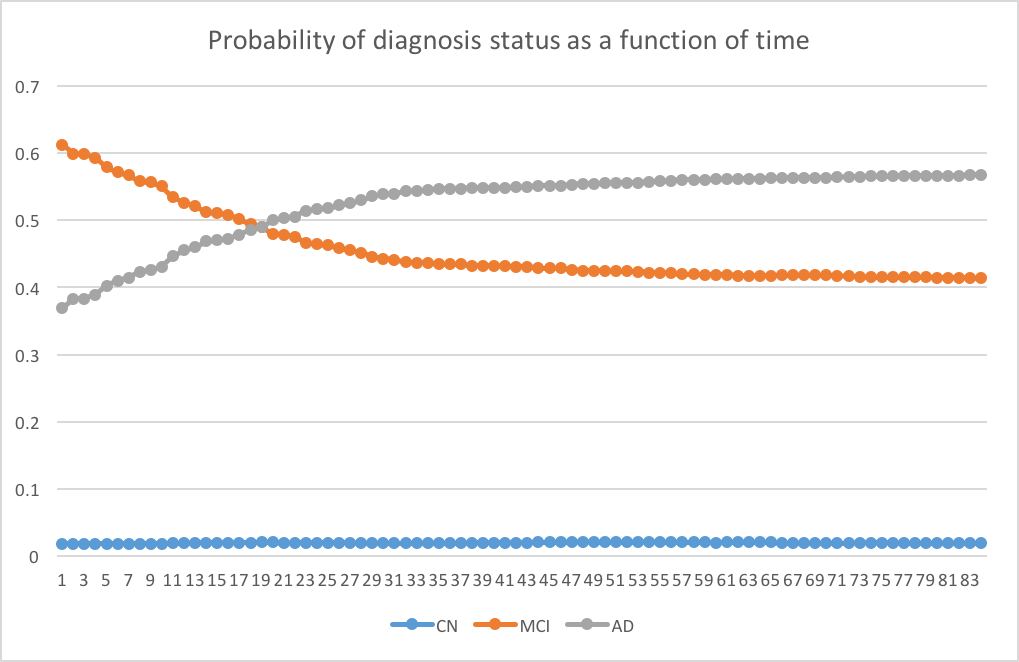
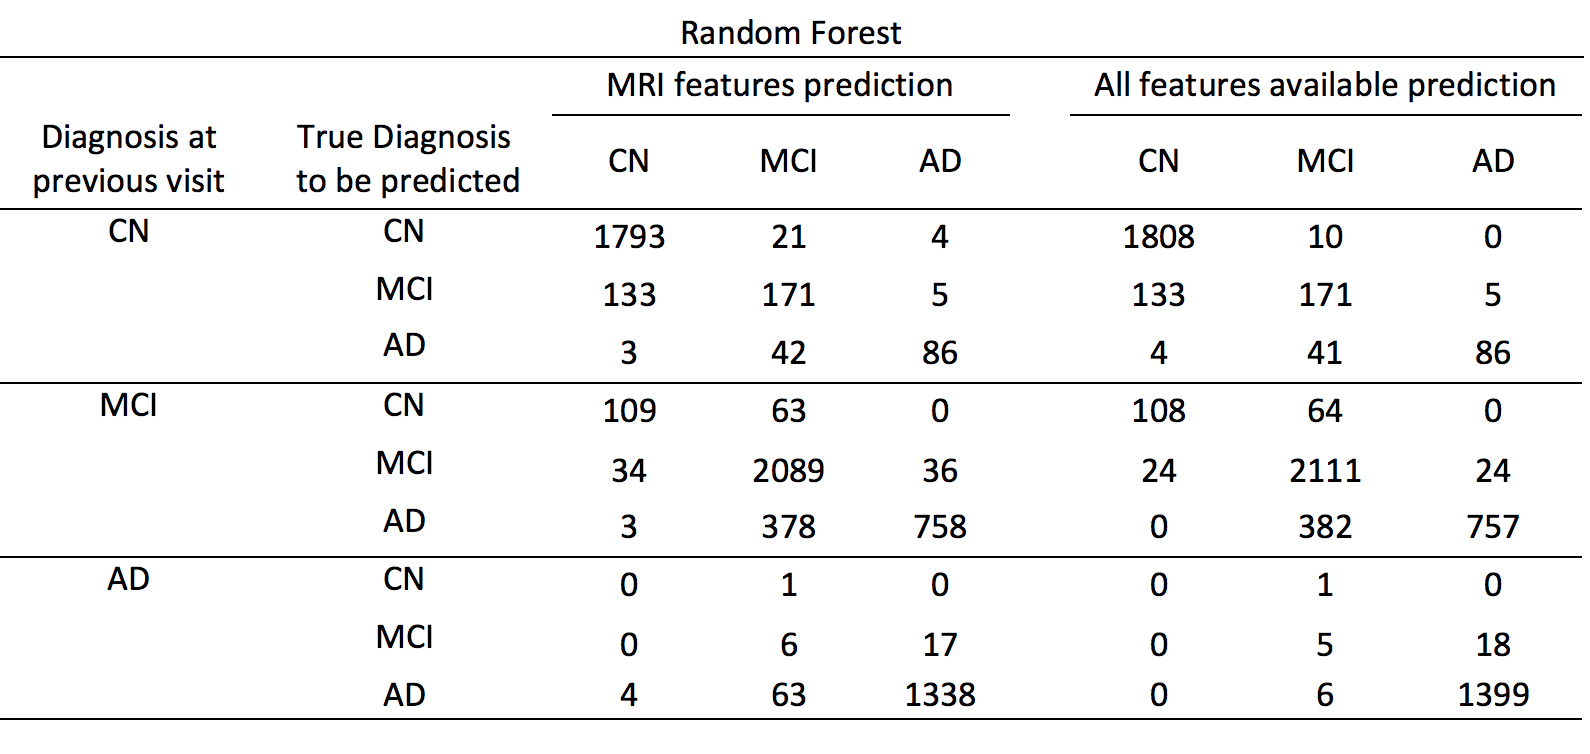
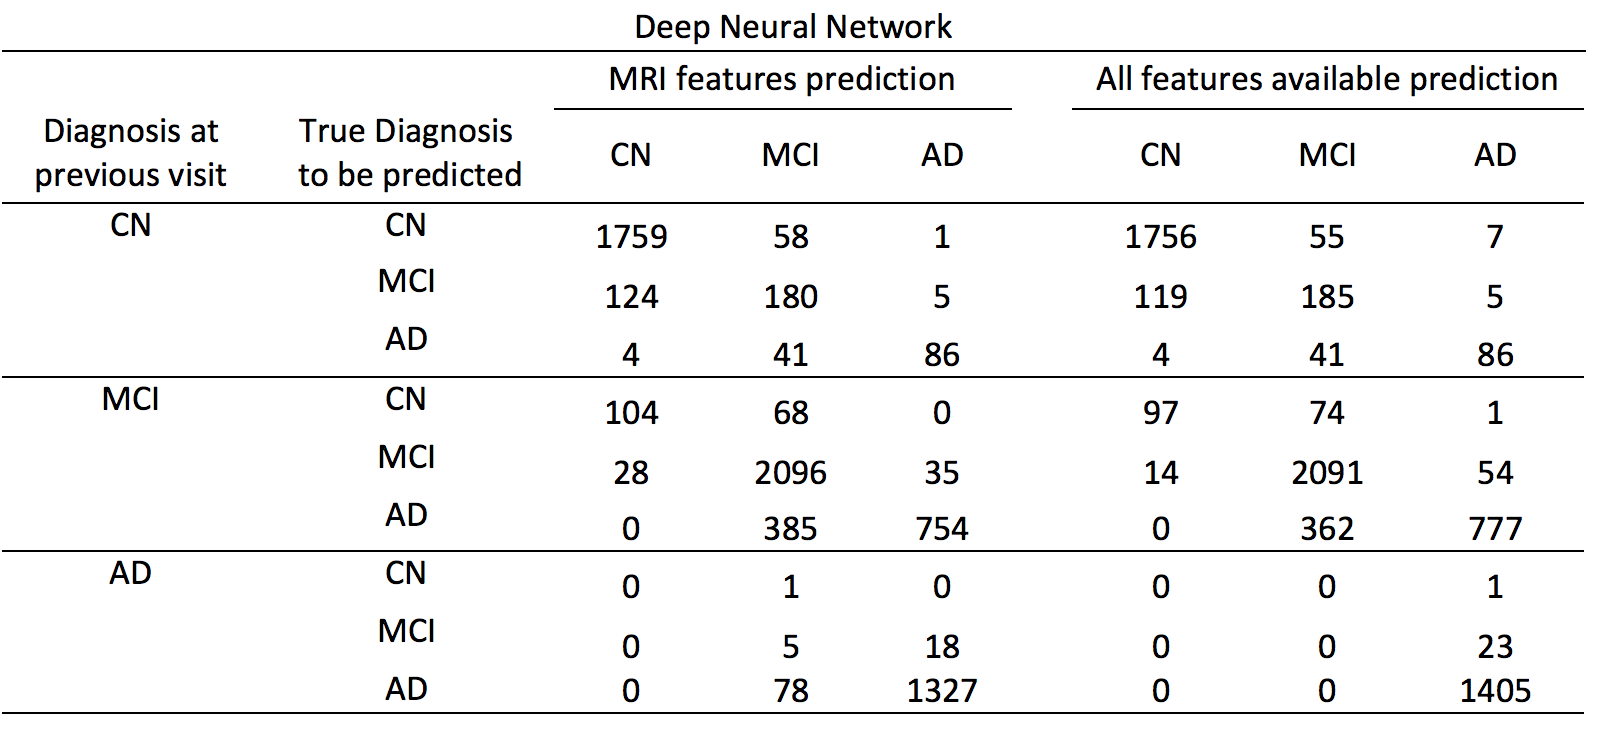
Both RF and DNN approaches were able to achieve prediction of conversion of disease diagnosis with relatively high accuracy (Table 1&2). Using all features available, the accuracy of the prediction was 90.1% and 89.4% for RF and DNN respectively. Using MRI features and demographic information only, the overall prediction accuracy was 88.7% and 88.2% for RF and DNN methods respectively. In all four cases, the positive predictive values in detecting conversion from a less severe disease state to a more severe state were high. For example, using the RF algorithm trained on MRI features, among the 794 cases where the initial diagnosis was MCI and the prediction was conversion to AD, 758 (95.5%) of them actually converted to AD; although the sensitivity in detecting such conversion was at a moderate value of 66.5% (758 out of 1139). Using the RF trained model, we predicted the probability of conversion for each subject in the future as a function of time since the last visit, as shown in an example in Figure 3.Discussions & Conclusion
We have successfully constructed models using both RF and DNN methods for the prediction of conversation between NC, MCI and AD. Very high overall accuracy can be achieved using both RF and DNN methods. While positive predictive values in detecting conversion to more severe disease are high, sensitivity in such detection needs to be improved. Interestingly, predictive power of MRI features is very close to all features combined, suggesting MRI might contain much of the information provided by neuropsychological evaluations, PET scans among others. The methodology adopted in this study also provides a framework for evaluating the value of different imaging techniques in a quantitative manner.Acknowledgements
No acknowledgement found.References
1. Doody RS, Thomas RG, Farlow M, Iwatsubo T, Vellas B, Joffe S, et al. Phase 3 trials of solanezumab for mild-to-moderate alzheimer's disease. The New England journal of medicine. 2014;370:311-321
2. Salloway S, Sperling R, Fox NC, Blennow K, Klunk W, Raskind M, et al. Two phase 3 trials of bapineuzumab in mild-to-moderate alzheimer's disease. The New England journal of medicine. 2014;370:322-333
3. Haykin, Simon (1998). Neural Networks: A Comprehensive Foundation (2 ed.). Prentice Hall. ISBN 0-13-273350-1
4. Liaw, Andy, and Matthew Wiener. "Classification and regression by randomForest." R news 2.3 (2002): 18-22.
5. Ioffe, Sergey, and Christian Szegedy. "Batch normalization: Accelerating deep network training by reducing internal covariate shift." International Conference on Machine Learning. 2015.
6. Nair, Vinod, and Geoffrey E. Hinton. "Rectified linear units improve restricted boltzmann machines." Proceedings of the 27th international conference on machine learning (ICML-10). 2010.
7. “Adam: A method for stochastic optimization.” Kingma, Diederik, and Jimmy Ba. arXiv preprint arXiv:1412.6980 (2014).
Figures