3667
Multivariate MR Biomarkers Predict Cognitive Decline in Mouse Models of Alzheimer’s Disease1Radiology, Duke University Medical Center, Durham, NC, United States, 2University of California, Berkeley, CA, NC, United States, 3Psychiatry and Behavioral Sciences, Duke University Medical Center, Durham, NC, United States, 4BIOGEN, Cambridge, MA, United States, 5Neurology, Duke University Medical Center, Durham, NC, United States
Synopsis
We propose a multivariate approach for characterizing mouse models of Alzheimer’s disease (AD), which integrates imaging and behavior in a joint analysis. We used manganese enhanced MRI (MEMRI) to identify brain areas associated with reduced performance in a spatial memory task. We quantified genotype differences based on morphometry, T1 weighted (T1W) signal and quantitative susceptibility maps (QSM). We find that the integration of multiple imaging biomarkers is a better predictor of cognitive decline, relative to using single biomarkers in isolation.
Introduction
Multifactorial mechanisms underlying Alzheimer’s disease (AD) are poorly understood. The complexity of these mechanisms and lack of integrative models hinder our understanding of AD, and the development of effective, disease-modifying therapies. Here, we characterized a mouse model of AD using an integrative perspective, which combines multiple MR contrasts, and behavioral markers characteristic of AD-like cognitive decline. We used manganese enhanced MRI (MEMRI) to identify brain areas associated with reduced performance in a spatial memory task. We quantified genotype differences based on morphometry, T1 weighted (T1W) signal and quantitative susceptibility maps (QSM). We find that the integration of multiple imaging biomarkers is a better predictor of cognitive decline, relative to using single biomarkers in isolation.Methods
Animals. 11 APPSwDI/mNOS2-/- (CVN-AD) models, and 13 mNOS2-/- controls, aged 75±4.38 weeks were implanted with continuous infusion minipumps (Durect Corp, Cupertino, CA, containing 100 µl of 64 µm/µl MnCl2.
Memory testing Over 5 days, mice received 4 trials, during which they swim to find a submerged platform. Behavior was measured using Ethovision (Noldus, Blacksburg, VA), and analyzed by repeated measure analysis of variance (ANOVA) with Greenhouse-Geisser correction.
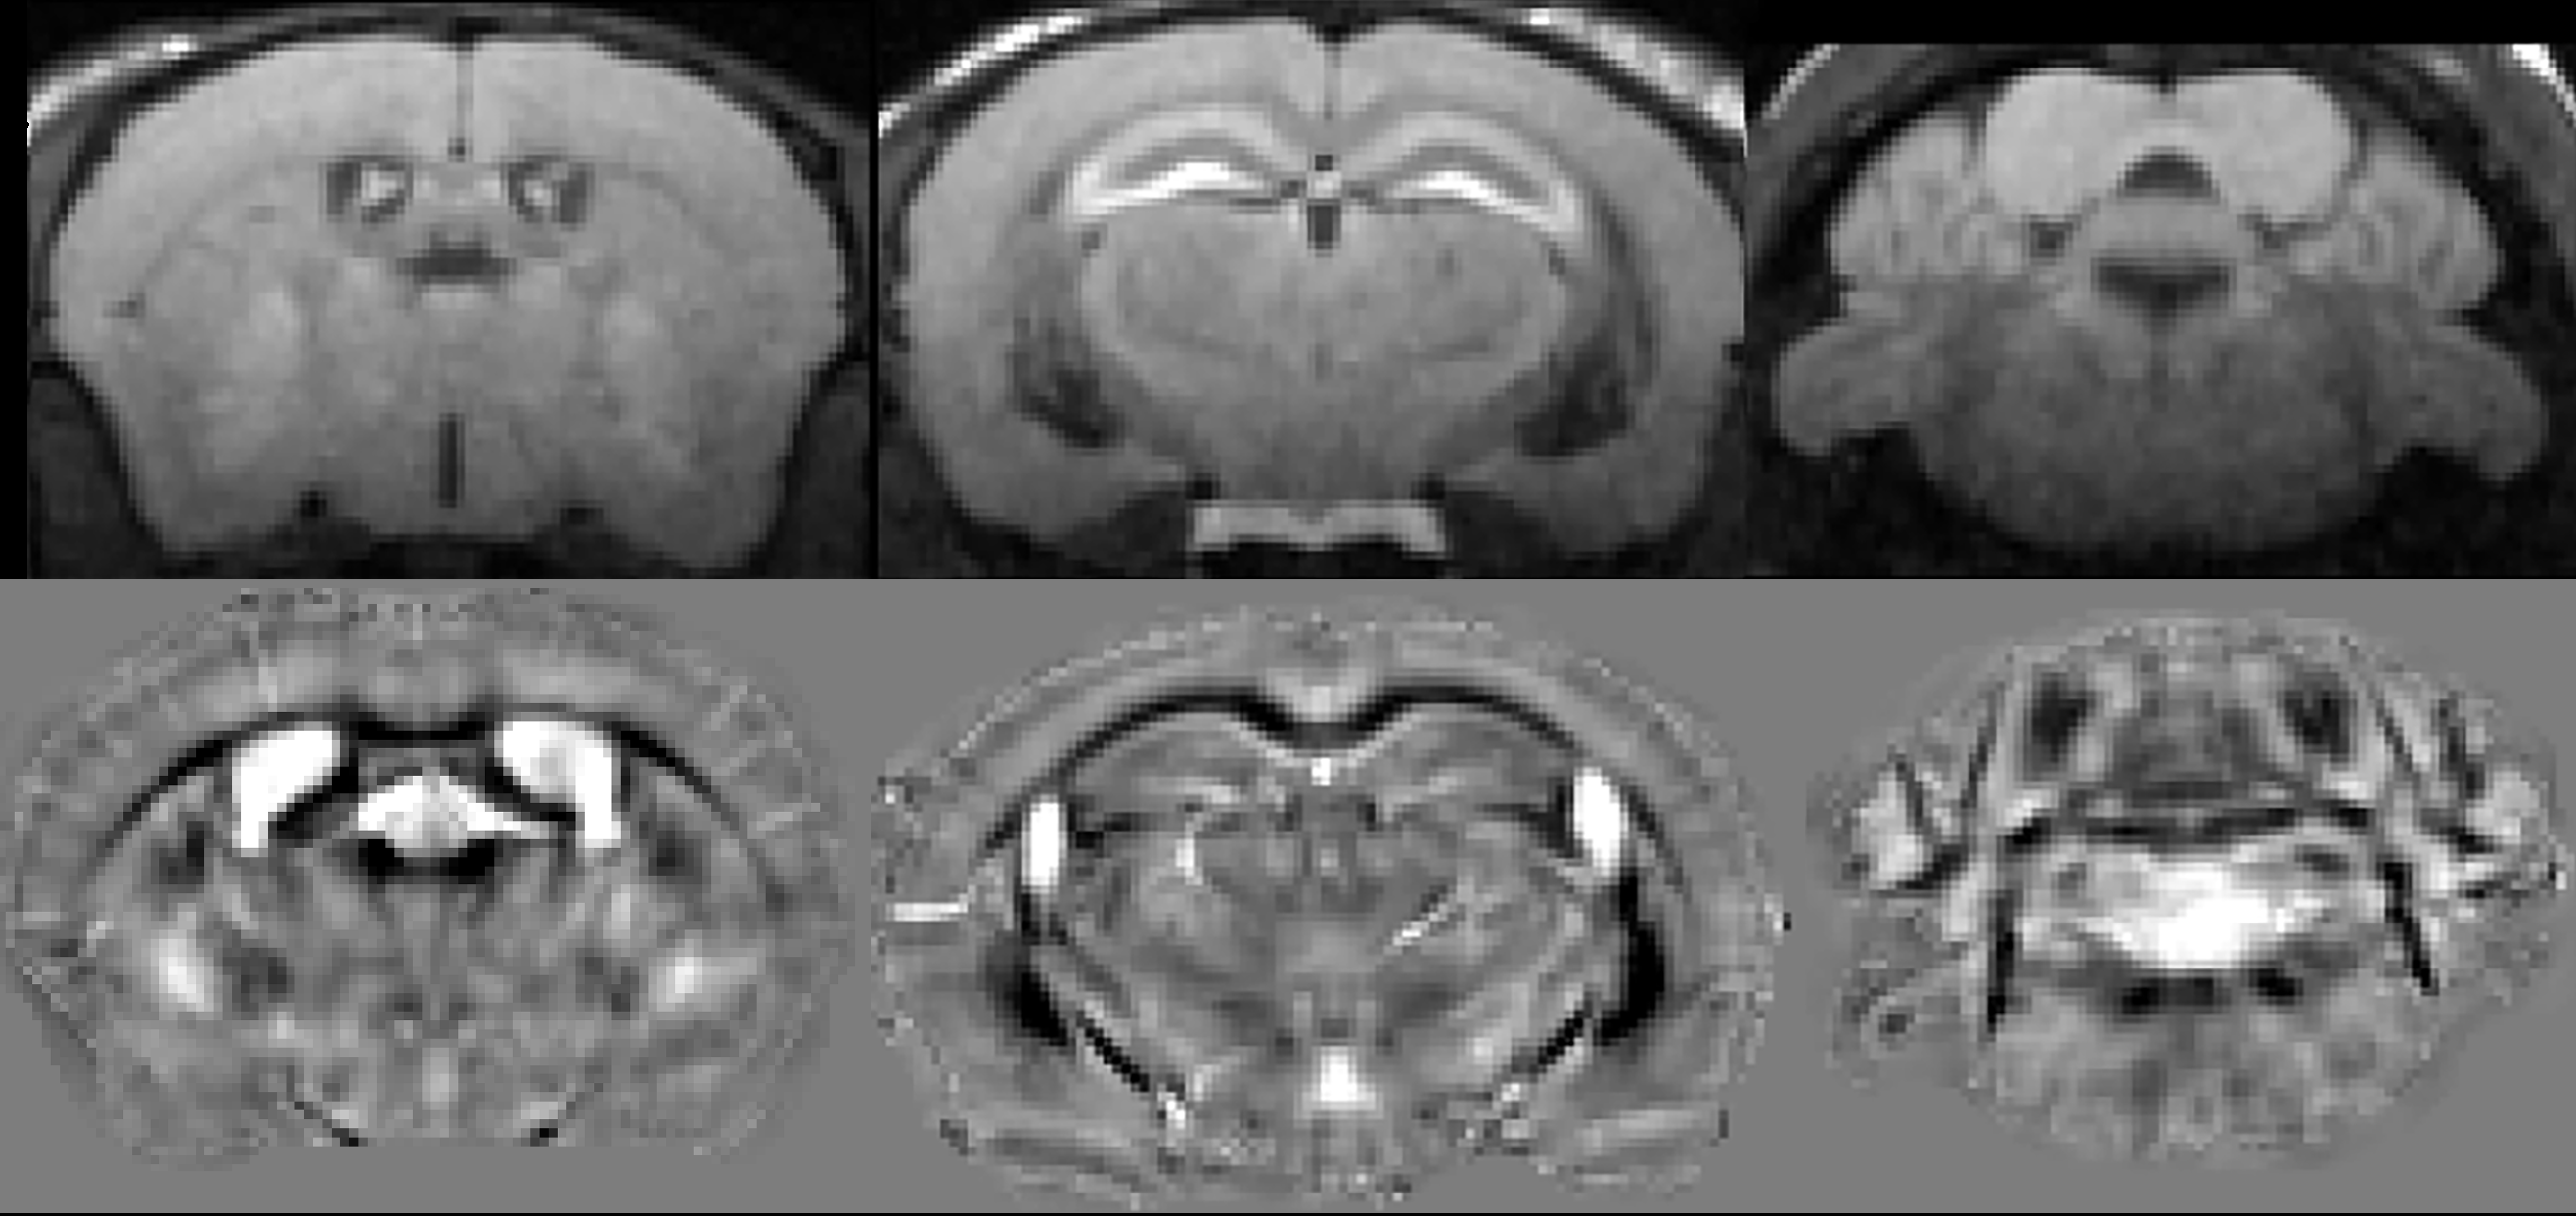
Imaging A 7 T magnet (Bruker BioSpec 70/20 USR, Billerica, MA) and a quadrature RF cryogenic coil were used to image the brain in vivo at 100 µm resolution. To quantify morphometric changes and manganese uptake we used a T1 weighted RARE sequence with FOV 2x2x1 cm, matrix 200x200x100, NEX=2, BW=100kHz , minTE=10.3 ms, spacing 10.3 ms, TR=150ms , 4 RARE partitions , acquired in 23 min. To calculate quantitative susceptibility maps (QSM) we used a respiratory gated multi echo GRE with FOV 1.92x1.92x0.9; matrix 192x192x90, 8 echoes with 5.5 ms spacing, NEX=1, TE1=3.9 ms; TR=100 ms, flip=30°, BW=62.5kHz, acquired in ~30-40 mins.
Image Processing. Images were bias field corrected (1), skull-stripped (2), and then averaged to create a minimum deformation template (MDT) (3, 4). The deformation fields mapping individuals to the MDT were used for morphometry. T1 weighted images were normalized to individual’s averages to quantify manganese uptake, and estimate neuronal activity. QSM were calculated using a two-step streaking artifact reduction reconstruction (5). For voxel-wise analysis, all images (log Jacobian, normalized T1w RARE, and QSM) were mapped into the MDT, and smoothed with a 200μm kernel. SPM (6) was used, with false discovery rate correction.
Predictive Modelling. We used sparse canonical correlation between imaging and behavior (7). We used a 0.5 anatomical prior initialization weight, 1% sparseness, 100 voxels cluster threshold, with 5 iterations, to predict behavior from imaging data, which were split into training and testing (75:25).
Results
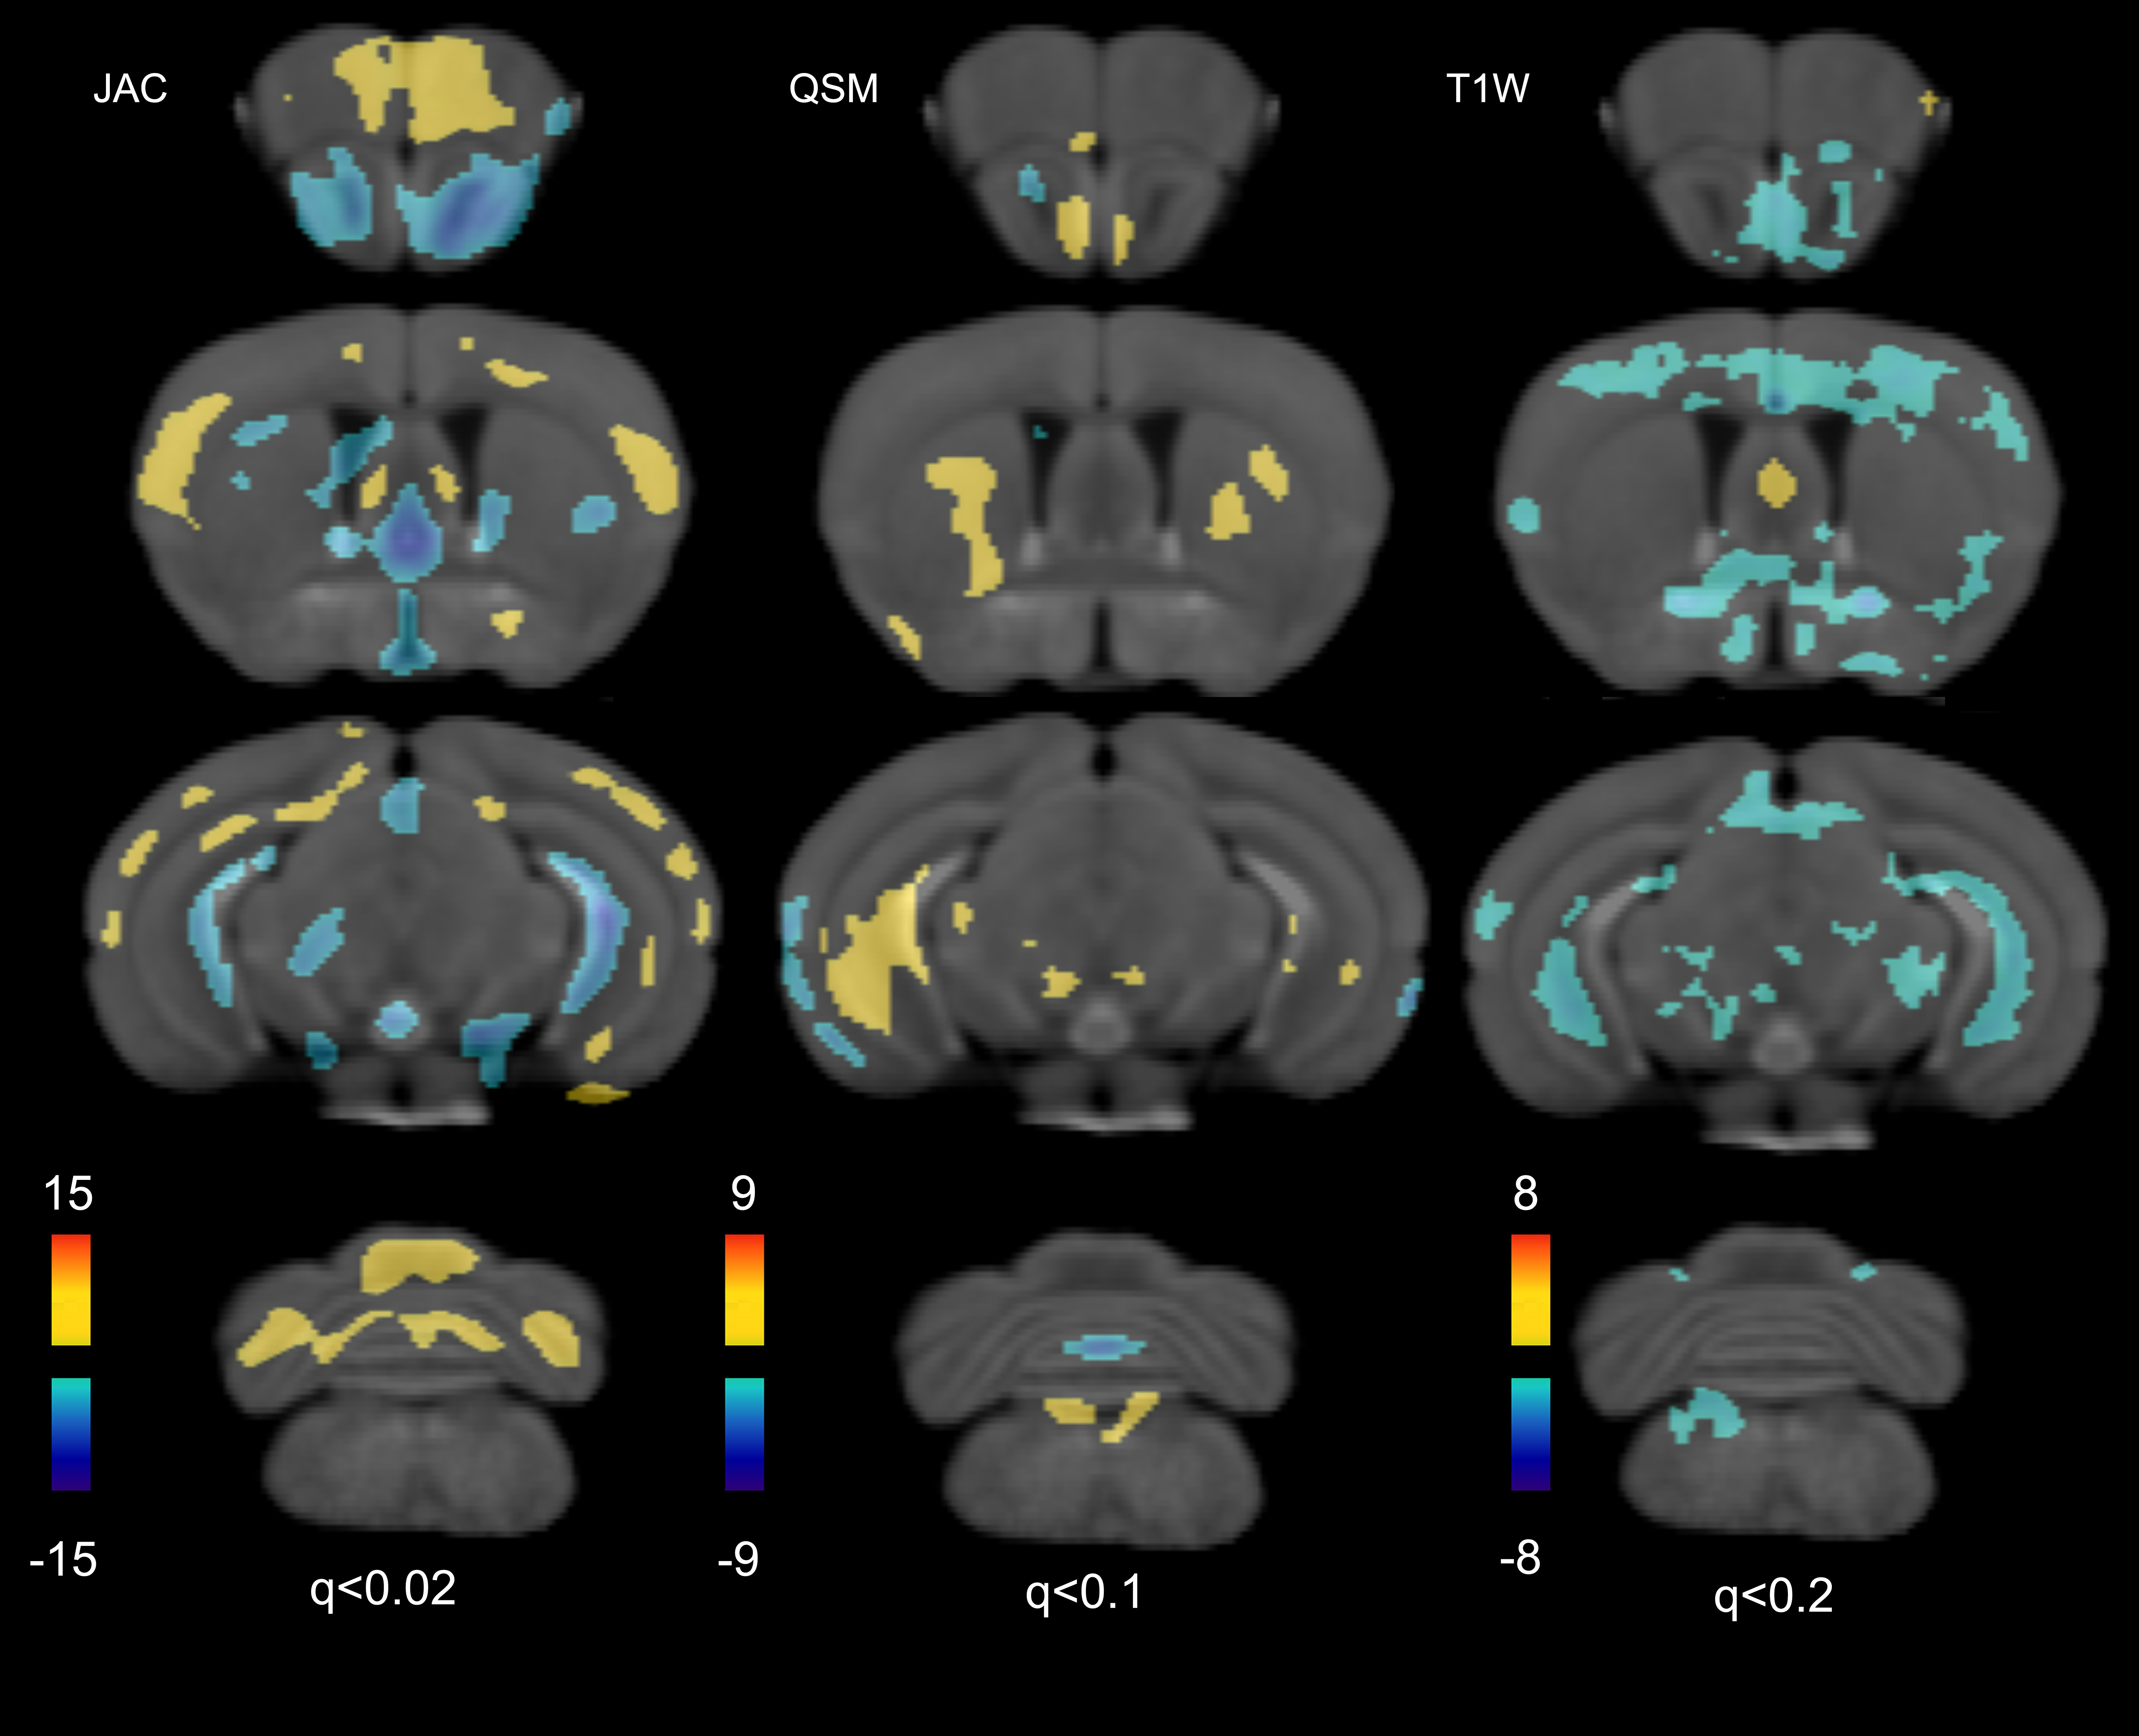
We phenotyped mouse models of AD based jointly on imaging and behavior. We developed imaging protocols (Fig 1) to characterize anatomy and memory, based on deformation fields, and manganese accumulation. Voxel based analyses revealed significant differences in volume, T1 signal, and QSM. All image contrasts identified differences in the olfactory areas and hippocampus (Fig 2). Atrophy in olfactory areas, thalamus, and hippocampus was associated with increased magnetic susceptibility, and lower manganese uptake. The hypothalamus, entorhinal cortex, hippocampus and subiculum presented QSM decreases. QSM increases were noted in the caudate putamen and red nucleus.
For swim distances we detected a significant effect of time (F(4,88) = 22.44, p= 8.55e-13), and a trend for the genotype*time interaction (F(4,88) = 2.45, p= 0.05). Swim distances (mean±standard error of the mean) were longer in CVN-AD mice on days 3 (772.47±77.27 cm, versus 423.23±71.08 cm, t=3.33, df=22, CI=[131.5, 566.9] cm, p=0.003); and 4 (823.31±80.29 cm versus 458.96±73.86 cm; t=2.44, df=22, CI=[43.9,536.6] cm, p=0.003); and a trend on day 5 (578.49±88.04 cm, versus 330.98±80.99 cm, p=0.05).
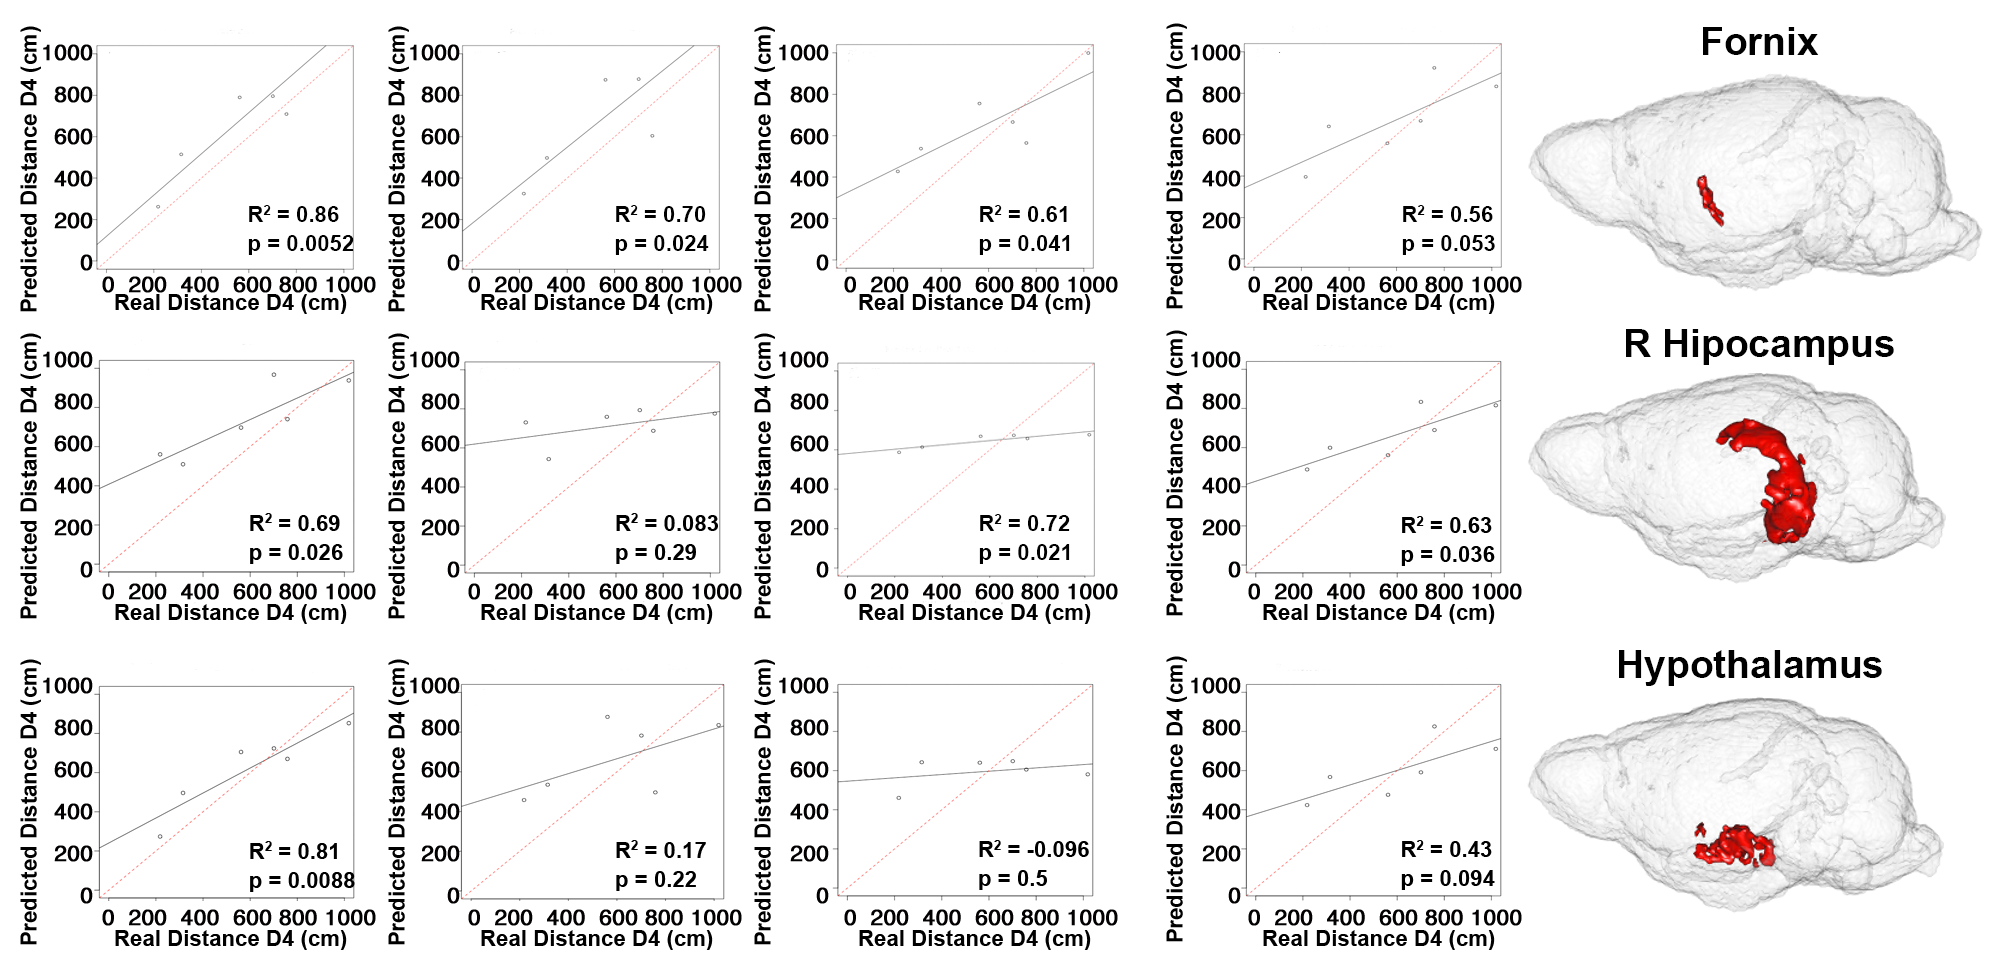
To test whether specific regions predict behavioral decline we used sparse canonical correlation between brain regions and swim distance (at day 4). These regions included the fornix, hippocampus, and hypothalamus (Fig 3). The strength, and significance of the relationships between imaging markers and behavior increased when the model included all three factors (volume, T1w, QSM), except for the hypothalamus where the full and reduced models performed well (full model R2=0.69, p=0.03; T1w signal model R2=0.72, p=0.02). Our results support the hypothesis that combining multivariate predictors enhances the predictive ability for cognitive decline, relative to single biomarkers.
Discussion
We developed MRI protocols for phenotyping mouse models of AD using structural and functional markers, since manganese accumulation after behavioral training reflects memory function. Morphometric changes were the most significant, followed by QSM and T1W signal. These effects may reflect reduced manganese uptake, but also myelin loss, amyloid, and abnormal iron deposition. Our results suggest that imaging biomarkers reflect pathological changes associated with memory function. Multivariate, integrative approaches provide promising tools for early detection and predictive modeling of cognitive decline, based on noninvasive imaging phenotypes.Acknowledgements
We thank Dr. G Allan Johnson for inspiring discussions, John Nouls for maintaining the 7 T magnet, James Cook and Lucy Upchurch for software and hardware support, Ramona Rodriguiz and Christopher Means for help with behavioral assays. This work was graciously supported by K01 AG041211 (Badea), R01 AG045422 (Colton), and R56 AG051765 (Colton). Imaging experiments were performed at the Center for In Vivo Microscopy, supported through P41 EB015897 (G Allan Johnson).References
- Tustison, N. J. et al. N4ITK: improved N3 bias correction. IEEE transactions on medical imaging 29, 1310-1320, doi:10.1109/tmi.2010.2046908 (2010).
- Badea, A., Ali-Sharief, A. A. & Johnson, G. A. Morphometric analysis of the C57BL/6J mouse brain. Neuroimage 37, 683-693 (2007).
- Avants, B. B. et al. The optimal template effect in hippocampus studies of diseased populations. Neuroimage 49, 2457-2466, doi:10.1016/j.neuroimage.2009.09.062 (2010).
- Avants, B. B., Tustison, N. J., Wu, J., Cook, P. A. & Gee, J. C. An open source multivariate framework for n-tissue segmentation with evaluation on public data. Neuroinformatics 9, 381-400 (2011).
- Wei, H. et al. Streaking artifact reduction for quantitative susceptibility mapping of sources with large dynamic range. NMR Biomed 28, 1294-1303 (2015).
- Ashburner, J. & Friston, K. J. Voxel-based morphometry - The methods. NeuroImage 11, 805-821, doi:10.1006/nimg.2000.0582 (2000).
- Avants, B. B. et al. Sparse canonical correlation analysis relates network-level atrophy to multivariate cognitive measures in a neurodegenerative population. NeuroImage 84, 698-711, doi:10.1016/j.neuroimage.2013.09.048 (2014).
Figures