3665
23Na-MRI demonstrates a sodium gradient within gliomas as a biomarker of tumor heterogeneity1Department of Radiology, University of Cambridge, Cambridge, United Kingdom, 2Cancer Research UK Cambridge Institute, University of Cambridge, Cambridge, United Kingdom, 3GE Global Research, Munich, Germany, 4Department of Clinical Neurosciences, University of Cambridge, Cambridge, United Kingdom
Synopsis
Glioma grade and the extent of local infiltration are important for guiding management. Imaging tumor heterogeneity may improve diagnosis and therapy planning. 23Na-MRI has been used here to demonstrate a gradient in sodium concentration across gliomas: necrosis > viable tissue > edema. This gradient was evident in all the tumors analyzed and is consistent with the expected underlying cellular microstructure where the sodium concentration is dominated by the extracellular fluid in edema and by an absence of cells in the necrotic core. The study provides evidence that 23Na-MRI represents an imaging biomarker of tumor heterogeneity and tissue microstructure in glioma.
Introduction
Gliomas are extremely heterogeneous, both structurally and biologically, which contributes to a very poor prognosis. The increase in mitotic activity within the tumor alters cell density which affects the total concentration of tissue sodium (approximately ten-fold higher outside the cell compared to the intracellular space). In addition, there is a decrease in Na+/K+-ATPase activity due to ATP depletion which leads to alterations in sodium concentrations. Detection of 23Na-MRI has the potential to quantify sodium concentration and therefore could be an imaging probe of cell morphology and membrane function within the tumor microenvironment, as well as heterogeneity.1–3 The purpose of this study was to evaluate sodium distribution within glioma and in the surrounding tissue.Methods
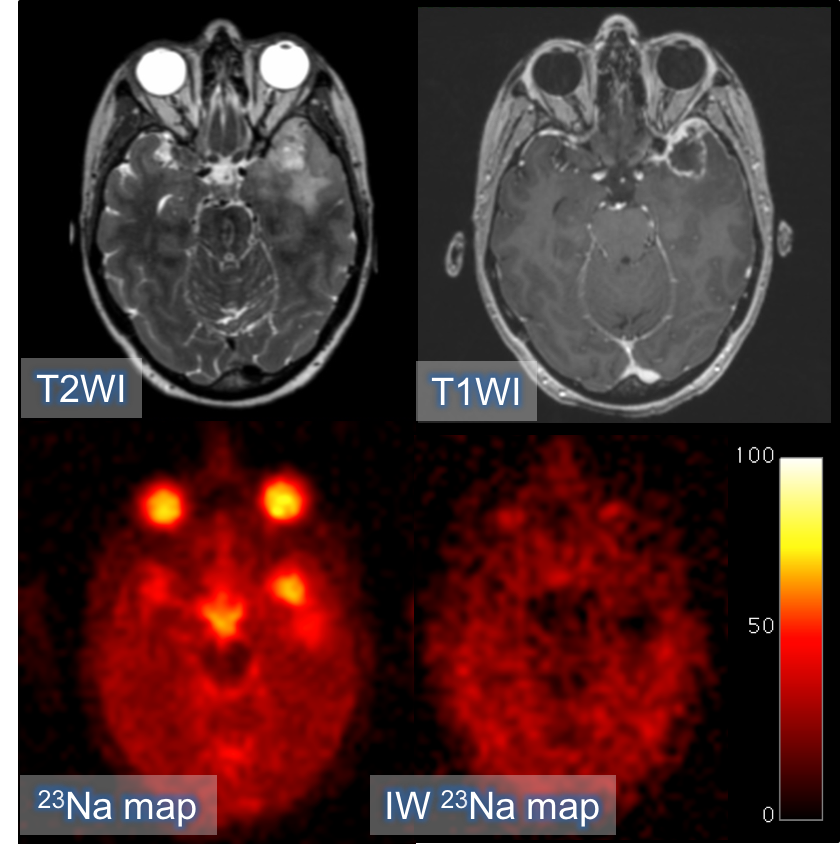
18 patients (age 51.4±21.4yrs) were imaged on a 3T clinical scanner (GE Discovery MR750; GE Healthcare, WI) using a Rapid Biomedical (Rimpar, Germany) dual-tuned 23Na/1H birdcage head coil. Sodium imaging was performed using an UTE sequence with 3D-Cones readout (nominal isotropic resolution = 3mm; TR/TE 100/0.5ms; scan time = 12 minutes).4 Intracellular-weighted sodium imaging was obtained using fluid suppression by inversion recovery (adiabatic inversion, TI = 30ms; nominal isotropic resolution = 3.75mm; TR/TE and scan time as before). Phantoms containing a known concentration of NaCl in 4% agar solution were used as calibrants.53D-T2WI (TR/TE 2500/79 msec; NSA 1; slice thickness 1.2 mm; acquisition matrix 320x320; FOV 240x240 mm), and post-gadolinium 3D-T1W (1.5mm isotropic resolution reconstructed to 1mm isotropic; TR/TE 8.16/3.18ms; NSA 1; slice thickness 1.5 mm; matrix 256x256; FOV 240x240 mm; Gadobutrol 1.0 mmol/mL) sequences were used for image registration (SPM8, UCL, UK). A neuroradiologist drew the regions-of-interest (ROIs) on the 3D-T2WI and the 3D-T1WI post-Gd sequences using OsiriX (Pixmeo Sarl). Differences between tumor, basal ganglia and white matter in total sodium concentration (TSC) and intracellular sodium concentration (IW-SC) were tested using the paired samples t-test.
Results
Pathological diagnosis of the High Grade Gliomas (HGG) was GBM IDH-wildtype in 7 cases and gliosarcoma, oligodendroglioma, anaplastic ganglioglioma, anaplastic ependimoma and anaplastic astrocytoma IDH-mutant in 1 case each. The Low Grade Gliomas (LGG) were 1 LGG IDH-mutant, 1 oligodendroglioma, 1 diffuse astrocytoma IDH-mutant and 1 diffuse astrocytoma IDH-wildtype. The remaining cases were a metastasis and an undefined glioma. TSC in the lesion was 39.3±9.3 mM in the HGG, 30.4±5.6 mM in the LGG and 52.7±6.2 mM in the metastasis. The intracellular sodium concentration (IW-SC) was 14.7±5.4 mM in the HGGs; 9.2±3 mM in the LGG and 15.6±1.4 mM in the metastasis. TSC in the basal ganglia was consistent across the entire group (23.3±6.1 mM in HGGs, 20.5±4.9 mM in LGGs and 27.4±8.2 mM in the metastasis). In the white matter, TSC was 20.4±4.1 mM in the HGGs, 18.5±4.7 mM in the LGG and 20.5±0.4 mM in the metastasis. TSC was significantly higher in tumors when compared to Normal Appearing Gray Matter (NAGM; p=0.0001) and Normal Appearing White Matter (NAWM; p=0.0001). The tumor IW-SC was not statistically significantly different as compared to NAGM (p=0.063) or NAWM (p=0.870).Discussion
In all cases, TSC was higher in the entire lesion and in the enhancing tumor compared to the NAGM and NAWM. In the majority of cases, the result for IW-SC was reversed, but this trend was not statistically significant; this may represent the fact that most of the sodium in the lesion is contained in the extracellular space which has been suppressed in the IW-SC. HGGs showed lower TSC and higher IW-SC compared to the single LGG which may reflect the presence of extracellular edema within the LGG, as opposed to the higher cell density of the HGG. The IR sequence suppresses the extracellular compartment and is weighted towards the intracellular sodium concentration. Only a single metastasis was recruited which showed an almost very low sodium signal in the edema around the metastasis on the IW-SC images consistent with a sharp demarcation in the vasogenic nature around the lesion.Conclusion
In conclusion, we have demonstrated a sodium concentration gradient across gliomas: necrosis > viable tissue > edema. This gradient is evident in all the tumors analyzed and is consistent with the expected underlying histopathology. The total sodium concentration increased throughout the malignant transformation process with an increase in the peritumoral edema dominated by the extracellular space, followed by a further increase in the viable tissue, with the highest concentration in the necrosis due to cell death and alterations in sodium homeostasis. Sodium imaging successfully highlighted regional heterogeneity within the lesions and between the different grades of brain tumors. This may have both prognostic and therapeutic value.Acknowledgements
This study was supported by the CRUK-EPSRC Cancer Imaging Centre in Cambridge and Manchester, the NIHR Cambridge Biomedical Research Centre and the Cambridge Experimental Cancer Medicine Centre (ECMC).References
References
1. Thulborn KR, Lu A, Atkinson IC, Damen F, John V. Quantitative Sodium MR Imaging and Sodium Bioscales for the Management of Brain Tumors. Neuroimaging Clin N Am. 2009;19(4):615–24.
2. Ouwerkerk R, Bleich K, Gillen J. Tissue sodium concentration in human brain tumors as measured with 23 Na MR imaging. Radiology. 2003;23(10):529–37.
3. Zaaraoui W, Konstandin S, Audoin B, Nagel a. M, Rico a., Malikova I, et al. Distribution of Brain Sodium Accumulation Correlates with Disability in Multiple Sclerosis: A Cross-sectional 23Na MR Imaging Study. Radiology. 2012;264(3):859–67.
4. Riemer F, Solanky BS, Stehning C, Clemence M, Wheeler-Kingshott CAM, Golay X. Sodium (23Na) ultra-short echo time imaging in the human brain using a 3D-Cones trajectory. Magn Reson Mater Physics, Biol Med. 2014;27(1):35–46.
5. Inglese M, Madelin G, Oesingmann N, Babb JS, Wu W, Stoeckel B, et al. Brain tissue sodium concentration in multiple sclerosis: a sodium imaging study at 3 tesla. Brain. 2010 Mar;133(Pt 3):847–57.
Figures