3663
Development of an MR-based Biomarker of Arteriolar Sclerosis1Department of Biomedical Engineering, Illinois Institute of Technology, Chicago, IL, United States, 2Rush Alzheimer's Disease Center, Rush University, Chicago, IL, United States, 3Department of Neurological Sciences, Rush University, Chicago, IL, United States, 4Department of Pathology, Rush University, Chicago, IL, United States, 5Department of Diagnostic Radiology, Rush University, Chicago, IL, United States
Synopsis
Arteriolar sclerosis is often present in the brain of older adults and has been associated with lower cognitive performance and higher risk of dementia. There is currently no standard biomarker for arteriolar sclerosis. Future clinical trials of therapeutic interventions targeting arteriolar sclerosis will require an approach for participant selection with high positive predictive value (PPV). The purpose of this work was to develop a classifier with high PPV for arteriolar sclerosis based on information about regional white matter hyperintensities, magnetic susceptibility, cerebral microbleeds, and demographics.
Introduction
Arteriolar sclerosis is often present in the brain of older adults and has been associated with lower cognitive performance and higher risk of dementia1. There is currently no standard biomarker for arteriolar sclerosis. Future clinical trials of therapeutic interventions targeting arteriolar sclerosis will require an approach for participant selection with high positive predictive value (PPV). The presence of white matter hyperintense lesions (WMH) in T2-weighted brain MR images has been previously associated with arteriolar sclerosis and is often considered a candidate biomarker for the pathology2,3. However, WMH have also been associated with other vascular, as well as neurodegenerative pathologies4,5. The purpose of this work was to develop a biomarker with high PPV for arteriolar sclerosis based not only on WMH, but also on other brain characteristics such as magnetic susceptibility measured by quantitative susceptibility mapping, and the number of cerebral microbleeds.Methods
Data Acquisition
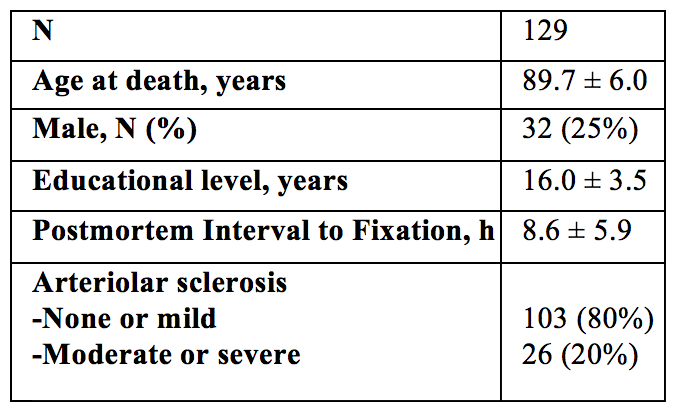
Cerebral hemispheres were obtained from 129 deceased participants of the Rush Memory and Aging Project6, and the Religious Orders Study7, two longitudinal, epidemiologic clinical-pathologic cohort studies of aging (Fig.1). All hemispheres were imaged ex-vivo on a 3T clinical MRI scanner, while immersed in 4% formaldehyde solution, using a 3D gradient-echo sequence (10 echoes, TE1/ΔTE/TR=4.6/4.63/49.5ms), a 2D spin-echo sequence (5 echoes, TE1/ΔTE/TR=16.5/16.5/4055ms) and a FLAIR sequence (TI/TE/TR=1800/125/8000ms).
Regional WMH burden
An experienced observer blinded to all pathologic and clinical data manually outlined WMH based on the ex-vivo spin-echo (TE=50ms) and FLAIR images. The white matter of each hemisphere was first segmented into deep and periventricular regions, and then further divided into frontal, temporal, and parieto-occipital regions. The total volume of WMH in each of the six white matter regions was measured for each hemisphere. Regional and whole brain WMH burden were defined as the square root of the ratio of the regional or whole brain WMH volume, respectively, normalized by the height of the participant.
Quantitative Susceptibility Mapping
Total field maps were produced from the 3D gradient-echo data8. Local fields were calculated using projection onto dipole fields. Magnetic susceptibility maps were created with MEDI9 and processed with consistency on cone data10 to suppress streaking artifacts. The reference susceptibility value was the mean susceptibility of the formaldehyde solution.
Microbleeds
Susceptibility weighted images were reconstructed from the 3D gradient-echo data and microbleeds were detected and counted using a semi-automated approach.
Neuropathologic Evaluation
Following ex-vivo MRI, all hemispheres underwent neuropathologic examination by a board-certified neuropathologist blinded to clinical and imaging findings (Fig.1). Assessment of arteriolar sclerosis was based on H&E sections with hyaline concentric thickening of the walls of small arterioles in the anterior basal ganglia. Arteriolar sclerosis was rated as none, mild, moderate, and severe.
Classification
Logistic regression with L1 penalty was used for training and testing two classifiers. The first classifier (referred to as baseline) used whole brain WMH burden as the sole feature. The second was based on a feature vector including regional WMH burden, magnetic susceptibility values, number of microbleeds, and demographics (age, sex, education). In order to assess generalization performance, 10-fold cross validation was used and repeated 10 times to avoid potential bias. The receiver operating characteristic (ROC) curve and precision-recall curve were generated for each test fold and averaged over all repeats. Statistically significant differences in AUROC were tested using a non-parametric approach11. The optimal operating point was selected from a hold-out set on the training data maximizing the PPV. Using this optimal threshold, metrics such as the area under the ROC curve (AUROC), area under the precision-recall curve (AUPR), sensitivity, specificity, PPV, negative predictive value (NPV), and balanced accuracy were calculated by averaging the results across all test folds.
Results
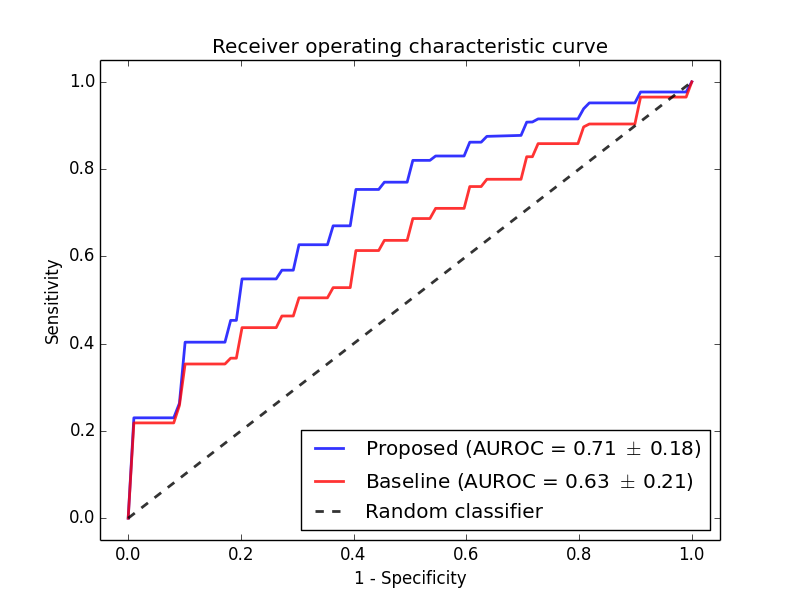
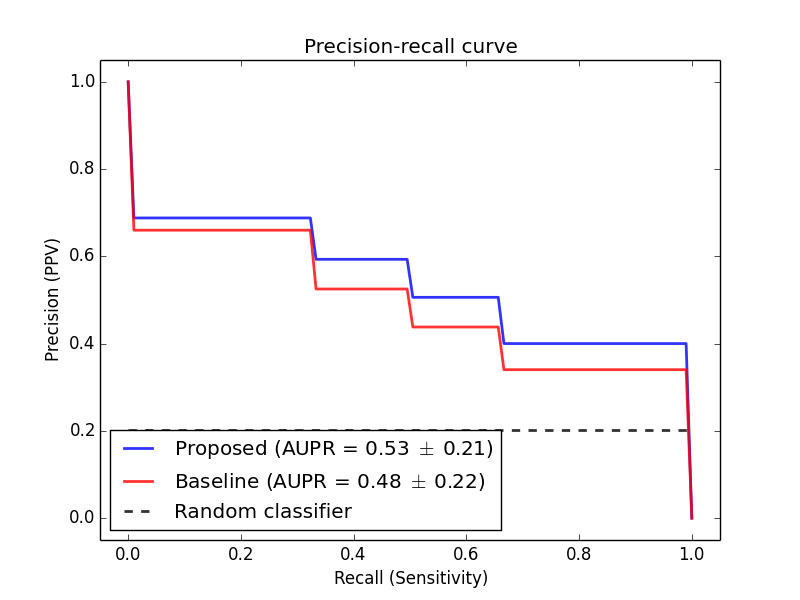
According to the ROC (Fig.2)
and PR curves (Fig.3), the proposed classifier showed superior performance over
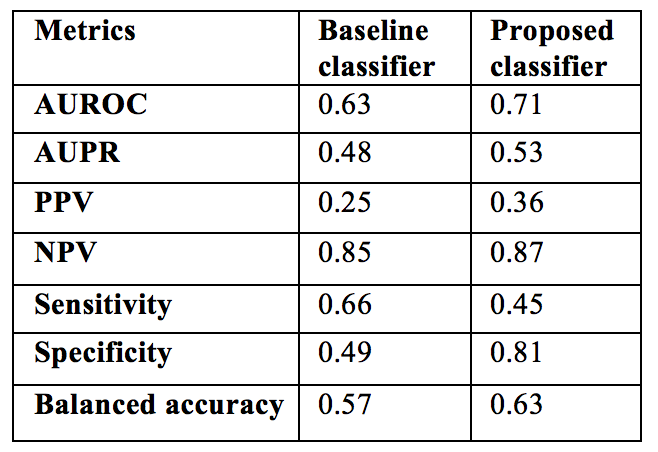
the baseline classifier, for all thresholds (p=0.068). Using the optimal
operating point selection technique, the proposed classifier achieved a higher
PPV and specificity than the baseline (Fig.4).
Discussion and Conclusion
The proposed classifier based on regional WMH burden, magnetic susceptibility, microbleeds and demographics, was shown to have superior performance for identifying older adults with arteriolar sclerosis with high PPV compared to a classifier based only on whole brain WMH burden. Although, nearly statistically significant, the improvement did not achieve significance, probably due to the small sample size. This is an ongoing project and we will soon be able to dramatically increase the sample size, include additional features, and test the classifier in-vivo12. Successful completion of this work will bring forward a much-needed biomarker for arteriolar sclerosis for use in clinical trials.Acknowledgements
No acknowledgement found.References
1. Arvanitakis Z, Capuano AW, Leurgans SE, Bennett DA, Schneider JA. Relation of Cerebral Vessel Disease to Alzheimer’s Disease Dementia and Cognitive Function in Older Persons: A Cross-sectional Study. The Lancet Neurology. 2016;15(9):934-943.
2. Debette S, Markus HS. The clinical importance of white matter hyperintensities on brain magnetic resonance imaging: systematic review and meta- analysis. BMJ 2010;341:c3666.
3. Erten-Lyons D, Dodge HH, Woltjer R, et al. Neuropathologic basis of age-associated brain atrophy. Neurology 2013;70:616-622.
4. Alqam, Nabil et al. NEUROPATHOLOGIC CORRELATES OF WHITE MATTER HYPERINTENSITIES IN A COMMUNITY COHORT OF OLDER ADULTS, Alzheimer's & Dementia: The Journal of the Alzheimer's Association, Volume 12, Issue 7, P228 - P229
5. Sopacua, Chantal et al. REGIONAL VARIATIONS IN THE RELATIONSHIP BETWEEN BRAIN WHITE MATTER HYPERINTENSITIES BURDEN AND AGE-RELATED NEUROPATHOLOGIES. Alzheimer's & Dementia: The Journal of the Alzheimer's Association, Volume 13, Issue 7, P403 - P404
6. Bennett DA, Schneider JA, Buchman AS, et al. Overview and findings from the Rush Memory and Aging Project. Curr Alzheimer Res 2012;9:646–663.
7. Bennett DA, Wilson RS, Arvanitakis Z, et al. Selected findings from the Religious Orders Study and Rush Memory and Aging Project. J Alzheimers Dis 2013;33 Suppl 1:S397-403.
8. Jenkinson M. Fast, automated, N-dimensional phase-unwrapping algorithm. Magn Reson Med 2003;49:193-197.
9. Liu J, Liu T, de Rochefort L, et al. Morphology enabled dipole inversion for quantitative susceptibility mapping using structural consistency between the magnitude image and the susceptibility map. Neuroimage 2012;59:2560-2568.
10. Wen Y, Wang Y, Liu T. Enhancing k-space quantitative susceptibility mapping by enforcing consistency on the cone data (CCD) with structural priors. Magn Reson Med 2016;75:823-830.
11. DeLong, Elizabeth R., et al. “Comparing the Areas under Two or More Correlated Receiver Operating Characteristic Curves: A Nonparametric Approach.” Biometrics, vol. 44, no. 3, 1988, pp. 837–845.
12. Evia, Arnold M. et al. MAGNETIC SUSCEPTIBILITY OF HUMAN BRAIN HEMISPHERES MEASURED POSTMORTEM. Alzheimer's & Dementia: The Journal of the Alzheimer's Association, Volume 13, Issue 7, P1072 - P1073
Figures