3661
BIOmarkers of DEPression (BIODEP) study: Raised peripheral inflammation associated with changes in striatal microstructure1Department of Neuroscience, Brighton and Sussex Medical School, Falmer, United Kingdom, 2Department of Psychiatry, University of Cambridge, Cambridge, United Kingdom, 3Centre for Neuroimaging Sciences, Kings College London, London, United Kingdom, 4MRC Cognition and Brain Sciences Unit, University of Cambridge, Cambridge, United Kingdom, 5Oxford Centre for Functional MRI of the Brain, University of Oxford, Oxford, United Kingdom, 6NHS Greater Glasgow and Clyde, University of Glasgow, Glasgow, United Kingdom, 7-, -, United Kingdom, 8Cambridgeshire and Peterborough NHS Foundation Trust, Cambridge, United Kingdom, 9Immuno-Psychiatry, GlaxoSmithKline, Stevenage, United Kingdom
Synopsis
Inflammation is implicated in the aetiology of major depressive disorder (MDD) and is known to affect brain microstructure: e.g. the striatum as found with neurite orientation dispersion and density imaging (NODDI) and quantitative magnetization transfer (qMT) imaging. Further, individuals with high inflammation (C-reactive protein (CRP)>3mg) respond less well to antidepressants. The BIOmarkers of DEPression (BIODEP) multi-centre study is aiming to characterise the inflamed MDD phenotype. We report across-site data harmonization and interim results demonstrating a negative correlation between the water fraction content (NODDI) and CRP within the ventral striatum. Multi-modal imaging results (qMT, multi-component relaxometry) across the full cohort will be reported.
Introduction
Inflammation/ immune dysregulation is implicated in the aetiology of major depressive disorder (MDD). For example, therapeutic use of Interferon-alpha (IFN-𝛼) (a pro-inflammatory cytokine) induces depression in up to a third of patients1 while meta-analyses demonstrate raised inflammatory markers (including C-reactive protein - CRP) in idiopathic depression2. Higher CRP is also linked to poorer response to conventional antidepressants3,4. Acute inflammation is known to perturb brain function (fMRI)5, network connectivity6 and microstructure indexed using quantitative magnetization transfer imaging (qMT)7 and Neurite Orientation Dispersion and Density Imaging (NODDI)8. The striatum appears particularly sensitive, with acute changes in striatum qMT and NODDI parameters predicting IFN-𝛼 induced motivational change1,8 and raised CRP linked to impaired ventral striatum to medial prefrontal cortex (PFC) functional connectivity in idiopathic depression9. Together, these findings have motivated the development/ re-purposing of immunotherapies for use in depression10,11. However, whether microstructural imaging techniques have a role as biomarkers for central sensitivity to low-level chronic inflammation or to stratify MDD patients for future immunotherapy trials is currently unclear.
Here we report across-site data harmonization and interim NODDI12 results for the first 68 participants recruited to the Wellcome Trust funded BIOmarkers of DEPression (BIODEP) study. Additional multi-modal imaging results including qMT13 and three-compartment multi-component driven equilibrium single pulse observation of T1 and T2 (mcDESPOT14) will be reported for the full cohort of 135 participants in June 2018.
Methods
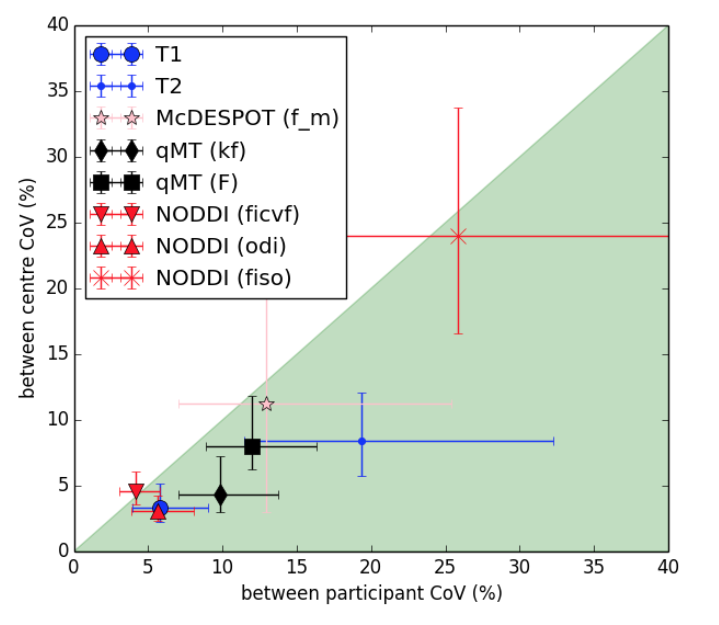
Across site data harmonization: Imaging sequences were optimized in an iterative process with the aim of reducing between-site Coefficient of Variation (CoV) below between-participant CoV for each model parameter. Single individuals were first scanned at each site to develop compatible sequences for each scanner. Five healthy participants were then scanned across all five candidate centres and CoV maps used to identify sources of inter-site variance and further optimise acquisition parameters. Two outlier sites were removed (Sussex Siemens Avanto 1.5T and Glasgow GE 3T) and CoV maps of optimised sequences verified in a second round of travelling heads.
Cohort: 45 MDD+ (Hamilton Depression Rating Scale (HAM-D) >13 and CRP>3 mg/L), 45 MDD- (HAM-D>13 and CRP<3 mg/L), and 45 healthy controls scanned at one of three sites: King’s College London (3T GE MR 750), Cambridge CBU and Oxford FMRIB (3T Siemens Prisma). Data from 68 participants (43 female; 10 MDD+, 24 MDD-, 34 controls; mean±std: age 33.4+/-11.0 years, CRP 2.0±2.6mg/L, HAMD MDD+ 18.5±4, MDD- 20.4±6.0, Controls 1.0±2.6) are reported here.
MRI:
1) NODDI: multi-shell diffusion: 7 b=0 volumes, 30 directions at b=800smm-2, 60 directions at b=2000smm-2. Voxel size (2.5mm)3, FOV: 24x24x15cm.
2) McDESPOT: TRSPGR=8.0ms, TRbSSF=6.0 ms, αSPGR=[3,4,5,6,7,9,12,18]°, αbSSFP=[12,16,21,27,33,40,51,68]°, RF phase increments of 0, π, π/2 and 3π/2, voxel size 2.4x2.4x2.5mm, FOV:19.2x19.2x16cm.
3) qMT: Offset frequencies Δ [1, 2.236, 5, 11.18, 25] kHz, effective flip angles of MT saturation pulse [360, 750]°), voxel size 2.4x2.4x2.5mm, FOV:19.2x19.2x16cm.
A T1-weighted image and functional images (not reported) were also acquired.
Diffusion data were processed with the NODDI toolbox12, McDESPOT with QUIT15 and qMT with in-house software then normalised to MNI space using Advanced Normalization Tools (ANTs)16. Data are reported for whole brain (p<0.001 unc., cluster>260) and predefined striatal region of interest. Imaging centre, sex and age were used as regressors of no interest.
Results
Across site data harmonization: Following two rounds of travelling heads data analysis between-site CoV was reduced to below between-participant CoV for all model parameters (Figure 1).
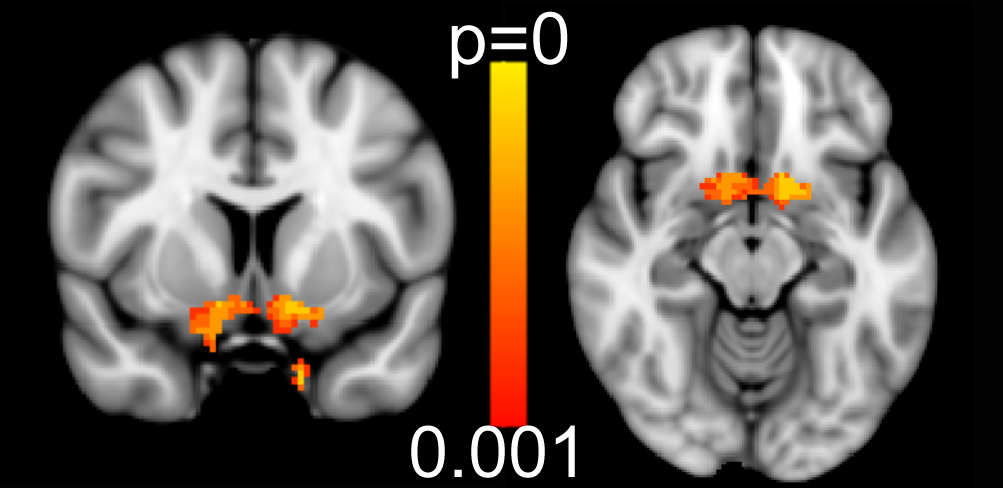
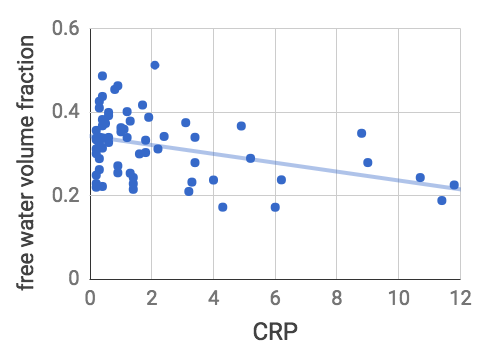
NODDI: Correlation of CRP (all participants) against NODDI parameter maps identified a significant negative correlation with free water volume fraction (Fiso) within our predefined ventral striatum region of interest. This survived both our whole brain (p<0.001 unc., cluster extent>260 voxels) and ROI thresholds (p=0.0015, R2=0.15, Figure 2). No other significant correlations with Fiso were observed for any other brain regions at our whole-brain corrected threshold. Similarly we identified no significant correlation between CRP for NODDI parameters Ficvf or ODI.
Discussion
Across site data harmonization successfully reduced between-site below between-participant CoV for each modelled parameter for our three study sites. Interim analysis demonstrates a significant negative correlation between systemic inflammation (indexed by CRP) and extracellular water (Fiso) within bilateral ventral striatum. This finding complements earlier studies showing particular sensitivity of striatum to systemic inflammation and suggests that this may extend to even low-levels of inflammation. Currently, our data support an association between striatal free water volume fraction and CRP across all participants. Whether this relationship is specific/heightened in MDD will be explored in the full dataset and further characterised through complementary qMT and mcDESPOT analyses.Acknowledgements
The authors would like to thank and acknowledge the work of members of the Wellcome Trust Consortium for the Neuroimmunology of Mood Disorders and Alzheimer’s Disease (NIMA) including GSK, Lundbeck, Janssen and Pfizer.References
1. N.G. Dowell, E.A. Cooper, J Tibble et.al, Acute changes in striatal microstructure predict the development of interferon-alpha induced fatigue, Biol. Psych. 2016;79(4)320-328
2. R. Haapakoski, J. Mathieu, K. P. Ebmeier, H. Alenius, M. Kivimäki. Cumulative meta-analysis of interleukins 6 and 1β, tumour necrosis factor α and C-reactive protein in patients with major depressive disorder. BBI 2015;49:206-215
3. R. Uher, K. E. Tansey, T. Dew, et. al. An Inflammatory Biomarker as a Differential Predictor of Outcome of Depression Treatment With Escitalopram and Nortriptyline. Am J Psych. 2014;171:1278-1286
4. S. R. Chamberlain, J. Cavanagh, P. de Boer, et. al. Treatment-resistant depression and peripheral C-reactive protein. BioRxiv 2017 doi: https://doi.org/10.1101/197012
5. N. A. Harrison. Brain Structures Implicated in Inflammation-Associated Depression. Curr Top Behav Neurosci. 2017;31:221-248
6. O. Dipasquale, E. A. Cooper, J. Tibble, et. al. Interferon-α acutely impairs whole-brain functional connectivity network architecture – A preliminary study. BBI 2016;58: 31-39
7. N.A. Harrison, E. A. Cooper, N.G. Dowell et. al. Quantitative magnetization transfer imaging as a biomarker for effects of systemic inflammation on the brain. Biol. Psych. 2015;78:49-57
8. NG. Dowell, J. Tibble, V. Voon et. al. Interferon-alpha induced changes in NODDI predispose to the development of fatigue. Neuroscience (under review)
9. J. C. Felger, Z. Li, E. Haroon et. al. Inflammation is associated with decreased functional connectivity within corticostriatal reward circuitry in depression. Mol. Psych. 2015;21:1358-1365
10. C. L. Raison, R. E. Rutherford, B. J. Woolwine et. al. A randomized controlled trial of the tumor necrosis factor antagonist infliximab for treatment-resistant depression: the role of baseline inflammatory biomarkers. JAMA Psych. 2013;70:31-41.
11. A. Bhattacharya, N. C. Derecki, T. W. Lovenberg, W. C. Drevets. Role of neuro-immunological factors in the pathophysiology of mood disorders. Psychopharmacology 2016;233:1623–1636
12. H. Xhang, T. Schneider, C. A. Wheeler-Kingshott & D. C. Alexander NODDI: Practical in vivo neurite orientation dispersion and density imaging of the human brain. NeuroImage 2012;61(4):1000-1016
13. R. M. Henkelman, X. Huang, Q.-S. Xiang et. al. Quantitative interpretation of Magnetization transfer. Mag. Res. Med. 1993;29(6):759-766
14. S. C. L. Deoni, L. Matthews, S. H. Kolind One component? Two components? Three? The effect of including a nonexchanging “free” water component in multicomponent driven equilibrium single pulse observation of T1 and T2. Mag. Res. Med. 2013;70(1)147-154
15. T. Wood. QUantitative Imaging Toolbox. https://github.com/spinicist/QUIT. Accessed June 14, 2016
16. B Avants, N Tustison, G Song. Advanced Normalization Tools, ANTS. Insight j, 2009
Figures