3660
Quantifying acrolein with MRS: a viable biomarker to assess location and severity of TBI1Basic Medical Sciences, Purdue University, West Lafayette, IN, United States, 2Biomedical Engineering, Purdue University, West Lafayette, IN, United States, 3Electrical and Computer Engineering, Purdue University, West Lafayette, IN, United States
Synopsis
Currently, only invasive methods exist to study the molecular effects of traumatic brain injury (TBI). By instead using magnetic resonance spectroscopy (MRS), a non-invasive, quantitative method can be used to safely assess the severity and location of injury. Acrolein, a biomarker of TBI, increases in rat brain tissue following TBI. Acrolein shows signature peaks downfield of water at 6.5 and 9.4 ppm. We have successfully measured whole-brain phantom-injected acrolein using Bruker 7T MRS sequences and determined T1 for acrolein, using NMR, so MRS parameters can be adjusted to maximize acrolein signal. Quantifying acrolein with MRS could provide a viable method to assess injury location and severity.
Introduction
In 2013, there were 2.8 million cases of TBI-related emergency department visits, hospitalizations, and deaths.1 TBI can cause significant acute and long-term disability including troubles concentrating, persistent headache, cognitive dysfunction, and mood disorders.2 The complex neuropathological mechanisms of TBI owe to difficulties in diagnosis, treatment, and rehabilitation. Therefore, there exists a critical need to develop quantitative and non-invasive methods to assess injury and understand the pathophysiological mechanisms subserving neurological outcomes following TBI. MRS can reveal how metabolites in the brain change as a result of disease and injury.3 Since healthy whole-brain metabolic spectra of humans and rats are well defined, we can detect any deviations from normal.4,5 The metabolite acrolein, not yet investigated using MRS, increases in rat brains following TBI.6 Acrolein, a byproduct of lipid peroxidation, is shown to have damaging effects on cellular functions following injury to the central nervous system.6 Currently, only invasive and sacrificial procedures exist to quantify acrolein in rodent models of TBI.6 By using MRS to measure acrolein in vivo, a novel, noninvasive method can be developed to assess the location and severity of insult to the brain. With a quantitative spatiotemporal map of injury, patient-specific treatment and rehabilitation strategies can be effectively implemented to prevent acute and long-term morbidity from TBI. To determine if TBI in humans can be accurately assessed with MRS, it is necessary to first establish injury response profiles in comparative models. Ideally, acrolein is detectable and quantifiable in 1) phantoms, 2) animals, and 3) humans. If so, we hypothesize that acrolein will show spatiotemporal increases with injury severity which can predict neurobehavioral outcomes.Methods
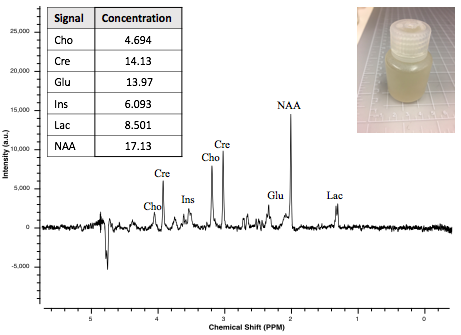
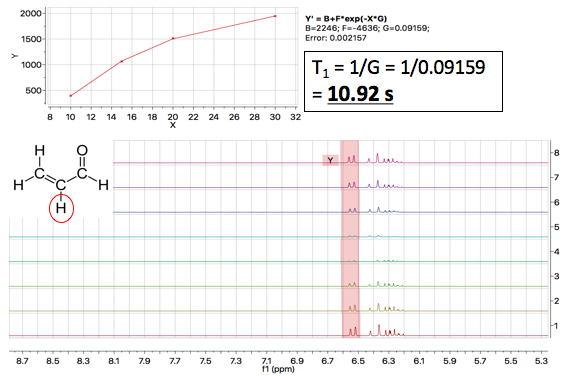
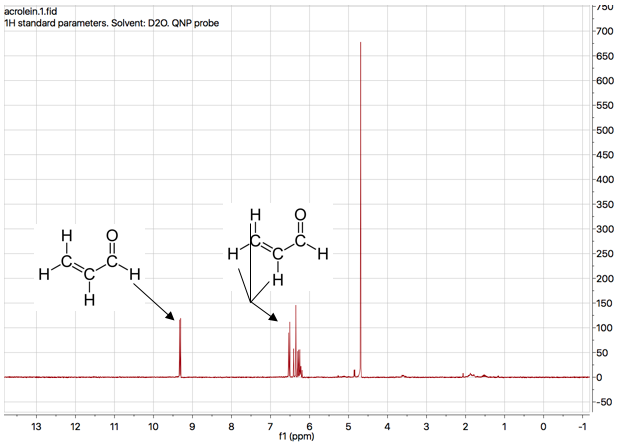
Whole-Brain Phantom: To quantify acrolein in vivo, we developed a whole-brain phantom (Fig. 1). The phantom is designed to mimic the metabolic profile of brain tissue. This “mini-braino” contains glutamic acid, N-acetyl-aspartic acid, myo-inositol, creatine, and choline diluted in RODI water. 400 μL of 1M stock acrolein was diluted in the 40 mL phantom to create a 10 mM aqueous solution. Imaging was conducted using a Bruker BioSpec 70/30 USR preclinical 7T MRI system and a Bruker rat head/mouse body RF RES 300 1H 075/040 QSN TR volume coil. A standard PRESS sequence was utilized (TE=16.5 ms, TR=2500 ms, voxel=3 mm3). Spectra were collected with and without acrolein injection. Tarquin was used for post-processing.NMR Experiments: T1 and T2 relaxation times were determined through the Purdue Interdepartmental NMR Facility using a Bruker ARX300 1H NMR system (7T/300MHz). 25 μL of 1M stock acrolein was diluted in 350 μL of D2O. T1 and T2 were determined with saturation recovery and CPMG methods, respectively. 1H spectra were also obtained. Values were calculated using MestReNova post-processing software.
Results
Whole-Brain Phantom: Signature acrolein peaks were observed at 6.5 and 9.4 ppm in whole-brain phantom (Fig. 2).
NMR Experiments: T1 was calculated to be, on average, 12 s. T2 was estimated to be < 3 s, although there were issues with T2 data collection. The 1H spectrum collected at 300 MHz displayed expected acrolein peaks (Fig. 3).
Discussion
These data suggest that (1) the in-house whole-brain phantom mimics metabolic profiles of brain tissue, (2) acrolein is measurable with standard MRS protocols at 7T, but (3) MRS pulse sequences must be adjusted to maximize signal and compensate for longer T1. With adjustments to the pulse sequence, it is feasible that SNR can be maximized for acrolein in phantom and in vivo. To fit and quantify acrolein peaks using post-processing software, an acrolein basis set is required. To maximize signal from acrolein, T1 and T2 values will be used to adjust PRESS and semi-LASER pulse sequences. In addition, novel downfield pulse sequences may be implemented for acrolein quantification, but will require adjustments. Following pulse sequence adjustment, we will determine the limit of detection for acrolein in whole-brain phantom, post-mortem rat brain, and in vivo models of closed-head impact-TBI. Once experiments have been conducted in animal models of injury, this non-invasive method of localizing injury severity can be translated to patients with TBI. This novel technique could have numerous implications: improved diagnostic and rehabilitation strategies, development of better concussion prevention protocols in sports-athletes and military personnel, and pharmaceutical research to investigate viable treatments for TBI.Conclusion
Due to the high incidence of TBI and associated co-morbidities, it is critical to develop novel methods to localize injury severity. By quantifying and localizing acrolein with MRS, and investigating neurological outcomes associated with in vivo measures, we can predict adverse behavioral outcomes following TBI and devise patient-specific interventions to decrease TBI-associated morbidity.Acknowledgements
I would like to thank Dr. Huaping Mo and Dr. John Harwood at the Purdue Interdepartmental NMR Facility (PINMRF) for their assistance with NMR data collection. I would also like to thank Dr. Gregory Tamer who manages the Bruker 7T MRI Facility.References
1. Taylor CA, Bell JM, Breiding MJ, Xu L. Traumatic Brain Injury–Related Emergency Department Visits, Hospitalizations, and Deaths — United States, 2007 and 2013. MMWR Surveill Summ. 2017;66(9):1-16.
2. Walker KR, Tesco G. Molecular Mechanisms of Cognitive Dysfunction Following Traumatic Brain Injury. Front Aging Neurosci. 2013;5(29):1-25.
3. Andrew ER. Nuclear Magnetic Resonance and the Brain. Brain Topogr. 1992;5(2):129-133.
4. Pfeuffer J, Tkáč I, Provencher SW, Gruetter R. Toward an in Vivo Neurochemical Profile: Quantification of 18 Metabolites in Short-Echo-Time 1 H NMR Spectra of the Rat Brain. Magn Reson. 1999;114(1):104-120.
5. Pouwels PJW, Frahm J. Regional metabolite concentrations in human brain as determined by quantitative localized proton MRS. Magn Reson Med. 1998;39(1):53-60.
6. Shi R, Rickett T, Sun W. Acrolein-mediated injury in nervous system trauma and diseases. Mol Nutr Food Res. 2011. Mol Nutr Food Res. 2011;55(9):13320-1331.
Figures