3659
Epileptogenesis Imaging biomarker identification in the Mesial Temporal lobe epilepsy (MTLE) mouse model1Laboratoire du Traitement du Signal et de l’Image (LTSI) - Inserm UMR 1099, Université de Rennes 1, Rennes, France, 2Protim Core Facility Biogenouest, IRSET - Inserm UMR 1085, Université de Rennes 1, Rennes, France, 3PRISM - Biosit CNRS UMS 3480, INSERM UMS 018, Université de Rennes 1, Rennes, France
Synopsis
This work presents preliminary promising results on Mesial temporal lobe epilepsy (MTLE) mouse model suggesting that MRI/MRS-based biomarkers could be of great interest to detect early changes in the lesioned brain and to characterize epileptogenesis after traumatic brain injury.
Introduction
Mesial temporal lobe epilepsy (MTLE), is a particular form of epilepsy, that involves the hippocampus and its sub-regions, CA1-CA3 and Dentate Gyrus (DG)1-,3. The in-vivo kainate induced MTLE mouse model reproduces the symptoms of human MTLE and potentially allows us to find reliable biomarkers of epileptogenesis4-5. In addition to the EEG-technique that allows the detection of epileptic activities, MRI/MRS and MALDI imaging have become very attractive to study the structural and functional changes during epileptogenesis6-8.
In this study, we analyzed multimodal data, i.e. EEG-signal (Hippocampal Paroxysmal Discharges), MRI,1H-MRS and MALDI Imaging in the MTLE mouse model. The aim of this work is to potentially correlate imaging parameters (MRI, MALDI) with excitability markers (EEG).
Methods
MRI acquisitions were performed on a horizontal 4.7T Bruker Biospec 47/40 magnet interfaced to an AVANCE console (Bruker BioSpin, Ettlingen, Germany) and a workstation running ParaVision 5.1. A linear-volume radio frequency coil (72mm inner diameter) was used as transmitter and a home-made surface radio frequency coil (1 mm diameter) was used as receiver. Anesthesia was induced with 3% of isoflurane in 0.5L/min of air, and regulated between 1 to 1.5% during the acquisitions. Axial high-resolution T2w images with an in plane resolution of 55 x 55 µm and a slice thickness of 0.5 mm were first acquired (RARE sequence with TR/TEeff=2500/45ms; RARE_Factor=8, Averages=24).T1 and T2 maps were then extracted in Matlab® R2016b (The MathWorks) from 2 RARE sequences with an in plane resolution of 0.1x0.1mm, a slice thickness of 0.75 mm, and with respectively TEeff=10ms; TR=400, 800, 1400, 3000, 6000ms; RARE_Factor=2 and TE=10, 30, 50, 70, 90, 110, 130, 150 ms; TR=4500ms; RARE_Factor=2. These maps were then registered with Elastix9 ROIs were manually drawn in the DG and the whole hippocampus. T1 and T2 relative ratio ipsi/contra (%) and relative ratio ipsi(t)/ipsi(D-3) (%) were measured in these ROIs.
Localized 1H-MRS spectra were acquired in controlateral and ipsilateral hippocampus with a PRESS sequence (TR/TE=2500/11.2ms; 256 averages; BW=4KHz; Voxel=2mmx1.2mmx1.7mm) and processed with LCModel10. Metabolite signal intensity ratios with respect to creatine were calculated, as well as metabolite relative ratio ipsi/contra (%) and relative ratio ipsi(t)/ipsi(D-3) (%).
MALDI imaging was performed on a Bruker UltrafleXtreme MALDI-TOF/TOF system interfaced with the flexImaging software.
EEG were acquired on a Deltamed monitoring system (32 acquisition channels) at sampling frequency of 256 Hz with a bipolar electrode implanted into the right dorsal hippocampus after kainate injection, and three monopolar surface electrodes placed over the left and right frontoparietal cortex and over the cerebellum. Heinrich score and number of Hippocampal Paroxismal Discharge (HPD) were calculated5,11.
MRI/MRS acquisitions were performed on C57BL/6J mouse (age: 80±5 days) at 9 time-points: 3-days before kainate injection and day-2, day-4, day-7, day-9, day-11 day-14, day-21, day-28 after kainate injection (n=12; 6 epileptic; 3 sham-control; 3 control). MALDI Imaging and EEG recording were performed at day-2, day-4, day-7, day-9, day-11 day-14, day-21, day-28 after kainate injection (n=45; 27 epileptic; 18 sham-control).
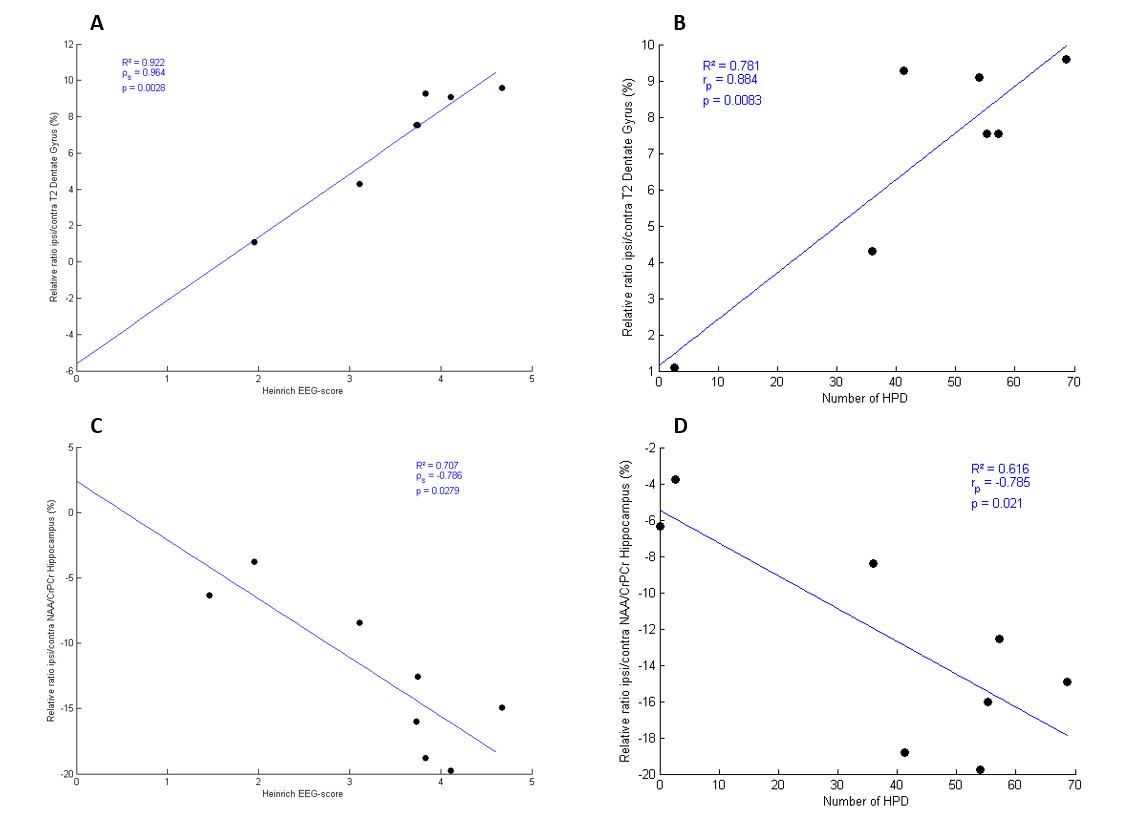
Spearman and Pearson correlation coefficient were calculated between MRI/MRS parameters and respectively Heinrich score, and the numbers of HPD. A p-value of 0.05 was used for significance
Results
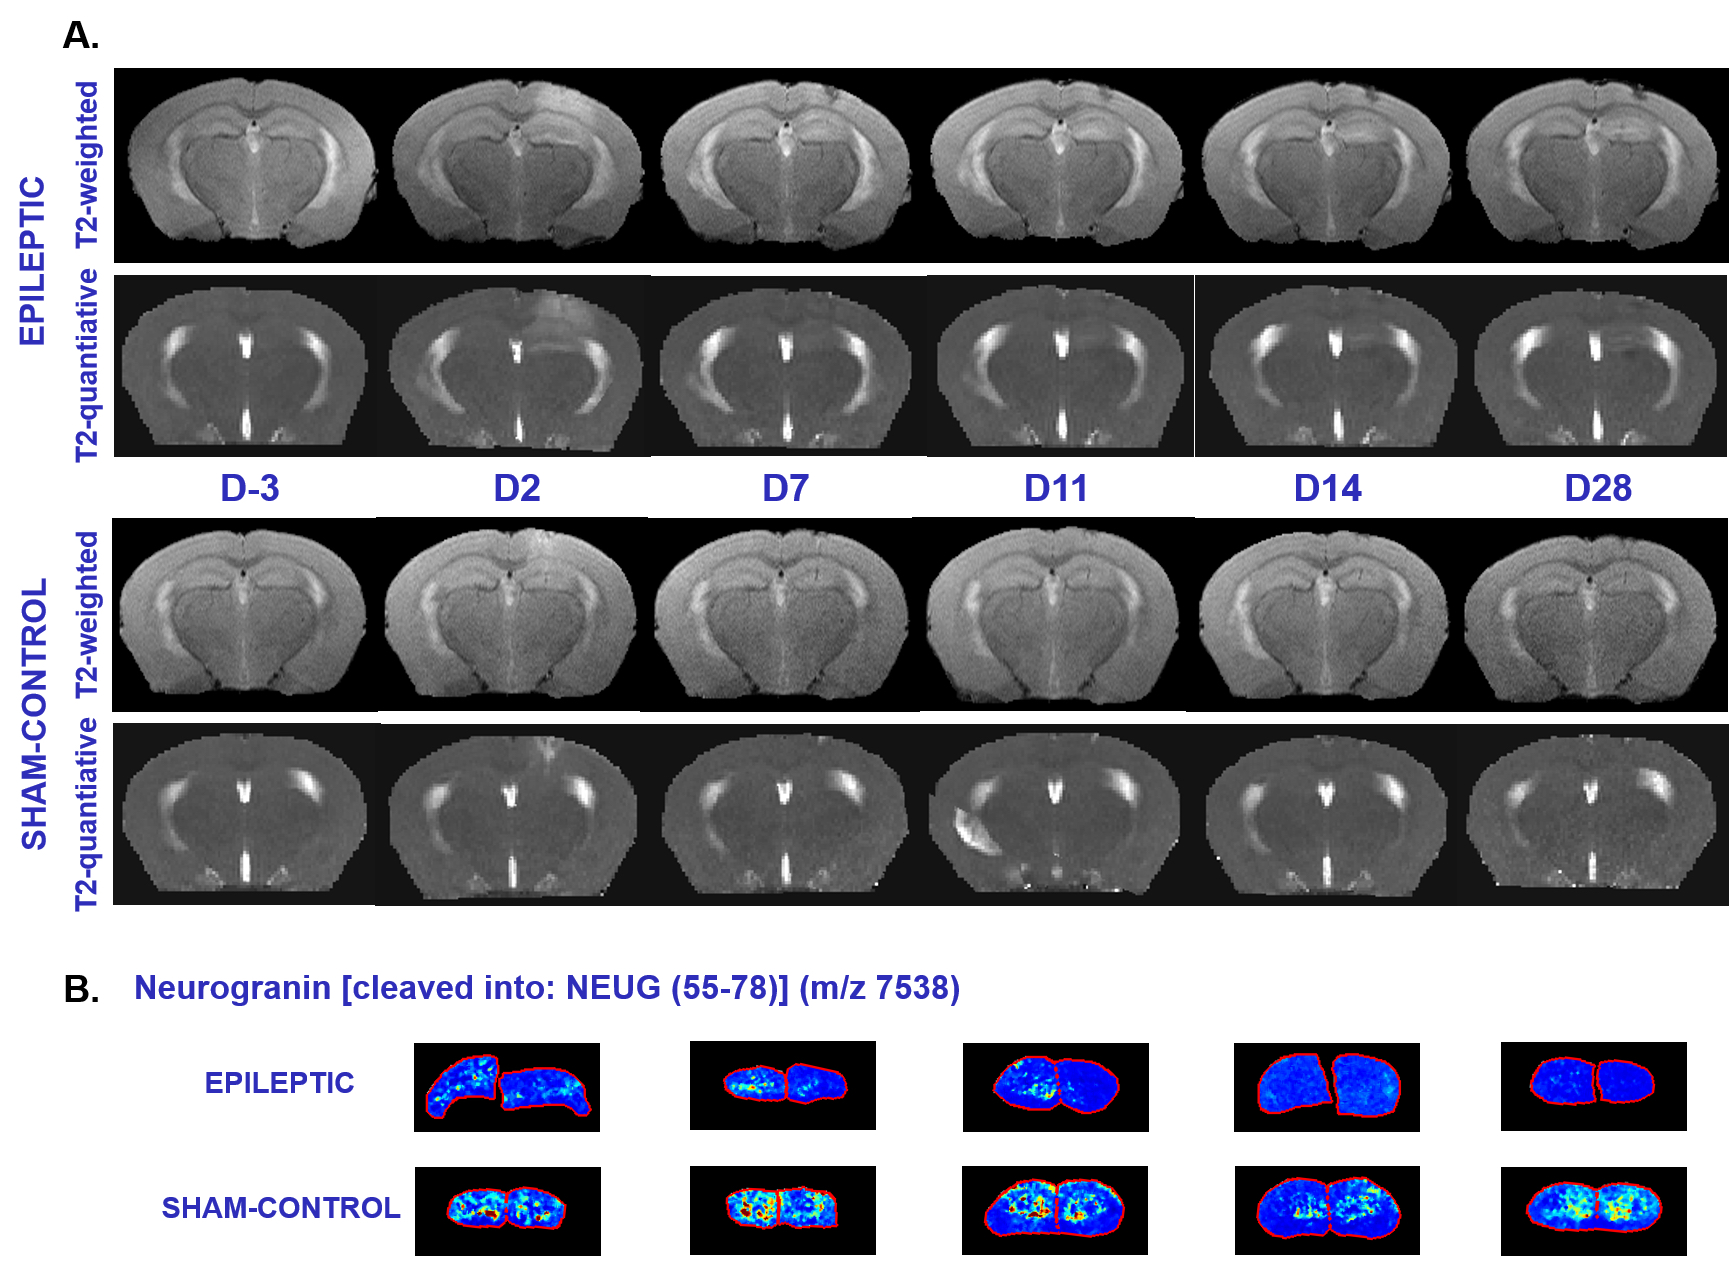
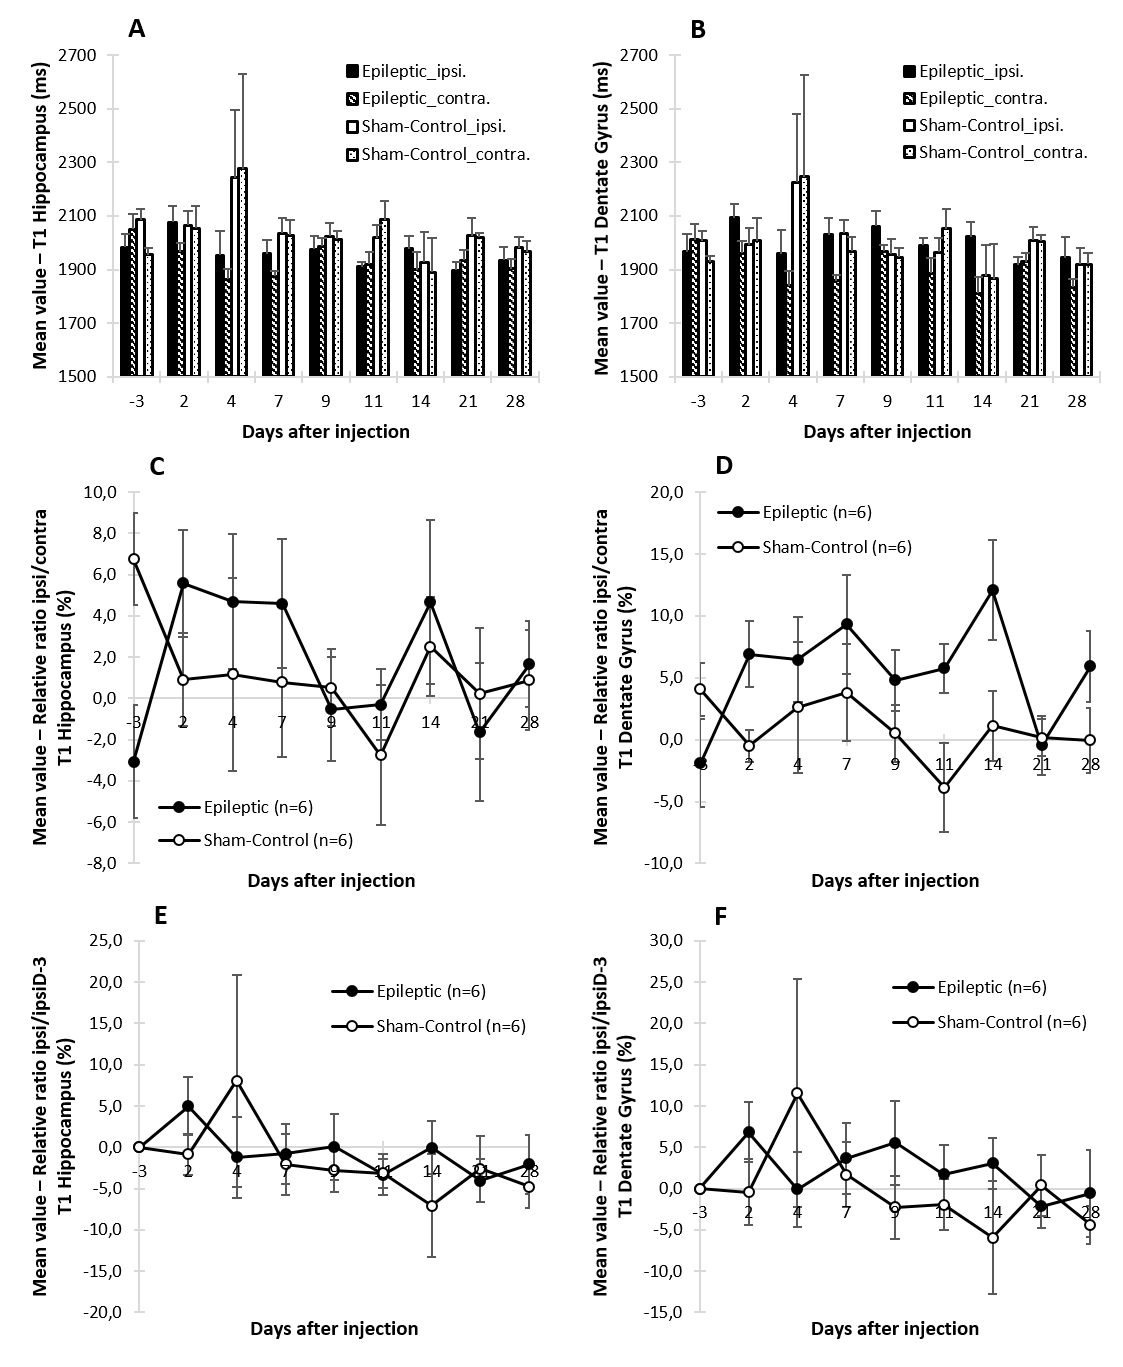
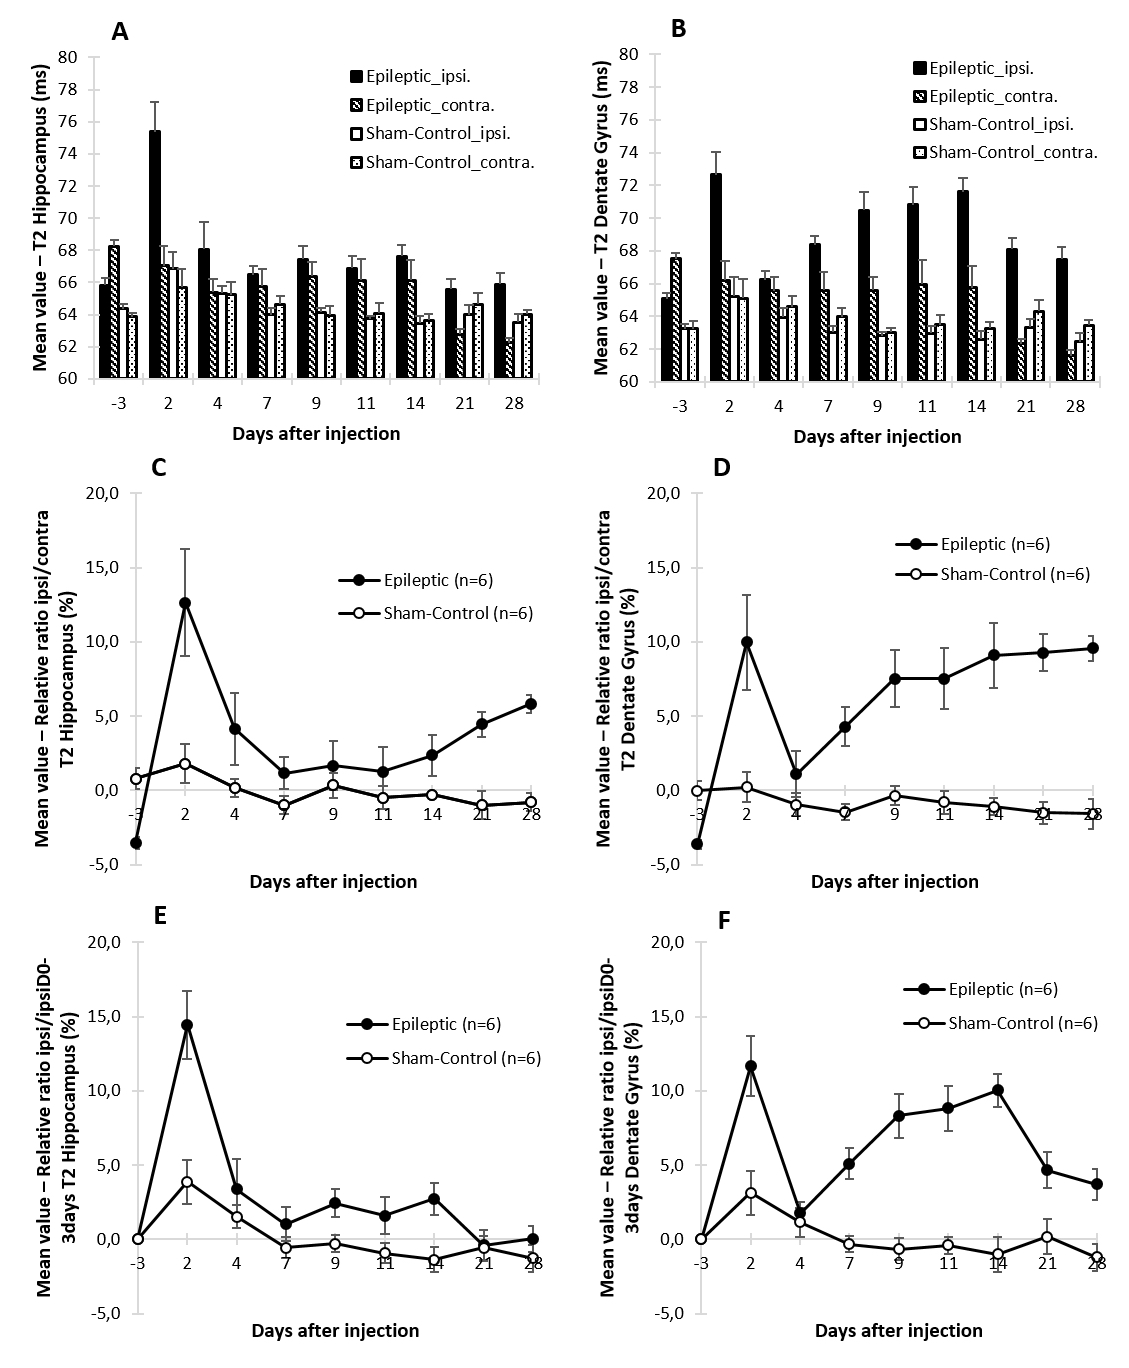
Qualitatively, an hyper-signal on anatomic high-resolution T2-weighted images was observed from day-7 to day-28 in the DG (Fig. 1). Quantitatively, if T1 does not show particular evolution (Fig. 2), higher T2s are measured in ipsilateral Dentate Gyrus of kainate-injected mice compared to sham-control mice (Fig. 3). In the DG The relative ratios T2 ipsi/contra and ipsi(t)/ipsi(D-3) showed a first peak at day-2 probably due to the post injection edema. Then a second increasing phase could be observed after day-4.
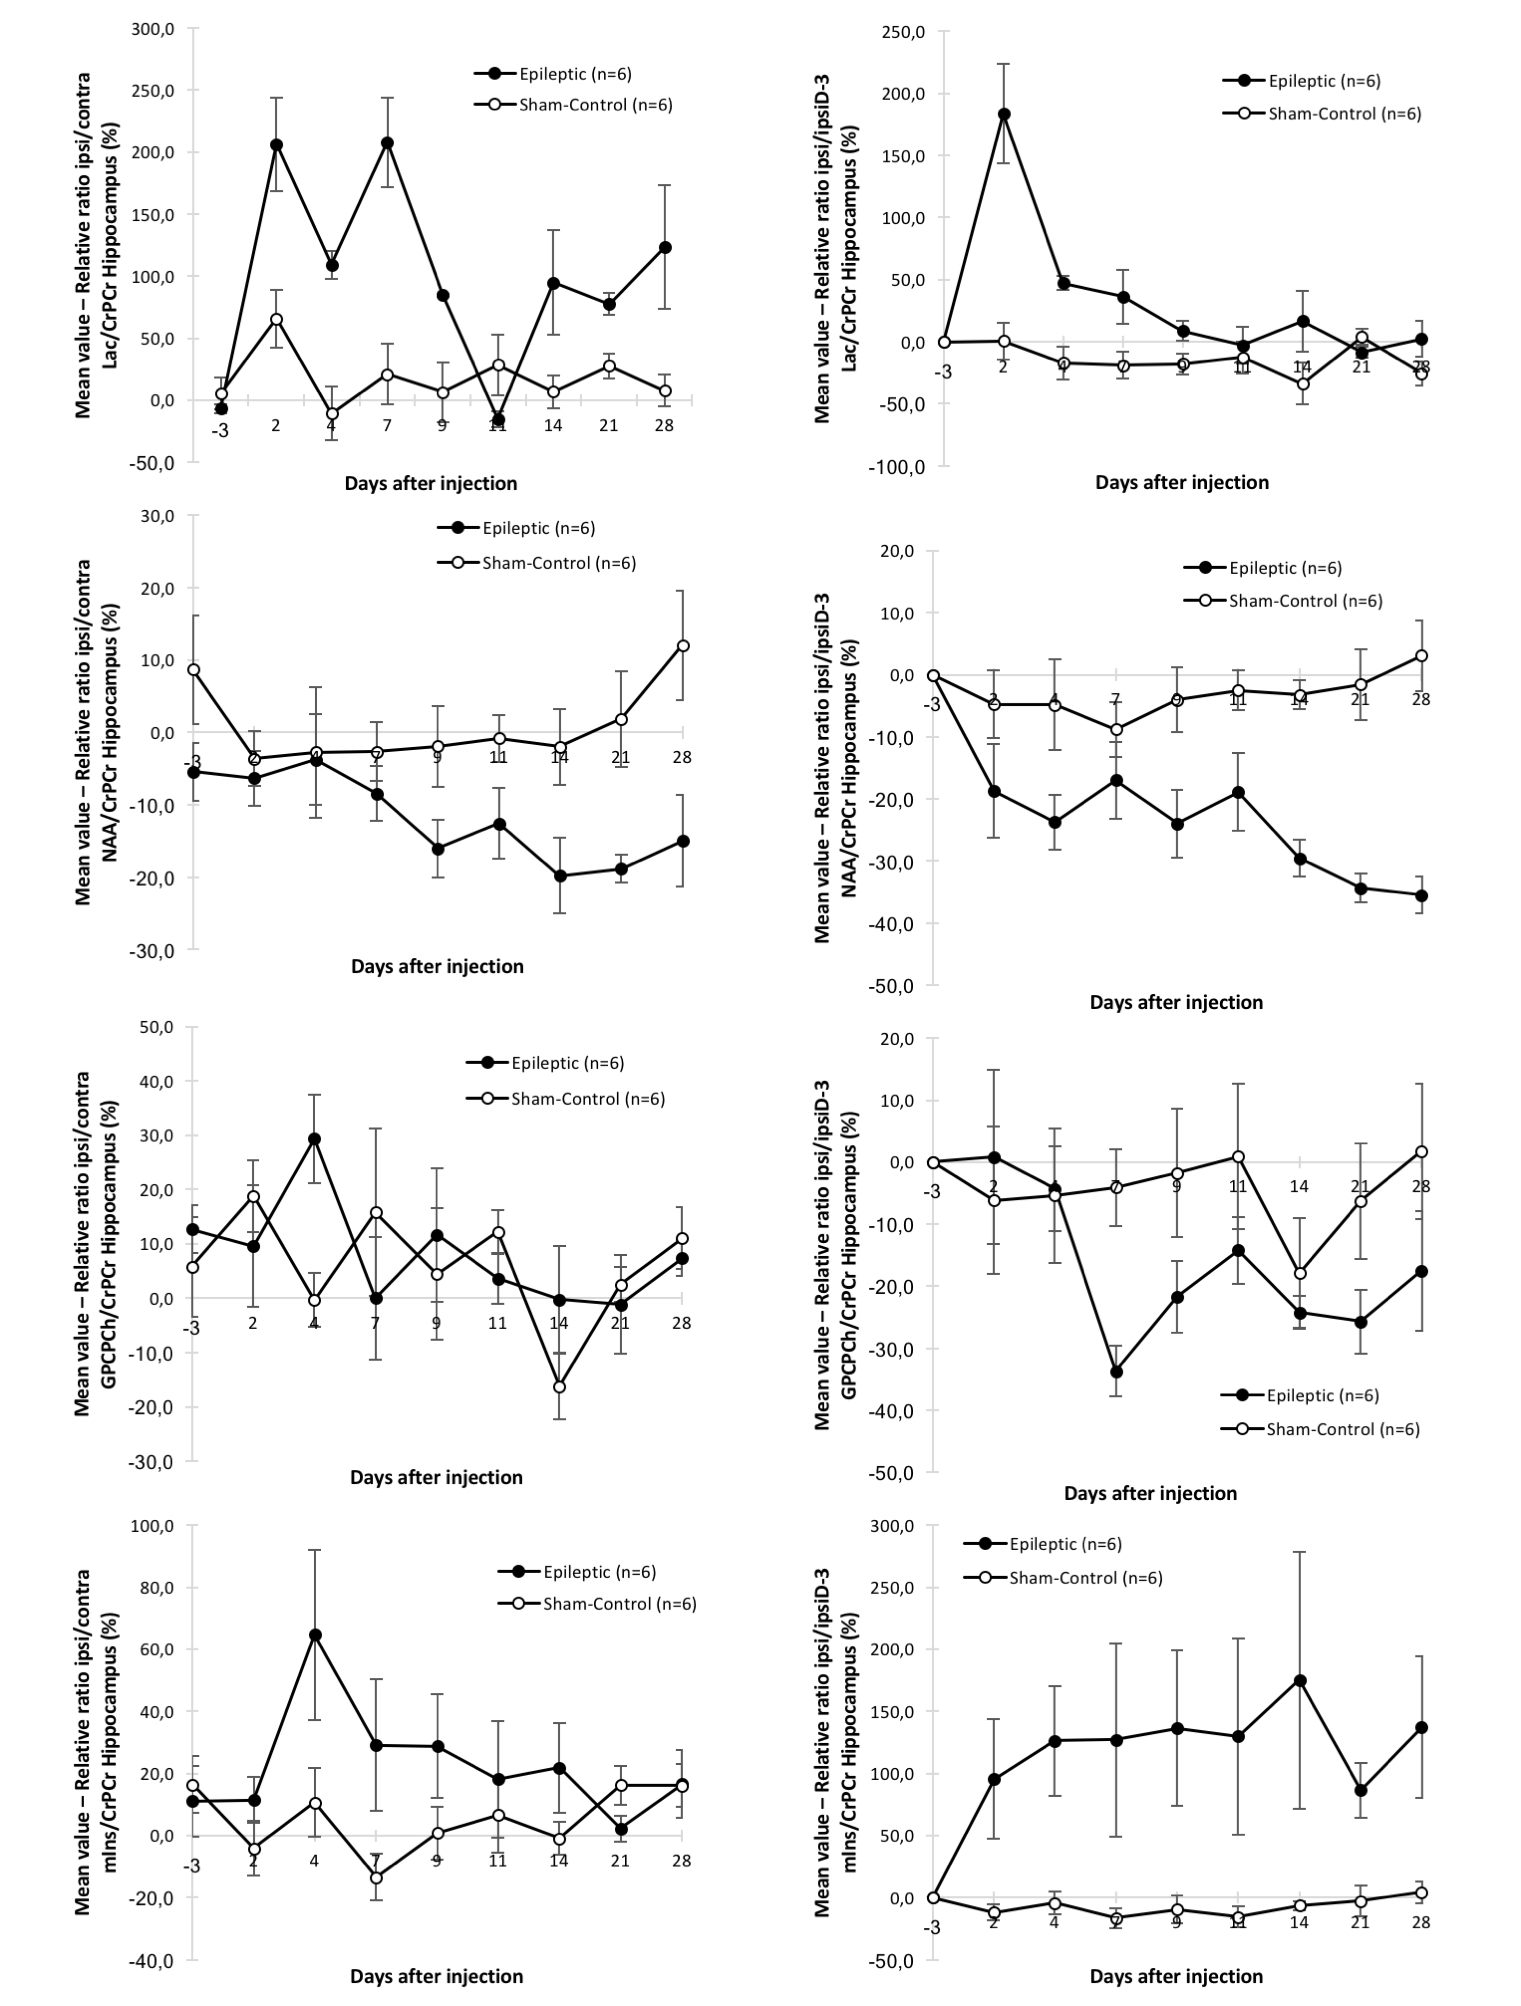
Evolution of Lactate, NAA, GPCPCh and MyoInositol are presented Fig. 4. A strong but transient increase of lactate was observed just after kainate injection, while NAA decreased, and MyoInositol increased in kainate-injected mice.
Downregulation of three identified proteins was observed with MALDI imaging12 : Calmodulin regulator protein PCP4, Neurogranin (55-78) (Fig. 1), Cytochrome c oxidase subunit 7A2, mitochondrial.A positive correlation between T2 relative ratio ipsi/contra (%) with Heinrich score and number of HPD and a negative correlation between NAA relative ratio ipsi/contra (%) with Heinrich score and number of HPD were observed (Fig. 5).
Discussion/Conclusion
In this preliminary work we observed strong correlations between EEG-based markers and MRI/MRS-based parameters. Although, MR-compatible EEG electrodes were not available for this study, these results confirmed that both structural and metabolic changes occuring in the MTLE epilepsy model could be tracked using MRI and MRS and used to detect early changes in the lesioned brain during the evolution of epileptogenesis after traumatic brain injury.Acknowledgements
The authors wish to thank Gabriel Dieuset for support in animal experimentations, Paul Berraute for Matlab interface development, Frederic Commandeur and Benaissa Frih for their support during image registration process and Maxime Souffoy-Rittner for EEG analysis.References
1. A. Pitkänen, I. Kharatishvili, H. Karhunen, K. Lukasiuk, R. Immonen, J. Nairismägi, O. Gröhn, and J. Nissinen, “Epileptogenesis in experimental models,” Epilepsia, vol. 48, no. s2, pp. 13–20, 2007.
2. H. S. White, “Animal models of epileptogenesis,” Neurology, vol. 59, no. 9 suppl 5, pp. S7–S14, 2002.
3. A. Pitkänen, “Therapeutic approaches to epileptogenesis—hope on the horizon,” Epilepsia, vol. 51, no. s3, pp. 2–17, 2010.
4. F. Suzuki, M.-P. Junier, D. Guilhem, J.-C. Sørensen, and B. Onteniente, “Morphogenetic effect of kainate on adult hippocampal neurons associated with a prolonged expression of brain-derived neurotrophic factor,” Neuroscience, vol. 64, no. 3, pp. 665–674, 1995.
5. V. Bouilleret, V. Ridoux, A. Depaulis, C. Marescaux, A. Nehlig, and G. L. G. La Salle, “Recurrent seizures and hippocampal sclerosis following intrahippocampal kainate injection in adult mice: electroencephalography, histopathology and synaptic reorganization similar to mesial temporal lobe epilepsy,” Neuroscience, vol. 89, no. 3, pp. 717–729, 1999.
6. S. R. Shultz, T. J. O’Brien, M. Stefanidou, and R. I. Kuzniecky, “Neuroimaging the epileptogenic process,” Neurotherapeutics, vol. 11, no. 2, pp. 347–357, 2014.
7. V. Bouilleret, A. Nehlig, C. Marescaux, and I. J. Namer, “Magnetic Resonance Imaging Follow-up of Progressive Hippocampal Changes in a Mouse Model of Mesial Temporal Lobe Epilepsy,” Epilepsia, vol. 41, no. 6, pp. 642–650, 2000.
8. A. Nehlig,
“Hippocampal MRI and other structural biomarkers: experimental approach to
epileptogenesis,” Biomark. Med., vol. 5, no. 5, pp. 585–597, Oct. 2011.
9. S. Klein, M. Staring, K. Murphy, M. A. Viergever, and J. P. Pluim, “Elastix: a toolbox for intensity-based medical image registration,” Med. Imaging IEEE Trans. On, vol. 29, no. 1, pp. 196–205, 2010.
10. S. Provencher: Estimation of metabolite concentrations from localized in vivo proton NMR spectra. Magn Reson Med 30, 672,1993
11. V. Riban, V. Bouilleret, B. T. Pham-Le, J.-M. Fritschy, C. Marescaux, and A. Depaulis, “Evolution of hippocampal epileptic activity during the development of hippocampal sclerosis in a mouse model of temporal lobe epilepsy,” Neuroscience, vol. 112, no. 1, pp. 101–111, 2002.
12. Lagarrigue, M., Alexandrov, T., Dieuset, G., Perrin, A., et al., New analysis workflow for MALDI imaging mass spectrometry: application to the discovery and identification of potential markers of childhood absence epilepsy. J. Proteome Res. 11, 5453–5463, 2012.
Figures