3658
Neuroimaging based biomarkers for detecting craving and predicting relapse in methamphetamine dependence1Central South University, Changsha, China, 2The University of Chicago, chicago, IL, United States
Synopsis
This study investigates whether insula cortex abnormalities of methamphetamine-dependent subjects (MADs) can detect craving state and predict relapse susceptibility. Voxel based morphometry and statistical parametric mapping were used on structural MRI of MADs. Total 142 MADs were divided into two groups: model-group (n=112) and validation-group (n=30) from follow-up MADs. The results showed that MADs without craving had significantly smaller insula volume. Optimal insula volume determined from Youden index cut-off point on ROC analysis could be used as MRI bio-markers with acceptable accuracy for detecting craving state. Our results could help guide optimally timed intervention, prevention, and treatment strategies for MADs.
INTRODUCTION
Addiction is a chronic disease and commonly associated with substance abuse.1 Methamphetamine (MA) is one of the most widely abused drugs in the world. Many studies have shown that long-term exposure to addictive substances leads to insula cortex (IC) damage.2 More importantly, the activity of the IC is associated with craving and strongly involved in addiction behaviors.3 Understanding the relationship between addiction behavior and IC gray matter volume (GMV) integrity in MA-dependent subjects (MADs) could facilitate the development of tailored treatment strategies. The aim of this study was to investigate whether the structural neuroimaging could be used to detect MADs’ craving state and predict relapse susceptibility.METHODS
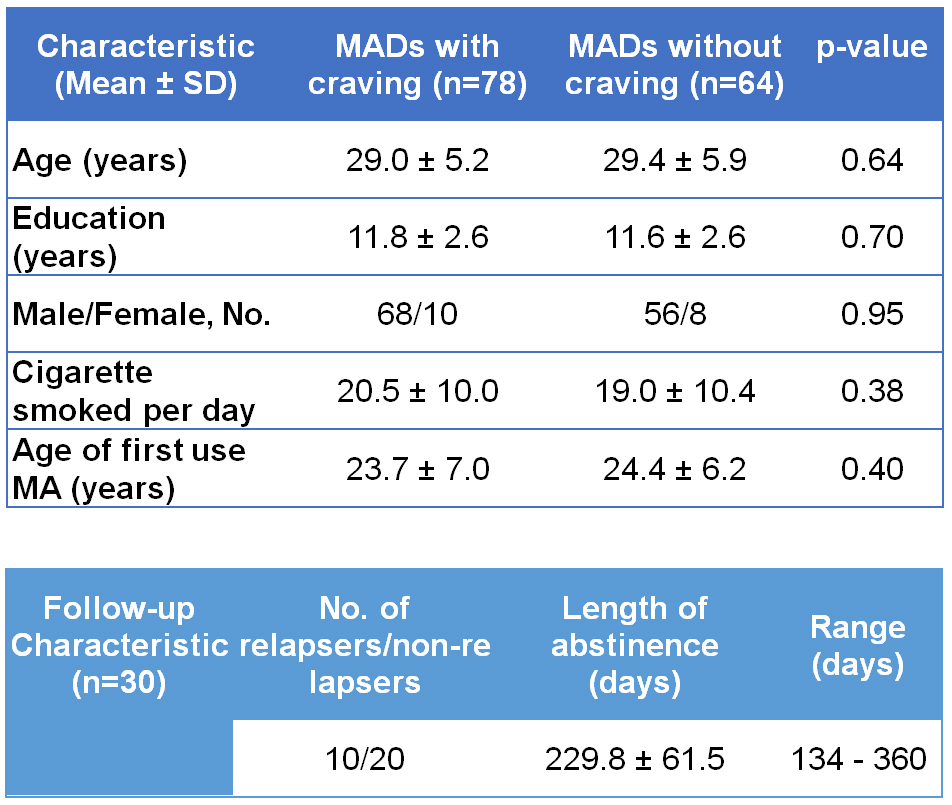
The study was approved by the Ethics committee of the Second Xiangya Hospital, Central South University, Hunan, China and carried out in accordance with the Declaration of Helsinki. MADs (n=142) that met the DSM-IV criteria for lifetime MA dependence were included in this study (Table 1). Drug use history and MA craving score was measured by the ‘Visual Analogue Scale for Craving’ (VASc) scaled between 0 (no craving) to 10 (extreme craving).4 All MADs were contacted beginning at four months after the first MRI scan, to participate in a second scan and to determine relapse status. Of the 142 participants, 30 subjects returned for follow-up. “Relapsers” and “Non-relapsers” were defined as any or no use of MA between their discharge from the inpatient unit and the time of the second scan. The structural MRI (sMRI) scans were performed on a 3.0-T Siemens Magentom Trio scanner. T1-weighted 3D MP-RAGE images were acquired (TR/TE=2000/2.26 ms, field of view=256×256 mm, flip angle=8°, matrix size=256×256, number of slices=176, slice thickness=1 mm) to cover the whole brain. By means of voxel-based morphometry (VBM), IC GMV abnormalities between the MADs with and without craving were investigated. The receiver operating characteristic (ROC) analysis was performed for the region-of-interest (ROI) of IC GMV to assess the diagnostic accuracy. Participants were divided into two groups: model (training) group (n=112) and validation group (n=30) who all returned for a follow-up. To mimic more datasets of model groups, 112 patients were further randomly divided into four groups of 28 patients and repeated for 30 random partitions (total 120 groups). The ROC analysis was performed for the IC GMV obtained in the model group to evaluate diagnostic performance for detecting craving state. The 2×2 contingency tables were constructed for the validation group based on IC GMV smaller vs. larger than the optimal cut-off values and corresponding number of MADs without vs. with craving, and non-relapse vs. relapse to calculate sensitivity and specificity.RESULTS
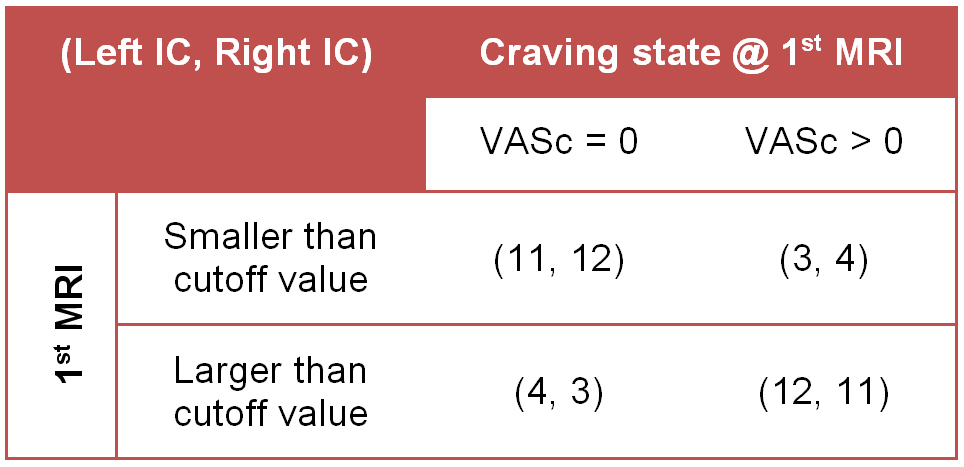
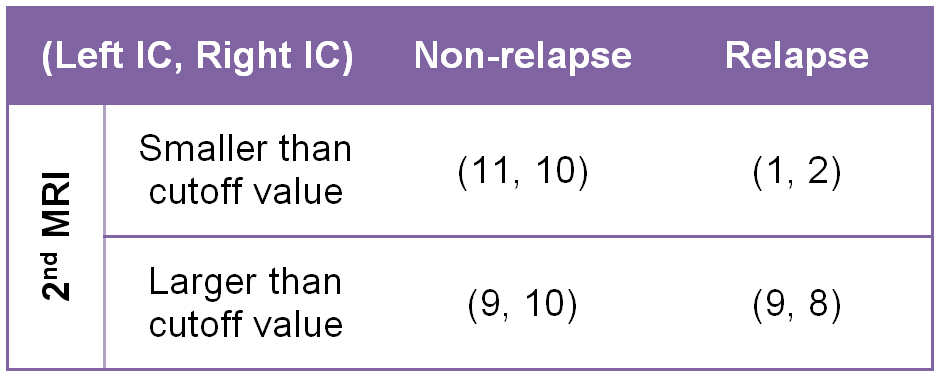
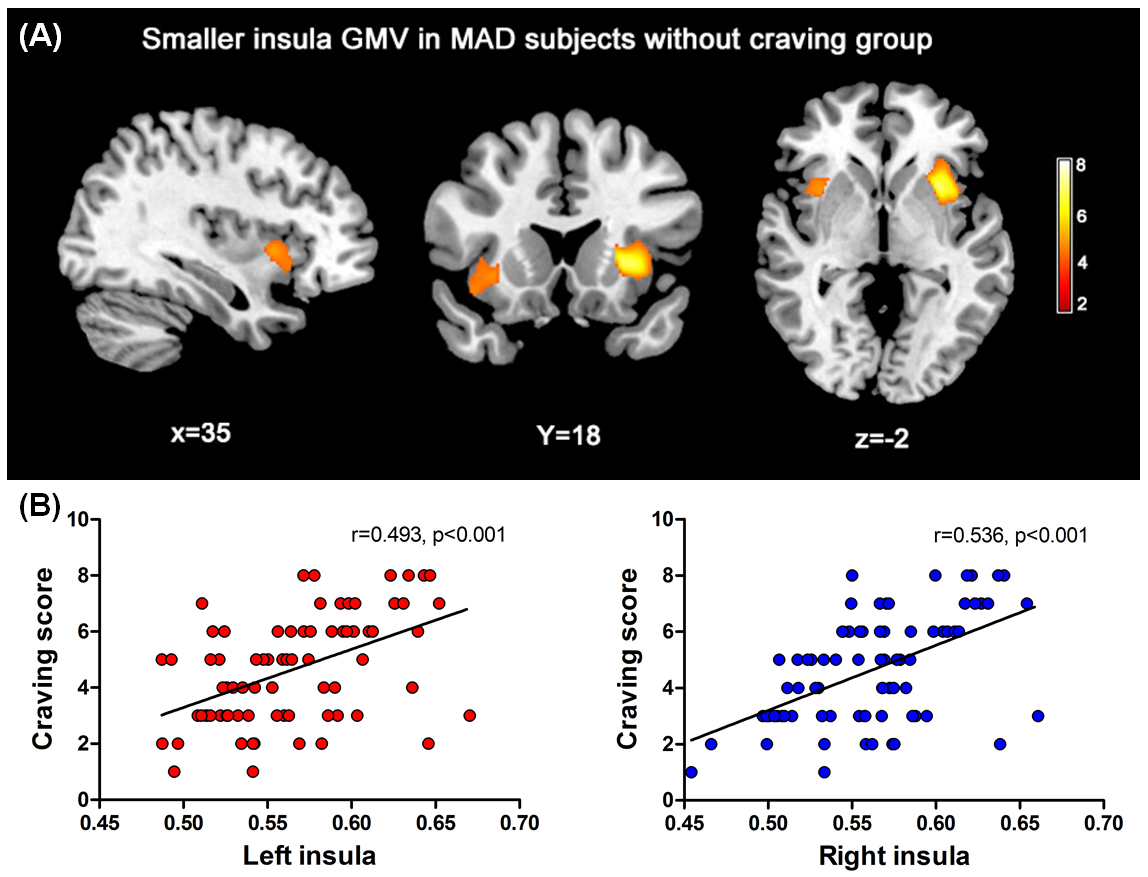
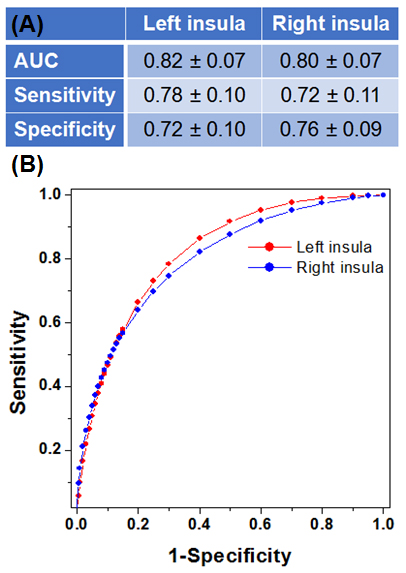
By comparing whole-brain volume maps (Figure 1A), the MADs without craving (n=64) had a significantly extensive decrease in IC GMV (family-wise error correction, p<0.05) than with craving group (n=78). The ROI of IC GMV had significantly positive correlation with the craving scores reported by the MADs (Figure 1B). The ROC analysis for 120 random 28 patients model groups (Figure 2A - Table) and also for whole model group MADs (Figure 2B) showed that there was a good discrimination (area under curve (AUC)=0.82/0.80 left/right) for IC GMV between the MADs with and without craving. By selecting Youden index cut-off point from whole model group, calculated sensitivity/specificity was equal to 78%/70% and 70%/75% for left and right IC, respectively. By applying the above optimal cut-off values to 30 follow-up MADs as validations, 2×2 contingency tables were constructed for MADs with and without craving (reported at the 1st MRI, Table 2), and relapse and non-relapse (evaluated at the 2nd MRI, Table 3). The results from the contingency tables showed a very similar sensitivity (73-80%) and specificity (73-80%) for detecting craving state as model group. However, there was lower sensitivity (50-55%) and high specificity (80-90%) for predicting relapse susceptibility. The follow-up MADs reported the peak non-relapse period was ~200 days of abstinence of MA.DISCUSSION
Our study provides the first evidence that sMRI could be used to diagnosis the craving state in MADs based on optimal cut-off values, which could be served as MRI bio-markers and an objective measure of craving state. The smaller IC GMV could alter the insula network, which is critical for the loss of addiction.5 Although the sMRI had low sensitivity to diagnose non-relapse, it had high specificity for predicting of relapse. The reason for low sensitivity was that IC GMV was increased with length of abstinence for some non-relapse MADs. Nevertheless, the degree of outcome predictability based on our sMRI findings is very valuable for clinical diagnosis and treatment for abstinence users.Acknowledgements
This study was supported by National Natural Science Foundation of China (grant no. 81371465 and 81671324 to TL, 81100996 and 81671325 to Y.L, 81371480 to J.T), and the Hunan Provincial Natural Science Foundation of China (grant no. 2015JJ2180 to TL). One of the authors (CQ) wishes to acknowledge the support of the China Scholarship Council (grant no. 201506370133) for her scholarship to study abroad.References
1. Hubbard RL, Craddock SG, Flynn PM, Anderson J, and Etheridge RM. Overview of 1-year followup outcomes in the Drug Abuse Treatment Outcome Study (DATOS). Psychology of Addictive Behaviors 11(4): 261-278, 1997.
2. Droutman V, Read SJ, Bechara A: Revisiting the role of the insula in addiction. Trends in cognitive sciences 2015; 19:414-420
3. Naqvi NH, Bechara A: The hidden island of addiction: the insula. Trends in neurosciences 2009; 32:56-67
4. Mottola CA: Measurement strategies: the visual analogue scale. Advances in Skin & Wound Care 1993; 6:56-66
5. Claus ED, Blaine SK, Filbey FM, et al: Association between nicotine dependence severity, BOLD response to smoking cues, and functional connectivity. Neuropsychopharmacology 2013; 38:2363-2372
Figures