3655
Deep learning convolutional neural networks accurately classify genetic mutations and survival in gliomas1Radiology, University of California, San Francisco, San Francisco, CA, United States, 2Department of Radiological Sciences, University of California, Irvine, Orange, CA, United States
Synopsis
Gliomas represents a heterogeneous group of tumors with variable response to therapy despite sharing overlapping morphologic features. These differing outcomes partly relates to the multiple genetic mutations. For example, mutations in isocitrate dehydrogenase (IDH1) demonstrate significantly better survival compared to their wild counterparts1,2. Therefore, an obstacle in glioma imaging analysis is that radiographic interpretation fails to account for the tumoral genetic variance, making it difficult to integrate clinically relevant biological activities. The primary objective of this abstract is to use a convolutional neural network (CNN) approach to discover specific imaging patterns predictive of the underlying genetic alterations of gliomas.
INTRODUCTION
Gliomas demonstrate variable clinical courses, despite being morphologically similar. This prognostic variability is, in part, attributed to the heterogeneity in the tumor’s microenvironment. For example, IDH mutant GBMs demonstrates significantly improved survivorship (31 months vs. 15 months)1,2. In the post-treatment setting, mutations to the MGMT promoter demonstrates a better response to chemotherapy3. While tissue sampling remains the gold-standard, patients may often wait 1-2 weeks before resection and another 1-2 weeks for genetic results to return. An automated imaging method would help expedite and coordinate care amongst surgeons, oncologists, and radiation oncologists. Therefore, there is a need to develop noninvasive imaging analysis techniques that can recognize genetic mutations clinically relevant to gliomas that are predictive of prognosis. The purpose of this study is to classify genetic variation of gliomas using a deep learning approach implemented with CNNs. We hypothesize that: (1) a CNN can be trained to independently predict underlying molecular genetic mutation status in gliomas with high accuracy, and (2) that a CNN architecture that integrates multimodal MRI data and Karnofsky performance score (KPS) can predict overall survival (OS).METHODS
Patient Selection: High and low-grade glioma patients were identified from The Cancer Genome Atlas. Corresponding multimodal MRI (T2, FLAIR, T1-pre, and post-contrast) were obtained from The Cancer Imaging Archives. For classification of underlying genetic mutations: IDH1 genetic mutation status, presence of 1p/19q chromosomal co-deletion, and epigenetic MGMT promotor methylation were recorded. With regards to survival assessment, patients with were stratified into three groups based on OS: poor (1-to-6 months), average (6-to-24 months), high (>24 months).
Image Preprocessing: For each patient, all imaging modalities were co-registered using FMRIB’s Linear Image Registration Tool. Subsequently, a fully-automated brain tumor segmentation tool was used identify lesion margins4. The masks are used to generate cropped slice-by-slice images of the tumor, which are resized to a 32 x 32 x 4 input.
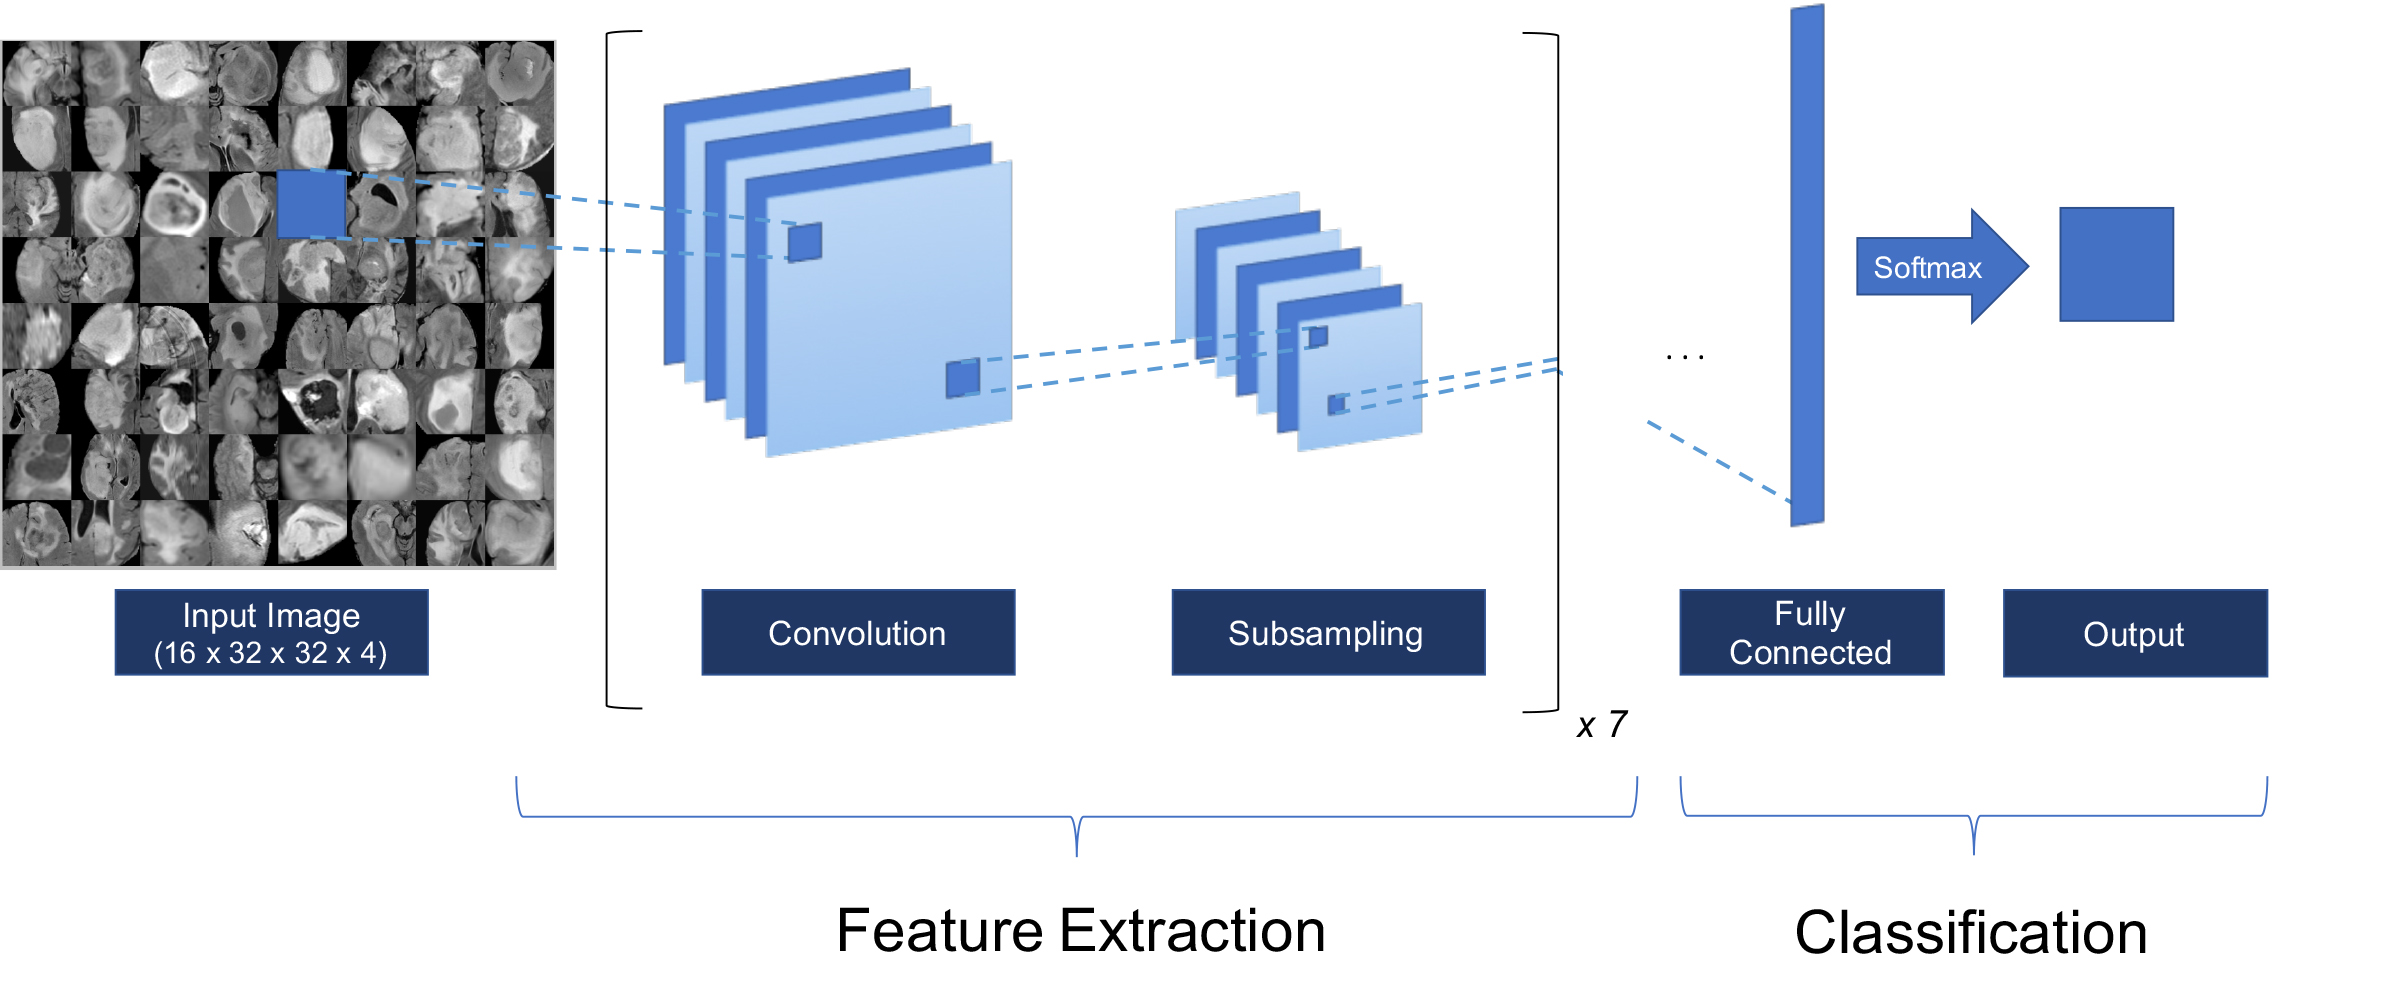
CNN Architecture: A CNN based on VGGnet architecture was created for classification. Each iteration includes two convolutions followed by a subsampling operation for a total of three iterations (Figure 1). The final fully connected layer is used to transform the feature vectors into final classification. The final feature vector was decomposed to gain insight into features learned by the algorithm using principal component analysis (PCA) with various dimensionally reduced subspaces. For OS prediction, non-imaging data were integrated into the classifier by concatenation with imaging features in the penultimate layer. PCA of the final CNN layer was also used to extract the key imaging features critical for successful classification.
RESULTS
Patient Selection: A total of 5,259 axial slices of tumor from 259 glioma patients (135 males/122 females/2 unknown; mean age 53.2 years; mean survival 18.8 years) were included.
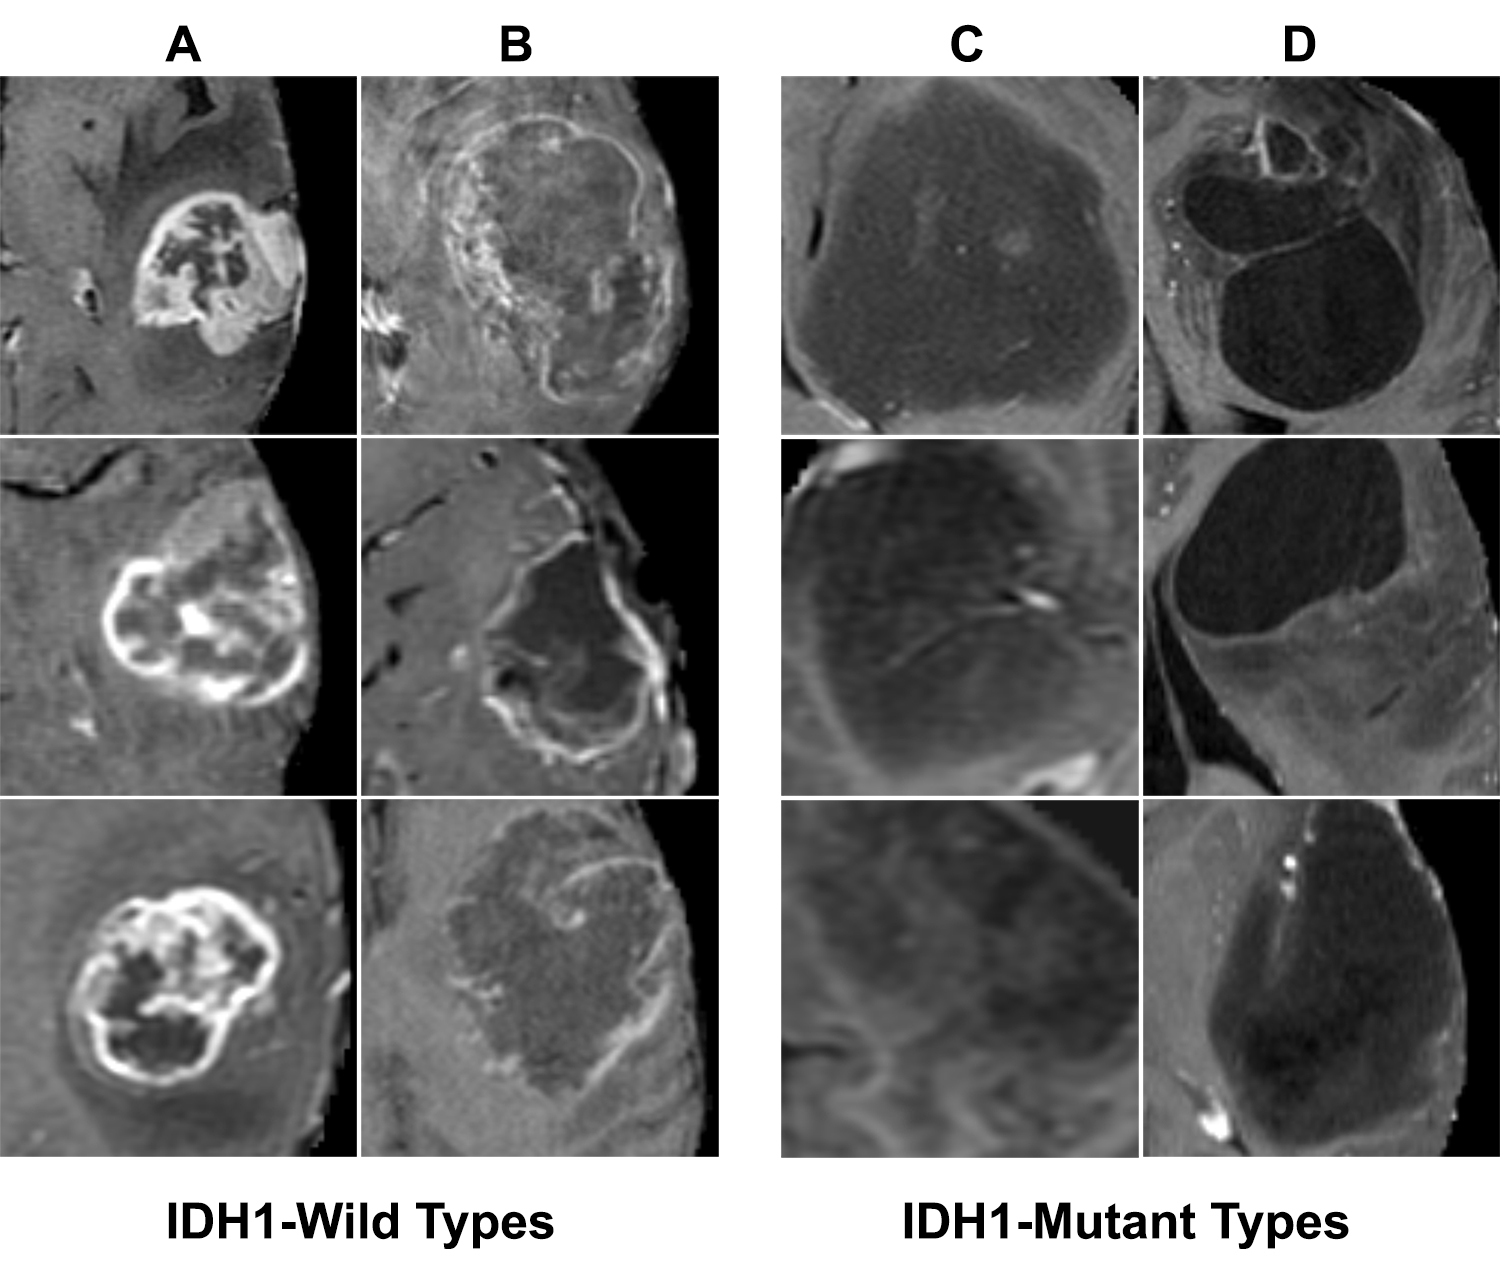
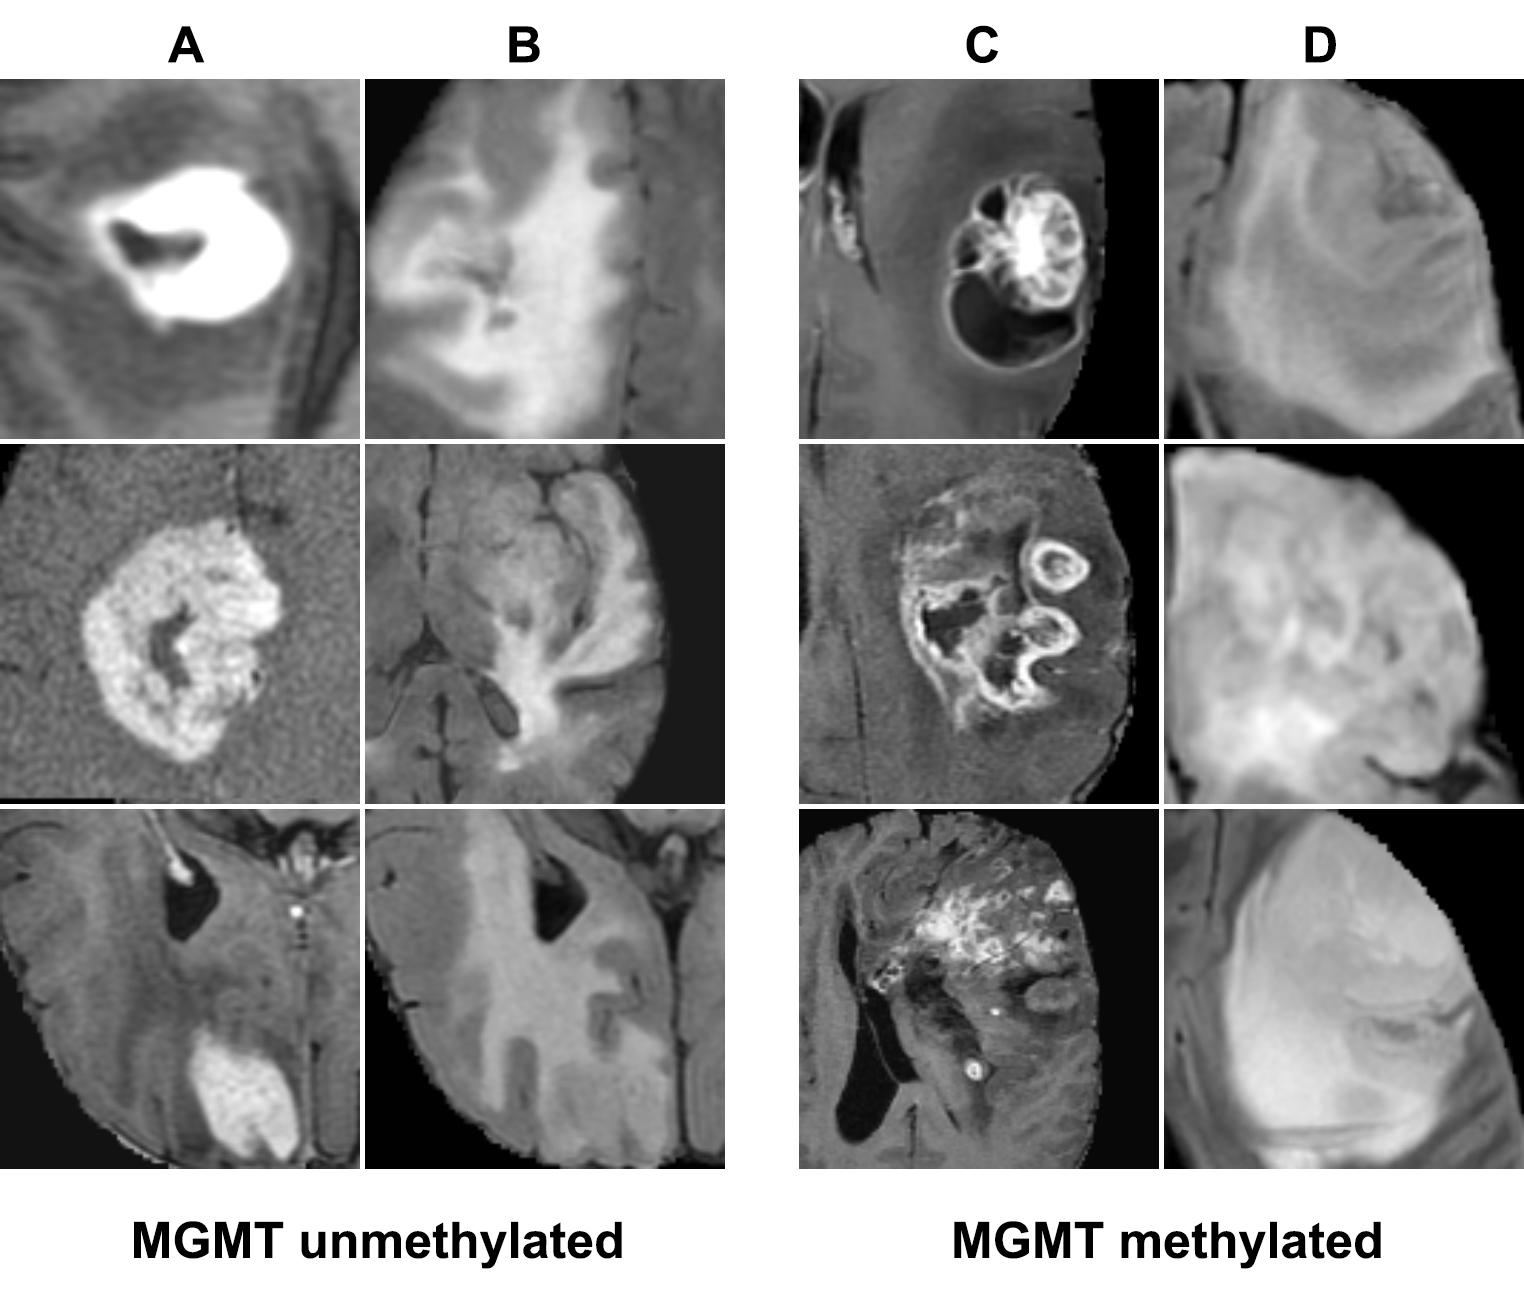
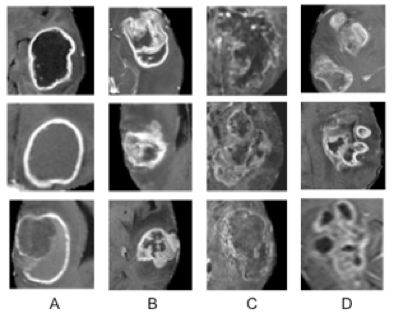
Classification of genetic status: Overall the algorithm correctly predicted IDH1 mutation (mean 94%; range between cross validations: 90-96%), 1p/19q co-deletion (92%; 88-95%) and MGMT promoter methylation (83%; 76-88%) on five-fold cross-validation. The CNN was trained for a total of 25,000 iterations (approximately 3000 epochs with batch sizes ranging from 12-48) before convergence. Each genetic category was also associated with distinctive imaging features (Figures 2-4).
Survival Classification: Single-factor ANOVA did not detect a significant difference in OS based on tumor volume, lobe location, or KPS parameters individually. However, integrated multimodal CNN accurately predicted survival cohort in 82% of patients by five-fold validation. Features most highly correlated with survival were identified (Figure 5).
DISCUSSION
The results of our study show the feasibility of a deep learning CNN approach for the accurate classification of individual genetic mutations of both LGG and HGGs. Additionally, we demonstrate that the relevant MRI features acquired from an added dimensionality reduction technique are concordant with existing literature (see figure captions), showing that neural networks are capable of learning key imaging components without prior feature selection or human directed training. Lastly, we demonstrate a modified CNN approach that integrates both imaging and clinical data, two seemingly different types of data can classify survivorship. Present normograms for the survival of patients with newly diagnosed gliomas have an achieved accuracy of approximately 60%5. However, our integrated multimodal CNN approach can accurately predict survival in this cohort with an accuracy of 82%. Future classification schemes that integrate the tumoral genetic data with imaging will likely improve accurate prognostic information on a patient-by-patient basis, a move towards personalized treatment regimens for precision health.CONCLUSSION
In summary, the results of our study that a CNN approach can accurately predict underlying genetic mutation status as well as survivorship in glioma patients.Acknowledgements
Funding support from Toshiba Medical, a Canon Group company.References
- Nobusawa, S., Watanabe, T., Kleihues, P. & Ohgaki, H. IDH1 mutations as molecular signature and predictive factor of secondary glioblastomas. Clin Cancer Res 15, 6002-6007, doi:10.1158/1078-0432.CCR-09-0715 (2009).
- Yan, H. et al. IDH1 and IDH2 mutations in gliomas. N Engl J Med 360, 765-773, doi:10.1056/NEJMoa0808710 (2009).
- Hegi, M. E. et al. MGMT gene silencing and benefit from temozolomide in glioblastoma. N Engl J Med 352, 997-1003, doi:10.1056/NEJMoa043331 (2005).
- Chang, P. D. in Brainlesion: Glioma, Multiple Sclerosis, Stroke and Traumatic Brain Injuries: Second International Workshop, BrainLes 2016, with the Challenges on BRATS, ISLES and mTOP 2016, Held in Conjunction with MICCAI 2016, Athens, Greece, October 17, 2016, Revised Selected Papers (eds Alessandro Crimi et al.) 108-118 (Springer International Publishing, 2016).
- Gorlia, T. et al. Nomograms for predicting survival of patients with newly diagnosed glioblastoma: prognostic factor analysis of EORTC and NCIC trial 26981-22981/CE.3. Lancet Oncol 9, 29-38, doi:10.1016/S1470-2045(07)70384-4 (2008).
- Carrillo, J. A. et al. Relationship between tumor enhancement, edema, IDH1 mutational status, MGMT promoter methylation, and survival in glioblastoma. AJNR Am J Neuroradiol 33, 1349-1355, doi:10.3174/ajnr.A2950 (2012).
- Qi, S. et al. Isocitrate dehydrogenase mutation is associated with tumor location and magnetic resonance imaging characteristics in astrocytic neoplasms. Oncology letters 7, 1895-1902, doi:10.3892/ol.2014.2013 (2014).
- Sonoda, Y. et al. Association between molecular alterations and tumor location and MRI characteristics in anaplastic gliomas. Brain Tumor Pathol 32, 99-104, doi:10.1007/s10014-014-0211-3 (2015).
- Metellus, P. et al. Absence of IDH mutation identifies a novel radiologic and molecular subtype of WHO grade II gliomas with dismal prognosis. Acta Neuropathol 120, 719-729, doi:10.1007/s00401-010-0777-8 (2010).
- Xiong, J. et al. Combination of diffusion tensor imaging and conventional MRI correlates with isocitrate dehydrogenase 1/2 mutations but not 1p/19q genotyping in oligodendroglial tumours. Eur Radiol 26, 1705-1715, doi:10.1007/s00330-015-4025-4 (2016).
- Johnson, D. R. et al. Genetically Defined Oligodendroglioma Is Characterized by Indistinct Tumor Borders at MRI. AJNR Am J Neuroradiol 38, 678-684, doi:10.3174/ajnr.A5070 (2017).
- Ellingson, B. M. et al. Probabilistic radiographic atlas of glioblastoma phenotypes. AJNR Am J Neuroradiol 34, 533-540, doi:10.3174/ajnr.A3253 (2013).
- Paldor, I., Pearce, F. C., Drummond, K. J. & Kaye, A. H. Frontal glioblastoma multiforme may be biologically distinct from non-frontal and multilobar tumors. Journal of clinical neuroscience : official journal of the Neurosurgical Society of Australasia 34, 128-132, doi:10.1016/j.jocn.2016.05.017 (2016).
- Drabycz, S. et al. An analysis of image texture, tumor location, and MGMT promoter methylation in glioblastoma using magnetic resonance imaging. NeuroImage 49, 1398-1405, doi:10.1016/j.neuroimage.2009.09.049 (2010).
- Moon, W. J., Choi, J. W., Roh, H. G., Lim, S. D. & Koh, Y. C. Imaging parameters of high grade gliomas in relation to the MGMT promoter methylation status: the CT, diffusion tensor imaging, and perfusion MR imaging. Neuroradiology 54, 555-563, doi:10.1007/s00234-011-0947-y (2012).
Figures