3653
Genetic influence on Brain Microstructure and Cognitive Function and Change in an Ageing Cohort1University of Copenhagen, Center For Healthy Ageing, Copenhagen, Denmark, 2Functional Imaging Unit, Dept. of Clinical Physiology, Nuclear Medicine and PET, University Hospital Rigshospitalet, Glostrup, Copenhagen, Denmark, 3Dept. of Clinical Physiology and Nuclear Medicine, Copenhagen University Hospital Bispebjerg, Copenhagen, Denmark, 4Psychiatry, Glostrup Hospitalet, Glostrup Hospitalet, Copenhagen, Denmark
Synopsis
The notion that the brain’s early-life retains hints to its end is an evolving avenue explored by basic and clinical researchers alike. Implementing neuroimaging, genetics and neuropsychological tests, our focus is to unravel the complex process of brain ageing through characterisation of normal brain development in a longitudinal ageing cohort. This approach has the power to unveil robust candidate determinants responsible for the vulnerability of the ageing brain to late-life pathology. We demonstrate statistically significant correlations between common genetic variants, white-matter integrity and cognitive ability and change, highlighting biological risk-factors as mediators of differential trajectories of ageing.
Background: Initially the deferral of human mortality was perceived as a public-health success story. More recently however, human longevity has presented its gloomier nuances. At its epicenter, the silent epidemic of population ageing has inflated the number of people afflicted with neural disorders, creating a combined social and economical burden1.
Subsequently, the necessity of early disease discovery within an ever-rising preclinical population through identification of candidate determinants is urgent2. With increased age, we observe alterations in brain homeostasis, a decline in cognitive function, and an increased risk factor for nervous system dysfunction3,4,5. Common genetic variations identified by genome-wide association studies (GWAS) have shown to be liable for much of the observed variance in both cognitive function, and brain microstructure of ageing individuals6,7,8,9.
Currently, ageing research has highlighted the role of early-life cognitive ability as the primary predictor of the ageing trajectory that succeeds it10. That is, a greater early-life IQ score is accountable for almost half the variation observed in cognitive abilities at old-age11. However, although studies correlating predictors of cognitive ability in late-life are popular, studies identifying predictors of cognitive change at midlife are scarce12,13,14.
Presently, we investigate whether brain micro-structural variations, inferred by Diffusion Tensor Imaging (DTI), mediates both baseline cognitive performance and change in cognitive ability. Furthermore, we explore which genetic variations are important contributors of the brain micro-structural variation seen among our subjects. Thus, implementing a multimodal approach, we explore the relationship between genes, brain structure, and cognitive function using members of the Metropolit 1953 Danish male birth cohort.
Method: N=200 members selected based on their estimated change in cognitive function acquired at ages 20 ( Børge Priens Prøve (BPP) ) and 57 (Intelligence Structure Test (IST-R) ), underwent repeat extensive phenotypic assessment measuring cognition, physical and mental health, lifestyle and sociodemographic status. All subjects underwent whole brain MRI scanning using a 3.0 T Philips Achieva.
During rest conditions, anatomical high resolution 3D T1-weighted images using gradient echo sequence (TR/TE = 6.9/2.8 ms; flip angle = 90; voxel size = 1.8 x 1.8 x 9.5 mm), and diffusion weighted images (DWI) utilizing a single spin-echo echo-planar imaging sequence (TR/TE = 9729/55; matrix =112 x 110 x 60; voxel dimension = 2 x 2.04 x 2 mm3) were obtained.
For each DWI scan, 33 images were acquired: 1 T2-weighted with no diffusion sensitization (b0 image), and 33 diffusion-weighted images (b = 1000s/mm2). All T1-weighted MR and DWI images were visually inspected in their raw state for corrupted datasets, excessive motion, and potential artifacts; all scans were included. Analysis of DWI data, including tensor calculations was performed using FMRIB toolbox FSL v815. This allowed us to make inferences regarding the implicated role of global fractional anisotropy (FA) and mean diffusivity (MD) in white matter health and development.
Genome mapping was performed using Illumina array (HumanOmniExpress-12), providing 719665 SNPs. PLINK 1.9 was thus used to remove substandard genetic variants and samples. This included SNPs or individuals with elevated missing data, outlying heterozygosity, non-Caucasian descent, relatedness, as well as typing errors. Furthermore, we excluded all genetic variants displaying a minor-allele frequency (MAF) below the default threshold value of 0.01, and variants that presented extreme deviations (threshold of p < 0.0001) from the Hardy-Weinberg equilibrium (HWE), yielding a total of 565478 SNPs of adequate quality. An ensemble of SNPs previously associated with longevity, cognitive function and decline, metabolism, mitochondrial function and DNA repair were identified, and their association with cognition, FA and MD in the present sample was estimated. The effect of each polymorphic SNP and cognitive variables was estimated using GLM in SPSS v12. Statistical significance was set to p < 0.05.
Results: We found significant associations between risk-associated genotypes COMT, BDNF, NRG1, IGF-1, DRD-2, NOS, DISC1, DAPK1, SIRT1, FOXO3 and cognitive performance tests IST-R and BPP. Furthermore, significant associations were also observed between FA and genotypes FOXO3 and COMT, MD and FOXO3, axial diffusivity (L1) and FOXO3 and NRG1, and mode (MO) and genes COMT, Neil2 and SIRT1. Finally, our TBSS results do not only illustrate a positive correlation between FA and cognitive performance (IST), but also a correlation between FA and cognitive change. That is, the residuals of IST and BPP regression, cognitive tests taken at ages 57 and 20 respectively.
Discussion: Our results present significant associations between common risk alleles, white-matter integrity and lower cognitive functioning, pointing strongly to a biological background for the differential development in cognition. Importantly, our results do not only identify candidate determinants of cognitive ability, but also cognitive change.
Acknowledgements
The Nordea Foundation provided financial support for this study through the Center for Healthy Ageing, University of Copenhagen. The Copenhagen Ageing and Midlife Biobank (CAMB) has been supported by a generous grant from the Velux Foundation.
The studies behind the present thesis were carried out at the Functional Imaging Unit (FIU), Department of Diagnostics, Rigshospitalet Glostrup.
References
1. Reinvang, I., (2010). Neurogenetic effects on cognition in aging brains: a window of opportunity for intervention? Frontiers in Aging Neuroscience, vol. 2., no. 143., pp. 1-15
2. Miller, K.L. (2016). Multimodal population brain imaging in the UK Biobank prospective epidemiology study, Nature Neuroscience, vol. 19, pp. 1523-1536
3. Salthouse, T. A. (2010). Selective review of cognitive aging. Journal of the International Neuropsychological Society, 16(05), 754–760
4. Oh, G., et al., Epigenetic assimilation in the aging human brain. Genome Biol, 2016. 17: p. 76
5. Beltran-Sanchez, H., S. Soneji, and E.M. Crimmins, Past, Present, and Future of Healthy Life Expectancy. Cold Spring Harb Perspect Med, 2015. 5(11)
6. Petrella, J. R., Mattay, V. S., & Doraiswamy, P. M. (2008). Imaging genetics of brain longevity and mental wellness: the next frontier? Radiology, 246(1), 20–32
7. Harris, S. E., Fox, H., Wright, A. F., Hayward, C., Starr, J. M., Whalley, L. J., & Deary, I. J. (2007). A genetic association analysis of cognitive ability and cognitive ageing using 325 markers for 109 genes associated with oxidative stress or cognition. BMC Genetics, 8(1), 43
8. Walter, S., (2011). A Genome-Wide Association Study of Aging. Neurobiology of Aging, vol. 32, no. 11, pp. 15-28
9. William, R. J., (2012). A Meta-Analysis of GWAS Studies and Age-Associated Diseases Aging Cell, vol. 11., no. 5., pp. 727–731
10. Corley, J., S.R. Cox, and I.J. Deary, Healthy cognitive ageing in the Lothian Birth Cohort studies: marginal gains not magic bullet. Psychol Med, 2017: p. 1-21
11. Plomin, R. and I.J. Deary, Genetics and intelligence differences: five special findings. Mol Psychiatry, 2015. 20(1): p. 98-108
12. Karama, S., et al., Childhood cognitive ability accounts for associations between cognitive ability and brain cortical thickness in old age. Mol Psychiatry, 2014. 19(5): p. 555-9.
13. Gunning-Dixon, F. M., Brickman, A. M., Cheng, J. C., & Alexopoulos, G. S. (2009). Aging of cerebral white matter: a review of MRI findings. International Journal of Geriatric Psychiatry, 24(2), 109–117
14. Madden, D. J., Spaniol, J., Costello, M. C., Bucur, B., White, L. E., Cabeza, R., et al. (2009). Cerebral White Matter Integrity Mediates Adult Age Differences in Cognitive Performance. Journal of Cognitive Neuroscience, 21(2), 289–302
15. Smith, S.M., J. (2006), ‘Tract-based spatial statistics: Voxelwise analysis of multi-subject diffusion data’, NeuroImage, 31:1487-1505
Figures

Linear regression analysis was utilized to distinguish members who underperformed in their IST-R relative to their BPP performance, with those who presented an improvement. An R2 = 0.51 (P < 0.0001), indicated BPP test scores were significantly correlated to later life cognitive performance in IST-R. Absolute standardized residuals were calculated and outliers (residuals >3) were omitted. To augment the potential of identifying members who exhibited genuine cognitive decline, whilst maintaining variability in subject selection, we formed two groups consisting of members attaining the highest positive residuals, Group A, and highest negative residuals, Group B. The latter group were acknowledged as those presenting sub-clinical cognitive decline.
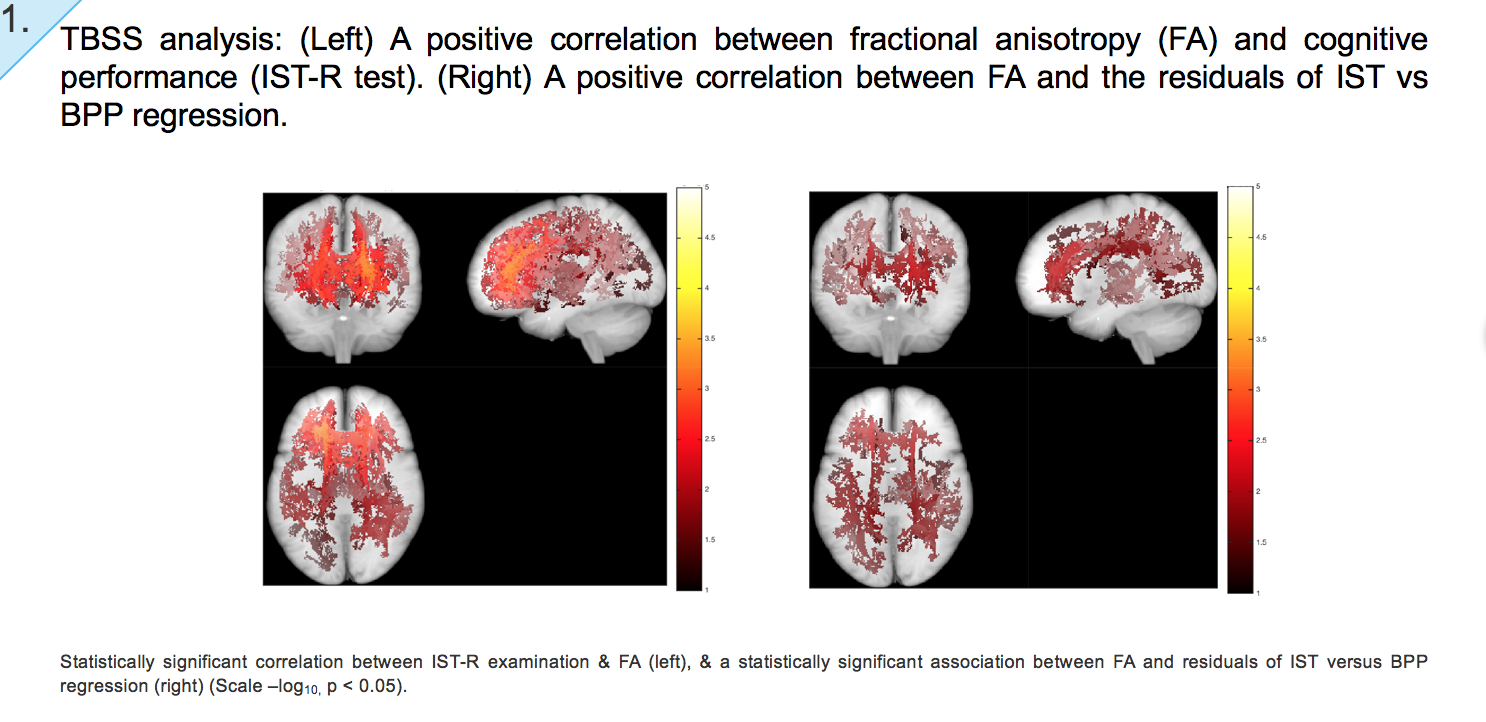

TBSS analysis: We subsequently assessed anisotropy and diffusivity correlations with GWAS-derived genetic variants, selected due to their role in longevity, DNA repair, and cognitive function and decline. Our results indicate WM regions where anisotropy and diffusivity variation is correlated with the risk score denoted for a given genotype. Scale –log10, p < 0.05.
- Left: Negative association between FA and risk allele score for longevity gene FOXO3 (rs1935949)
- Centre: Negative association between FA and risk allele score for IGF2 (rs712900)
- Right: Positive association between MD and risk allele score for FOXO3 (rs1935949)
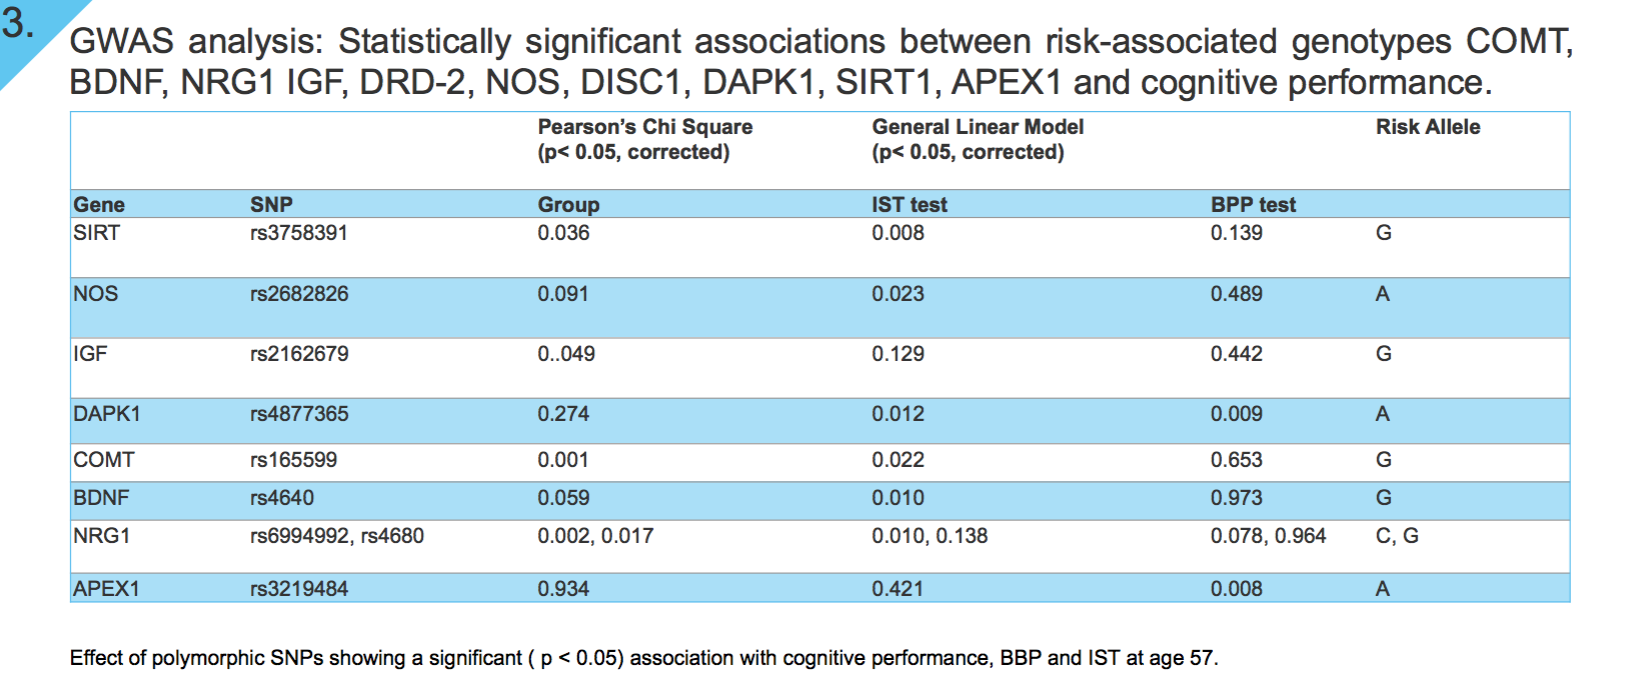
GWAS analysis: Results from univariate analyses in SPSS, identifying genetic variants that influence performance in IST-R and BPP in our study-sample are shown in Figure 3. We identified that a higher BPP score is associated with lower “risk allele” load in SNPs found on APEX1 gene (rs3219484), and DAPK1 gene (rs4877365). Similarly, a higher performance in IST-R was associated to a lower “risk allele” load in SNPs on genes SIRT (rs3758391), NOS (rs2682826), DAPK1 (rs4877365), COMT (rs165599), BDNF (rs4640), and NRG1 (rs6994992). Multiple testing for number of SNPs and traits analyzed was corrected for by Bonferroni method, p <0.05.
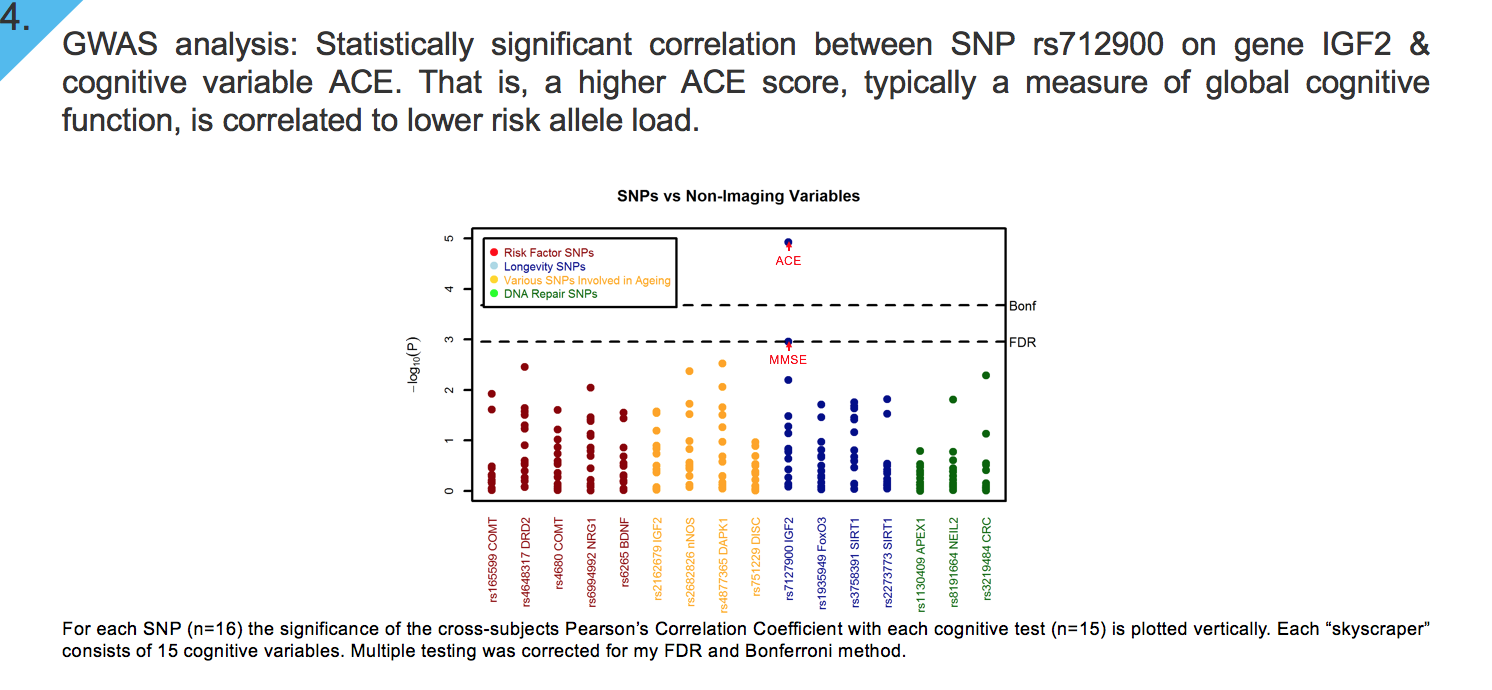
GWAS analysis: We assessed the association between each SNP with a subset of neuropsychological tests.The x-axis identifies SNP function by colour, whilst dotted horizontal line depicts thresholds used for multiple testing correction with FDR (Puncorrected = 3.8 x 10⁻⁵) and Bonferroni method (Puncorrected = 1.8 x 10⁻⁸).
Our results indicate that there is a significant association between SNP rs712900 on gene IGF2 and cognitive test Addenbrooke’s cognitive examination (ACE). That is, a higher ACE score, a clinical cognitive test typically used as global measure of cognitive function, is significantly negatively associated with risk allele load of SNP rs712900.