3651
Relationship between brain and gut in autism spectrum disorder using diffusion MRI and intestinal bacteria gene analysis1Department of Biomedical Engineering, National Yang-Ming University, Taipei, Taiwan, Taipei, Taiwan, 2Department and Institute of Physiology, National Yang-Ming University, Taipei, Taiwan, Taipei, Taiwan, 3The PhD Program for Neural Regenerative Medicine, Taipei Medical University, Taipei, Taiwan, Taipei, Taiwan
Synopsis
Brain-behavior-gut-microbiome interaction, a bidirectional communication, was proposed as an important role in autism spectrum disorders (ASD). However, the correlation among gut microbiota, behavioral performance, and brain microstructure in ASD are remained unclear. We chose a VPA-exposed rat model which performed autistic behaviors to investigate their brain-behavior-gut interaction. Diffusion MRI, behavioral tests, and intestinal bacteria gene analysis were applied in this study. The findings implied that the altered brain microstructure and atypical distribution of the gut microbiota associate with the severity of the autistic behavior in ASD compared to the control group.
Introduction
Autism spectrum disorders (ASD) are a group of neurodevelopment disorders with social interaction deficits and often show comorbidity with emotional disorders. The altered brain structure and function was associated with the core symptoms in ASD 1. Notably, most individuals with ASD also reveal gastrointestinal symptoms 2. Previous studies reported that treating the gastrointestinal symptoms may reduce the behavioral or emotional deficits in ASD 3 which implied that brain-behavior-gut-microbiome interaction played an important role in ASD. The interaction of brain and gut has been elaborated in bidirectional ways: (a) Gut microbiota induce neural signaling via the autonomic nervous system to the brain then cause the change of microbiota distribution and activity 4, 5. (b) Metabolic production of microbiota are carried and absorbed by the blood system then effect brain regulation 6. However, the correlation among gut microbiota, behavioral performance, and brain microstructure in ASD are still unclear. Since valporic acid (VPA) was demonstrated as a risk factor of ASD 7, 8, we chose a VPA-exposed rat model which performed autistic behaviors to investigate their brain-behavior-gut interaction. We hypothesized that the altered brain microstructure and atypical distribution of the gut microbiota associate with the severity of the autistic behavior in ASD compared to the control group.Methods
Valproate acid (NaVPA, Sigma-Aldrich, St. Louis, MO, USA) was dissolved in 0.9% saline (150mg/mL), pH 7.3. The NaVPA was given to the rats on the 12-13 days from the pregnancy by single intraperitoneal injection 9, while the control group were injected with saline. Three-chambered test to evaluate social interaction of rats, and applied the marble-burying test to assess their anxiety performance. The images were acquired on a 7T MRI scanner (BioSpin 70/30; Bruker GmbH, Ettlingen, Germany) . T2-weighted images was acquired: TR / TE = 2500 / 33 ms, field of view (FOV) = 25 × 25 mm2, acquisition matrix = 256 × 256 × 10, and thickness = 1 mm. Diffusion tensor images (DTI) were performed as: TR / TE = 2500 / 31.18 ms, FOV = 25 × 25 mm2, acquisition matrix = 128 × 128 × 10, 30 directions, b-values: 510, 1,025, and 2,041 s/mm2, and thickness = 1 mm. DTI analysis was using in-house software (DSI Studio: http://dsi-studio.labsolver.org). Targeted regions of interest (ROIs) were selected upon rat brain atlas 10 including hippocampus, thalamus, and amygdala (Figure 1). The white matter integrity in each targeted ROI was determined by averaging the fractional anisotropy (FA) values within the contour of each ROI. The fecal samples were collected for microbiome analysis. After DNA extraction, the sample was applied on the Illumina MiSeq® System for 16S rRNA Sequencing, and the alpha/beta diversity and the taxonomy assignment were analyzed. The behavioral test, MRI scan, and the collection of fecal samples were conducted at 3, 5 and 7 weeks after postnatal day of each rats in this study.Results
In the three-chambered social behavior test, VPA-exposed group showed significant longer chamber duration in the empty chamber at week 3 and 5 as compared to the control group. The average number of buried marbles were higher in VPA-exposed group than control group (Figure 2). Averaged FA values in the amygdala, hippocampus, and thalamus were significant lower in the VPA-exposed group at week 7 compared to the control group (Figure 3). Increased alpha diversity of the microbiome analysis presented through the weeks, and the VPA-exposed group showed higher diversity than control group. Especially, Firmicuties and Bacteroides were two major components in the gut microbiota in both group and the ratio of them was the highest at week 3. (Figure 4)Discussion
Poorer social interaction and more anxiety behaviors showed in the VPA-exposed group as compared to the control group. Hippocampus, amygdala, and thalamus modulated emotion and memory 11 which may associate with the social and emotion impairment in ASD. We found white matter integrity altered in the three brain regions in the VPA-exposed group. VPA-exposed group showed higher proportion of Firmicutes which was consistent with previous study 12. At week 3, the poorer social interaction and the higher Firmicutes/Bacteroides ratio were presented in the VPA-exposed group than control group. Our findings supported our hypothesis that the altered brain microstructure and atypical distribution of the gut microbiota associate with the severity of the autistic behavior in ASD.Conclusion
The findings implied atypical brain-behavior-gut interaction was presented in ASD from a very young age. The association between the altered brain microstructure and atypical distribution of the gut microbiota may be a potential early detector of ASD.Acknowledgements
No acknowledgement found.References
- Walker, Lindsay G, Marta L., et al., Diffusion Tensor Imaging in Young Children with Autism: Biological Effects and Potential Confounds. Biological psychiatry. 2012;72(12):1043 - 1051.
- McElhanon B.O, McCracken C, Karpen S., et al., Gastrointestinal symptoms in autism spectrum disorder: a meta-analysis. Pediatrics. 2014;133(5):872 - 83.
- Luna R.A., Savidge T.C., and Williams K.C., The Brain-Gut-Microbiome Axis: What Role Does It Play in Autism Spectrum Disorder? Curr Dev Disord Rep. 2016;3(1):75 - 81.
- Al Omran Y. and Aziz Q., The brain-gut axis in health and disease. Adv Exp Med Biol. 2014;817: 135 - 53.
- Collins, S.M., Surette M., and Bercik P., The interplay between the intestinal microbiota and the brain. Nat Rev Microbiol. 2012;10(11): 735 - 42.
- Clarke, G., Stilling R.M., Kennedy P.J., et al., Minireview: Gut microbiota: the neglected endocrine organ. Mol Endocrinol. 2014;28(8): 1221 - 38.
- Bromley RL., Mawer G., Clayton-Smith J., et al., Autism spectrum disorders following in utero exposure to antiepileptic drugs. Neurology. 2008; 71(23):1923 - 1924.
- Williams, G., King, John C., et al., Fetal valproate syndrome and autism: additional evidence of an association. Developmental Medicine & Child Neurology. 2001;43(03):202 - 206.
- Markram, K., Rinaldi T., La Mendola D., et al., Abnormal fear conditioning and amygdala processing in an animal model of autism. Neuropsychopharmacology. 2008;33(4):901 - 12.
- Paxinos, G. and Watson, Charles. The rat brain in stereotaxic coordinates. 2007: London: Academic Press.
- Richter-Levin, G., The amygdala, the hippocampus, and emotional modulation of memory. Neuroscientist. 2004;10(1):31 - 9.
- Strati, F., Cavlleri D., Duccio A., et al., New evidences on the altered gut microbiota in autism spectrum disorders. Microbiome. 2017;5(1): 24.
Figures
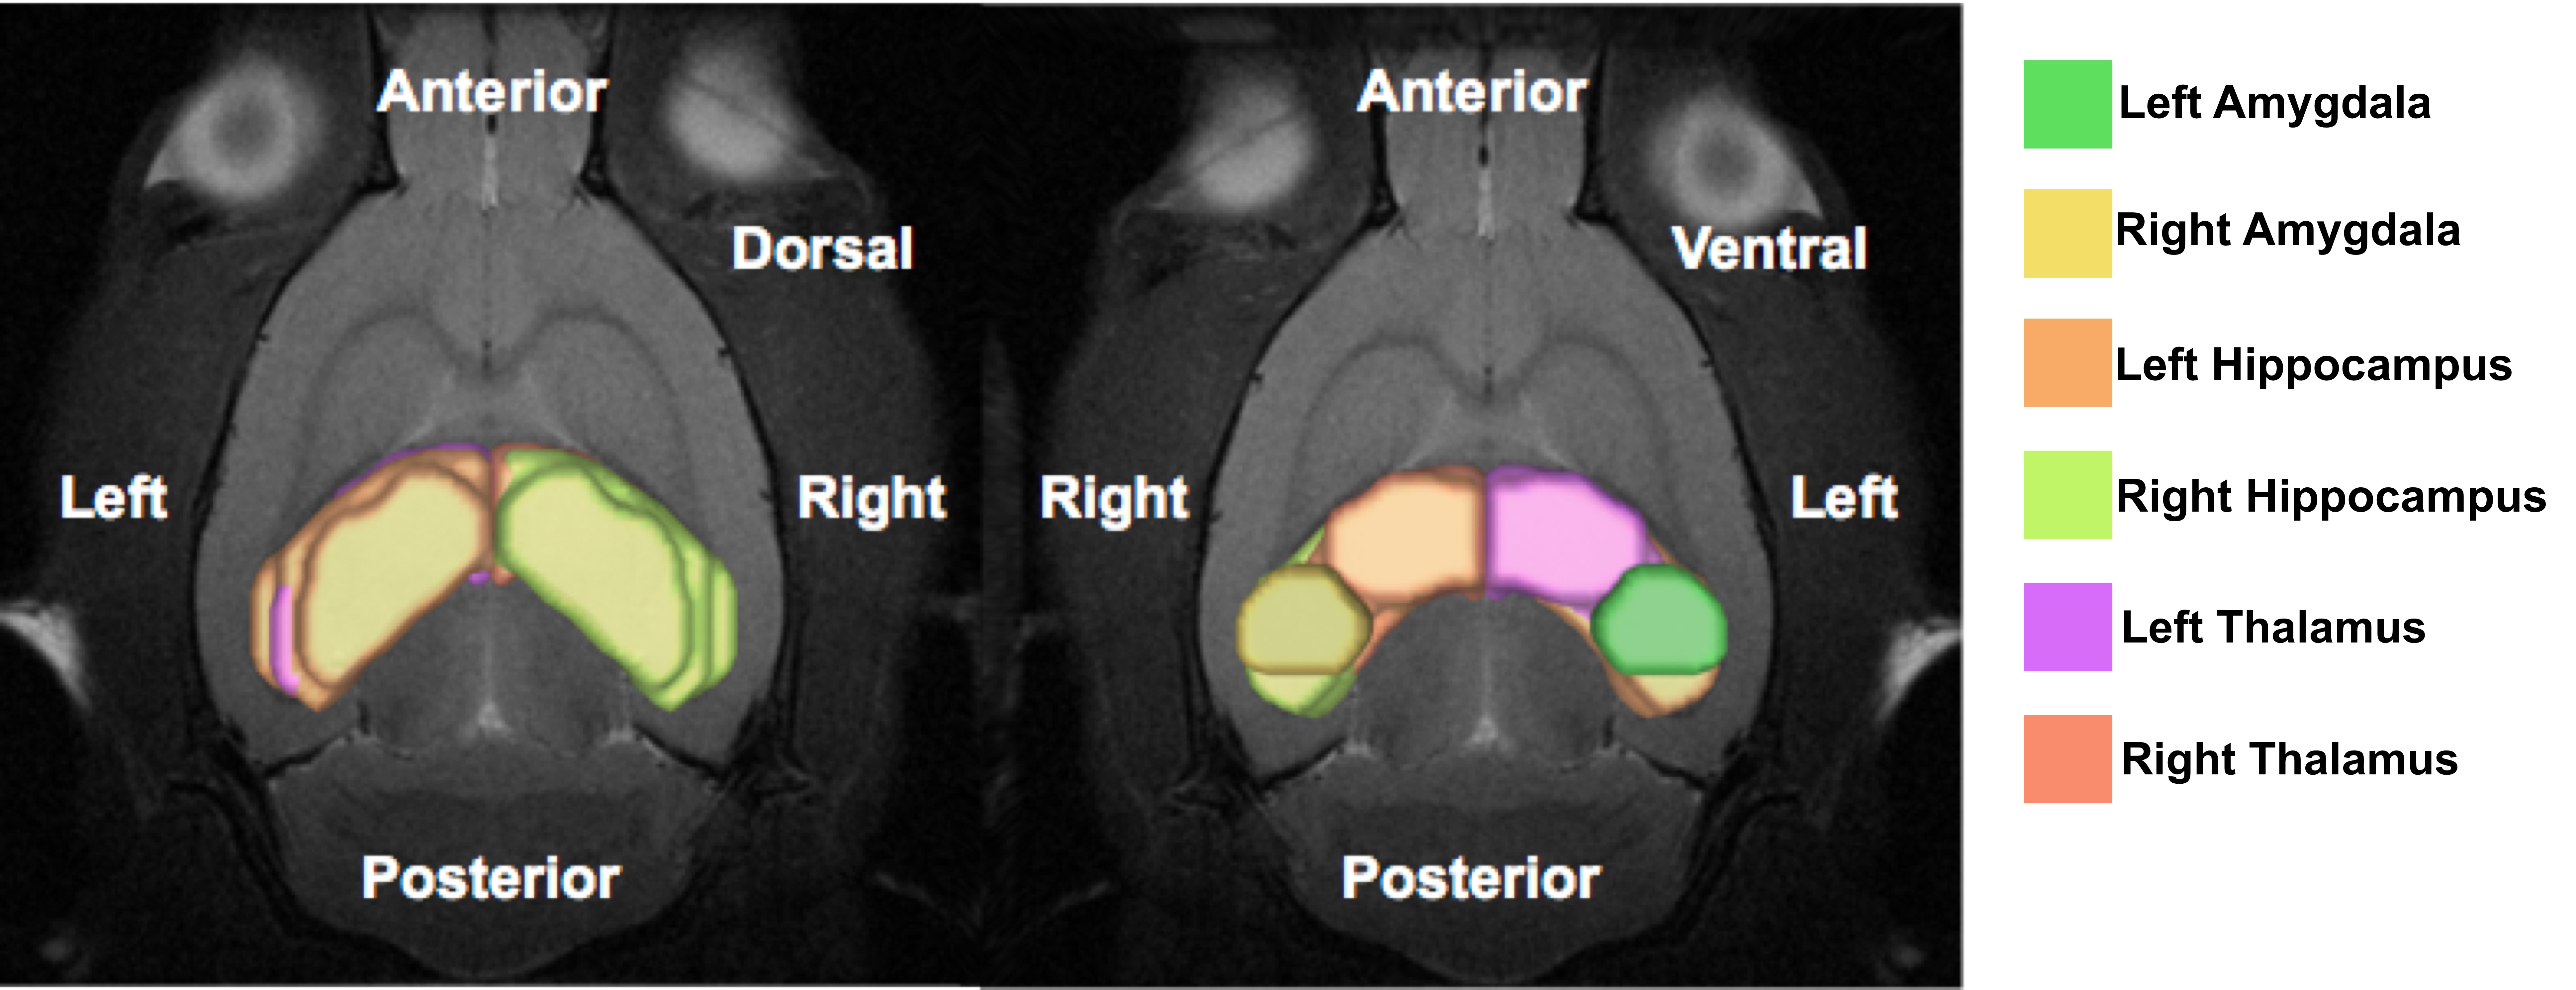
Figure 1.
Six anatomically defined brain regions of interest in the limbic system were shown, namely bilateral amygdala, hippocampus, and thalamus. The different colors indicated the index for a single ROI: green, left amygdala; yellow, right amygdala; light orange, left hippocampus, light green, right hippocampus; purple, left thalamus; orange, right thalamus.
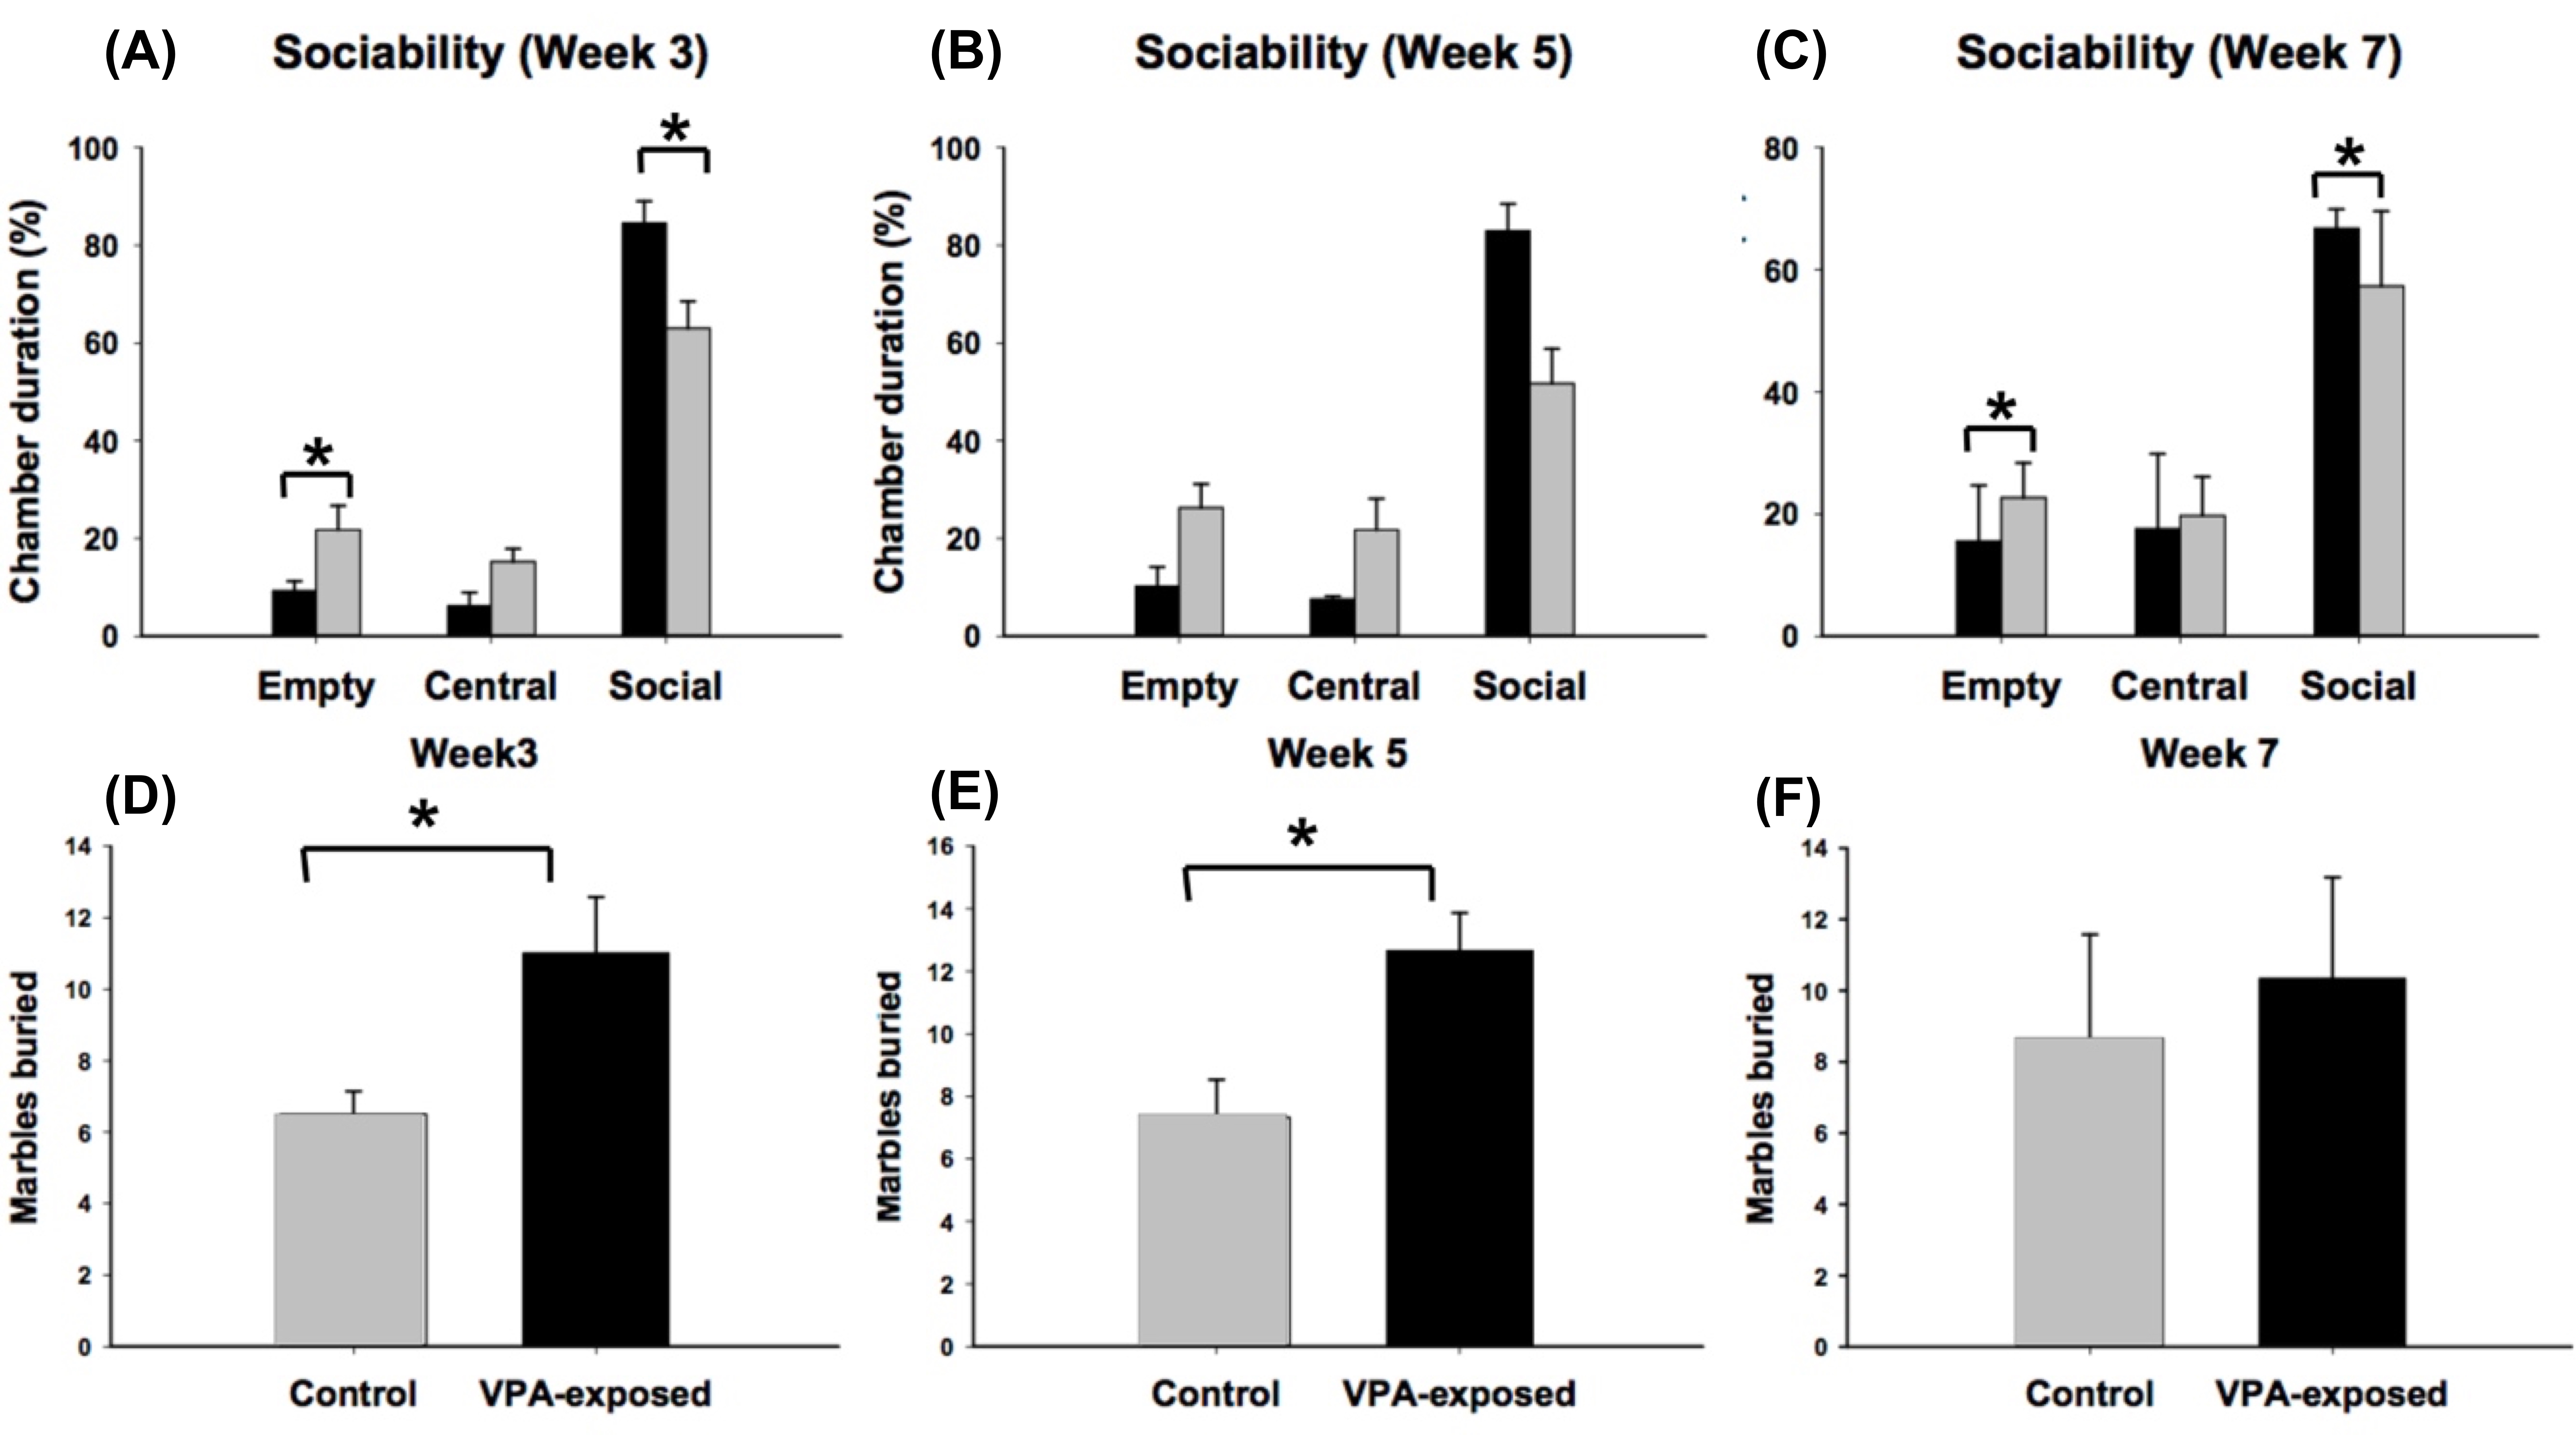
Figure 2.
VPA-exposed group spent longer time duration in the empty chamber and shorter time duration in the social chamber until week 5 as compared to the control group in the three-chambered test (upper panel). (A) the performance at week 3, (B) the performance at week 5, and (C) the performance at week 7. VPA-exposed group showed more anxiety than the control group in the marble-burying test (lower panel). (D) the performance in week 3 (E) the performance in week 5 (F) the performance in week 7.
* : p < 0.05
Abbreviation: VPA, valporic acid
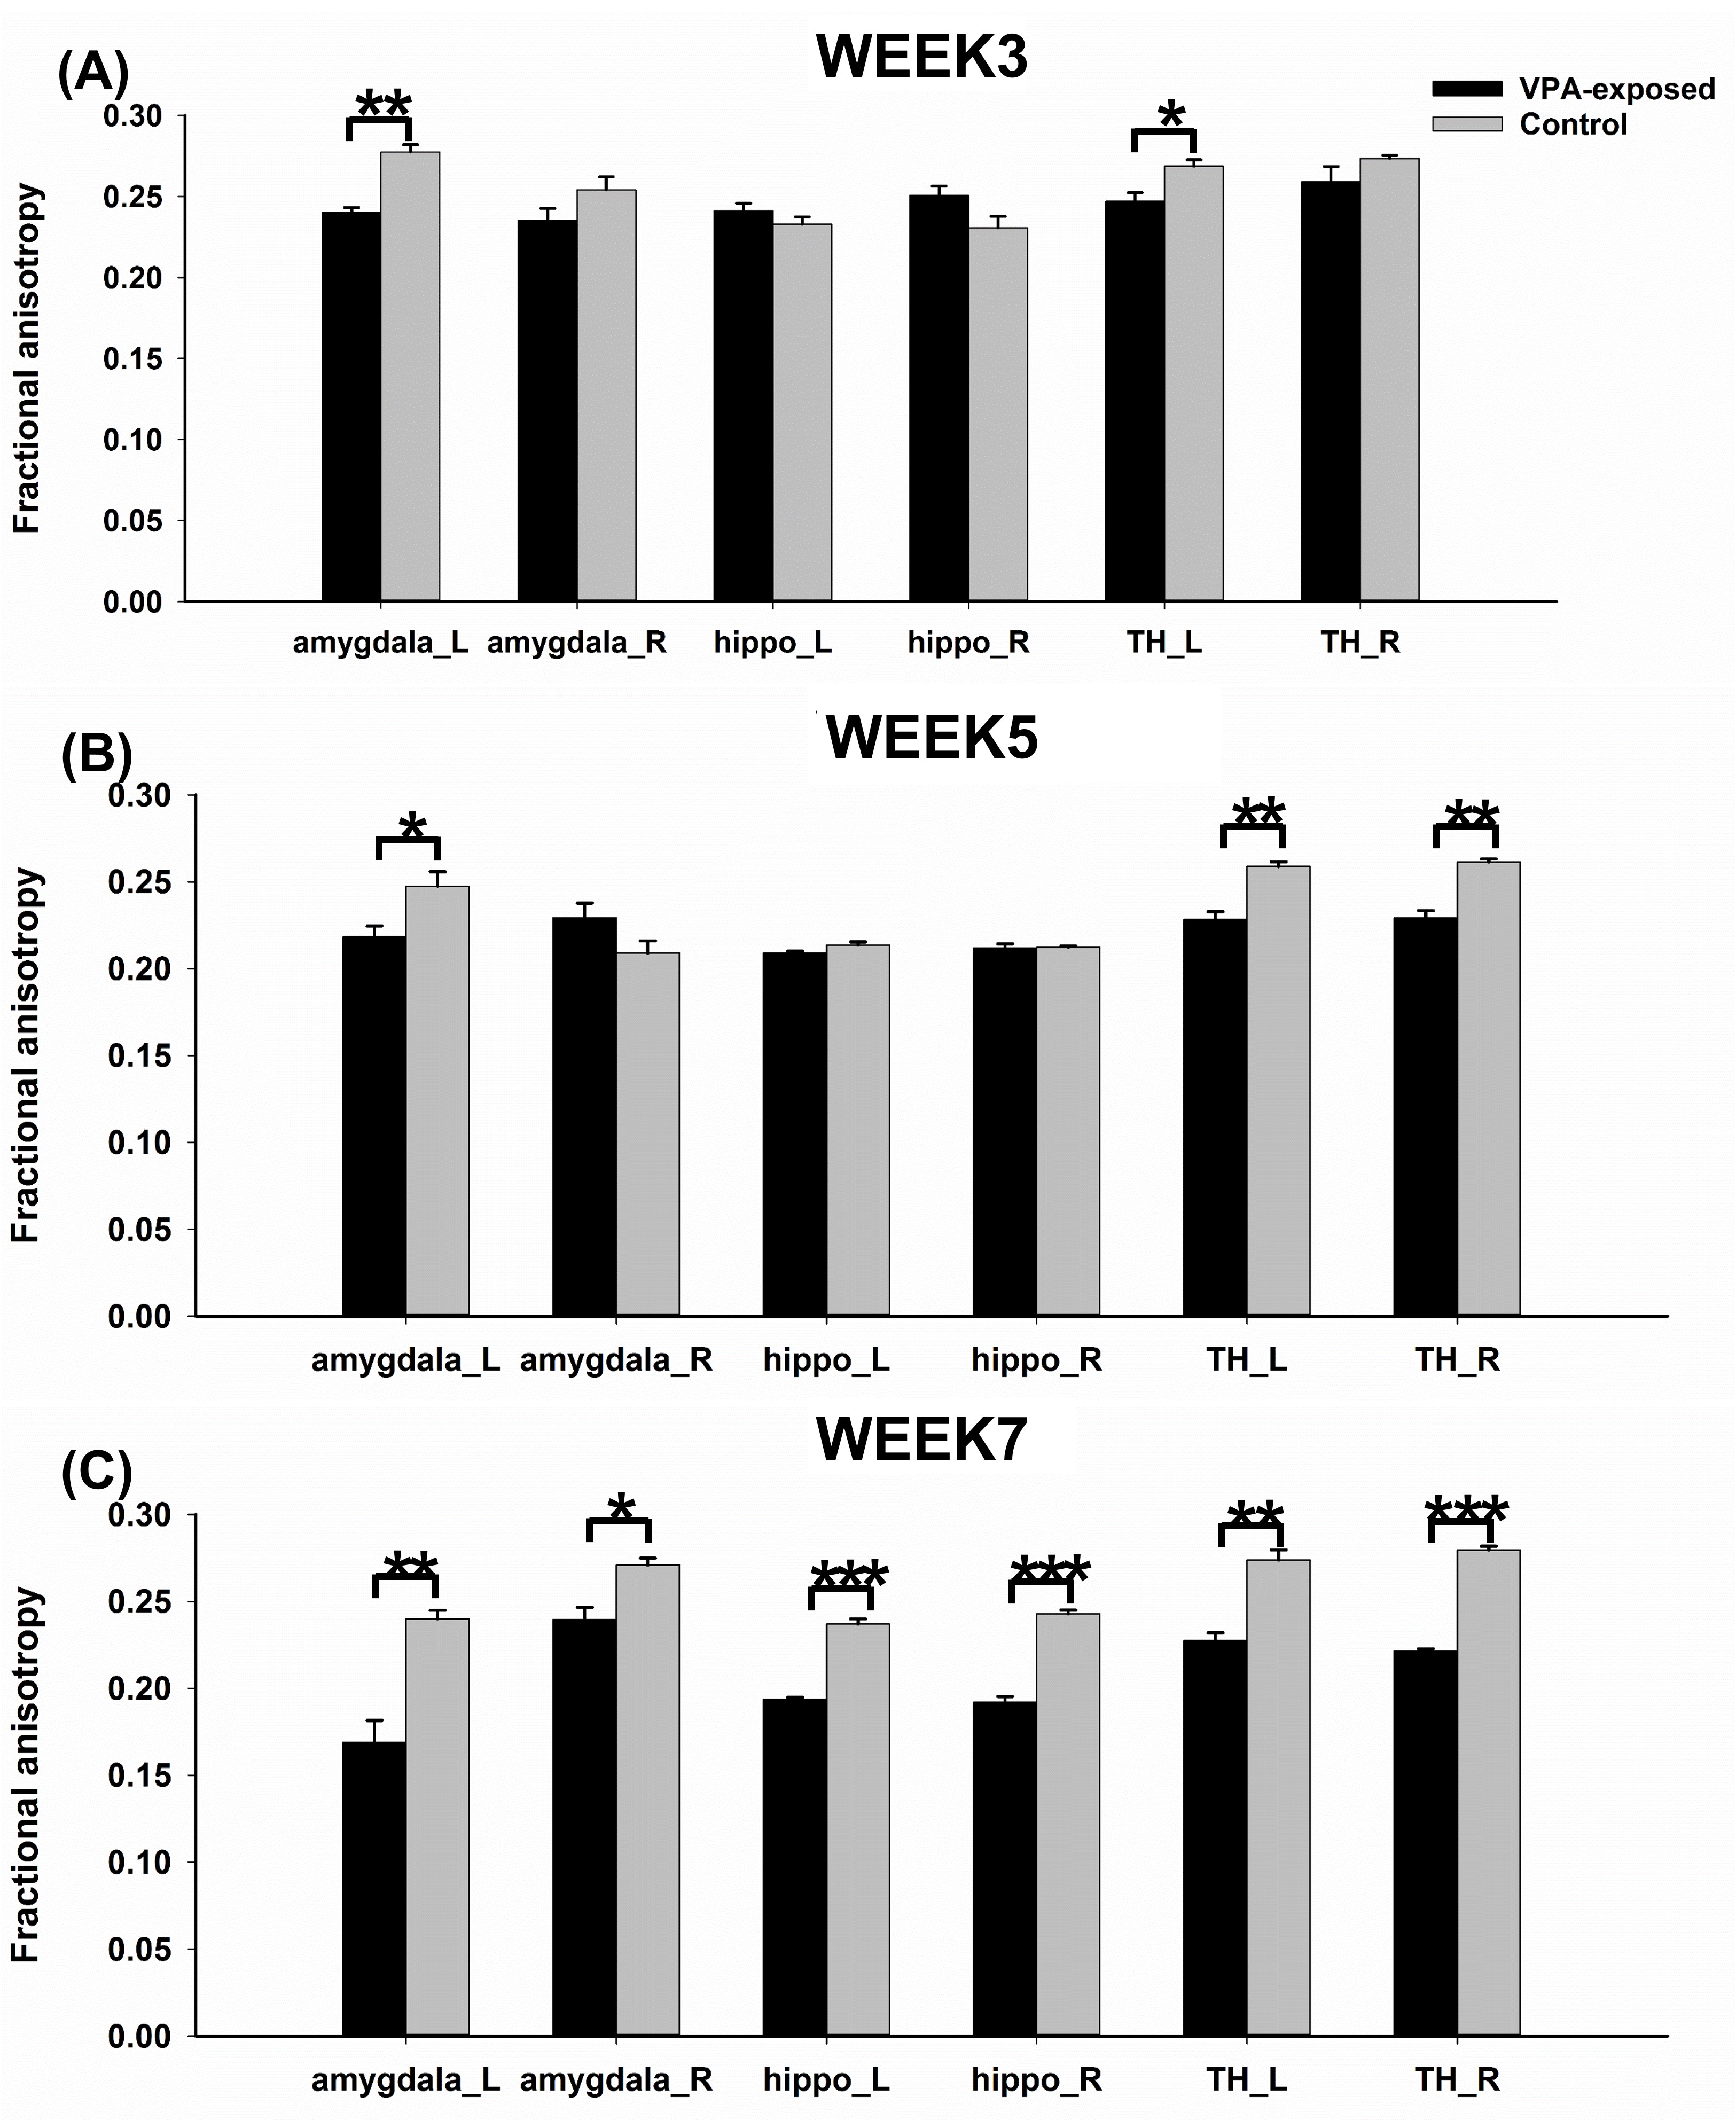
Figure 3.
Comparison of FA values of bilateral amygdala, hippocampus, and thalamus between VPA-exposed group and control group in (A) week 3, (B) week 5, and (C) week 7.
* : p < 0.05; ** : p < 0.01 ; *** : p <0.001
Abbreviation: FA, fractional anisotropy; VPA, valproic acid; amygdala_L, left amygdala; amygdala_r, right amygdala, hippo_L, left hippocampus; hippo_R, right hippocampus, TH_L, left thalamus; TH_R, right thalamus
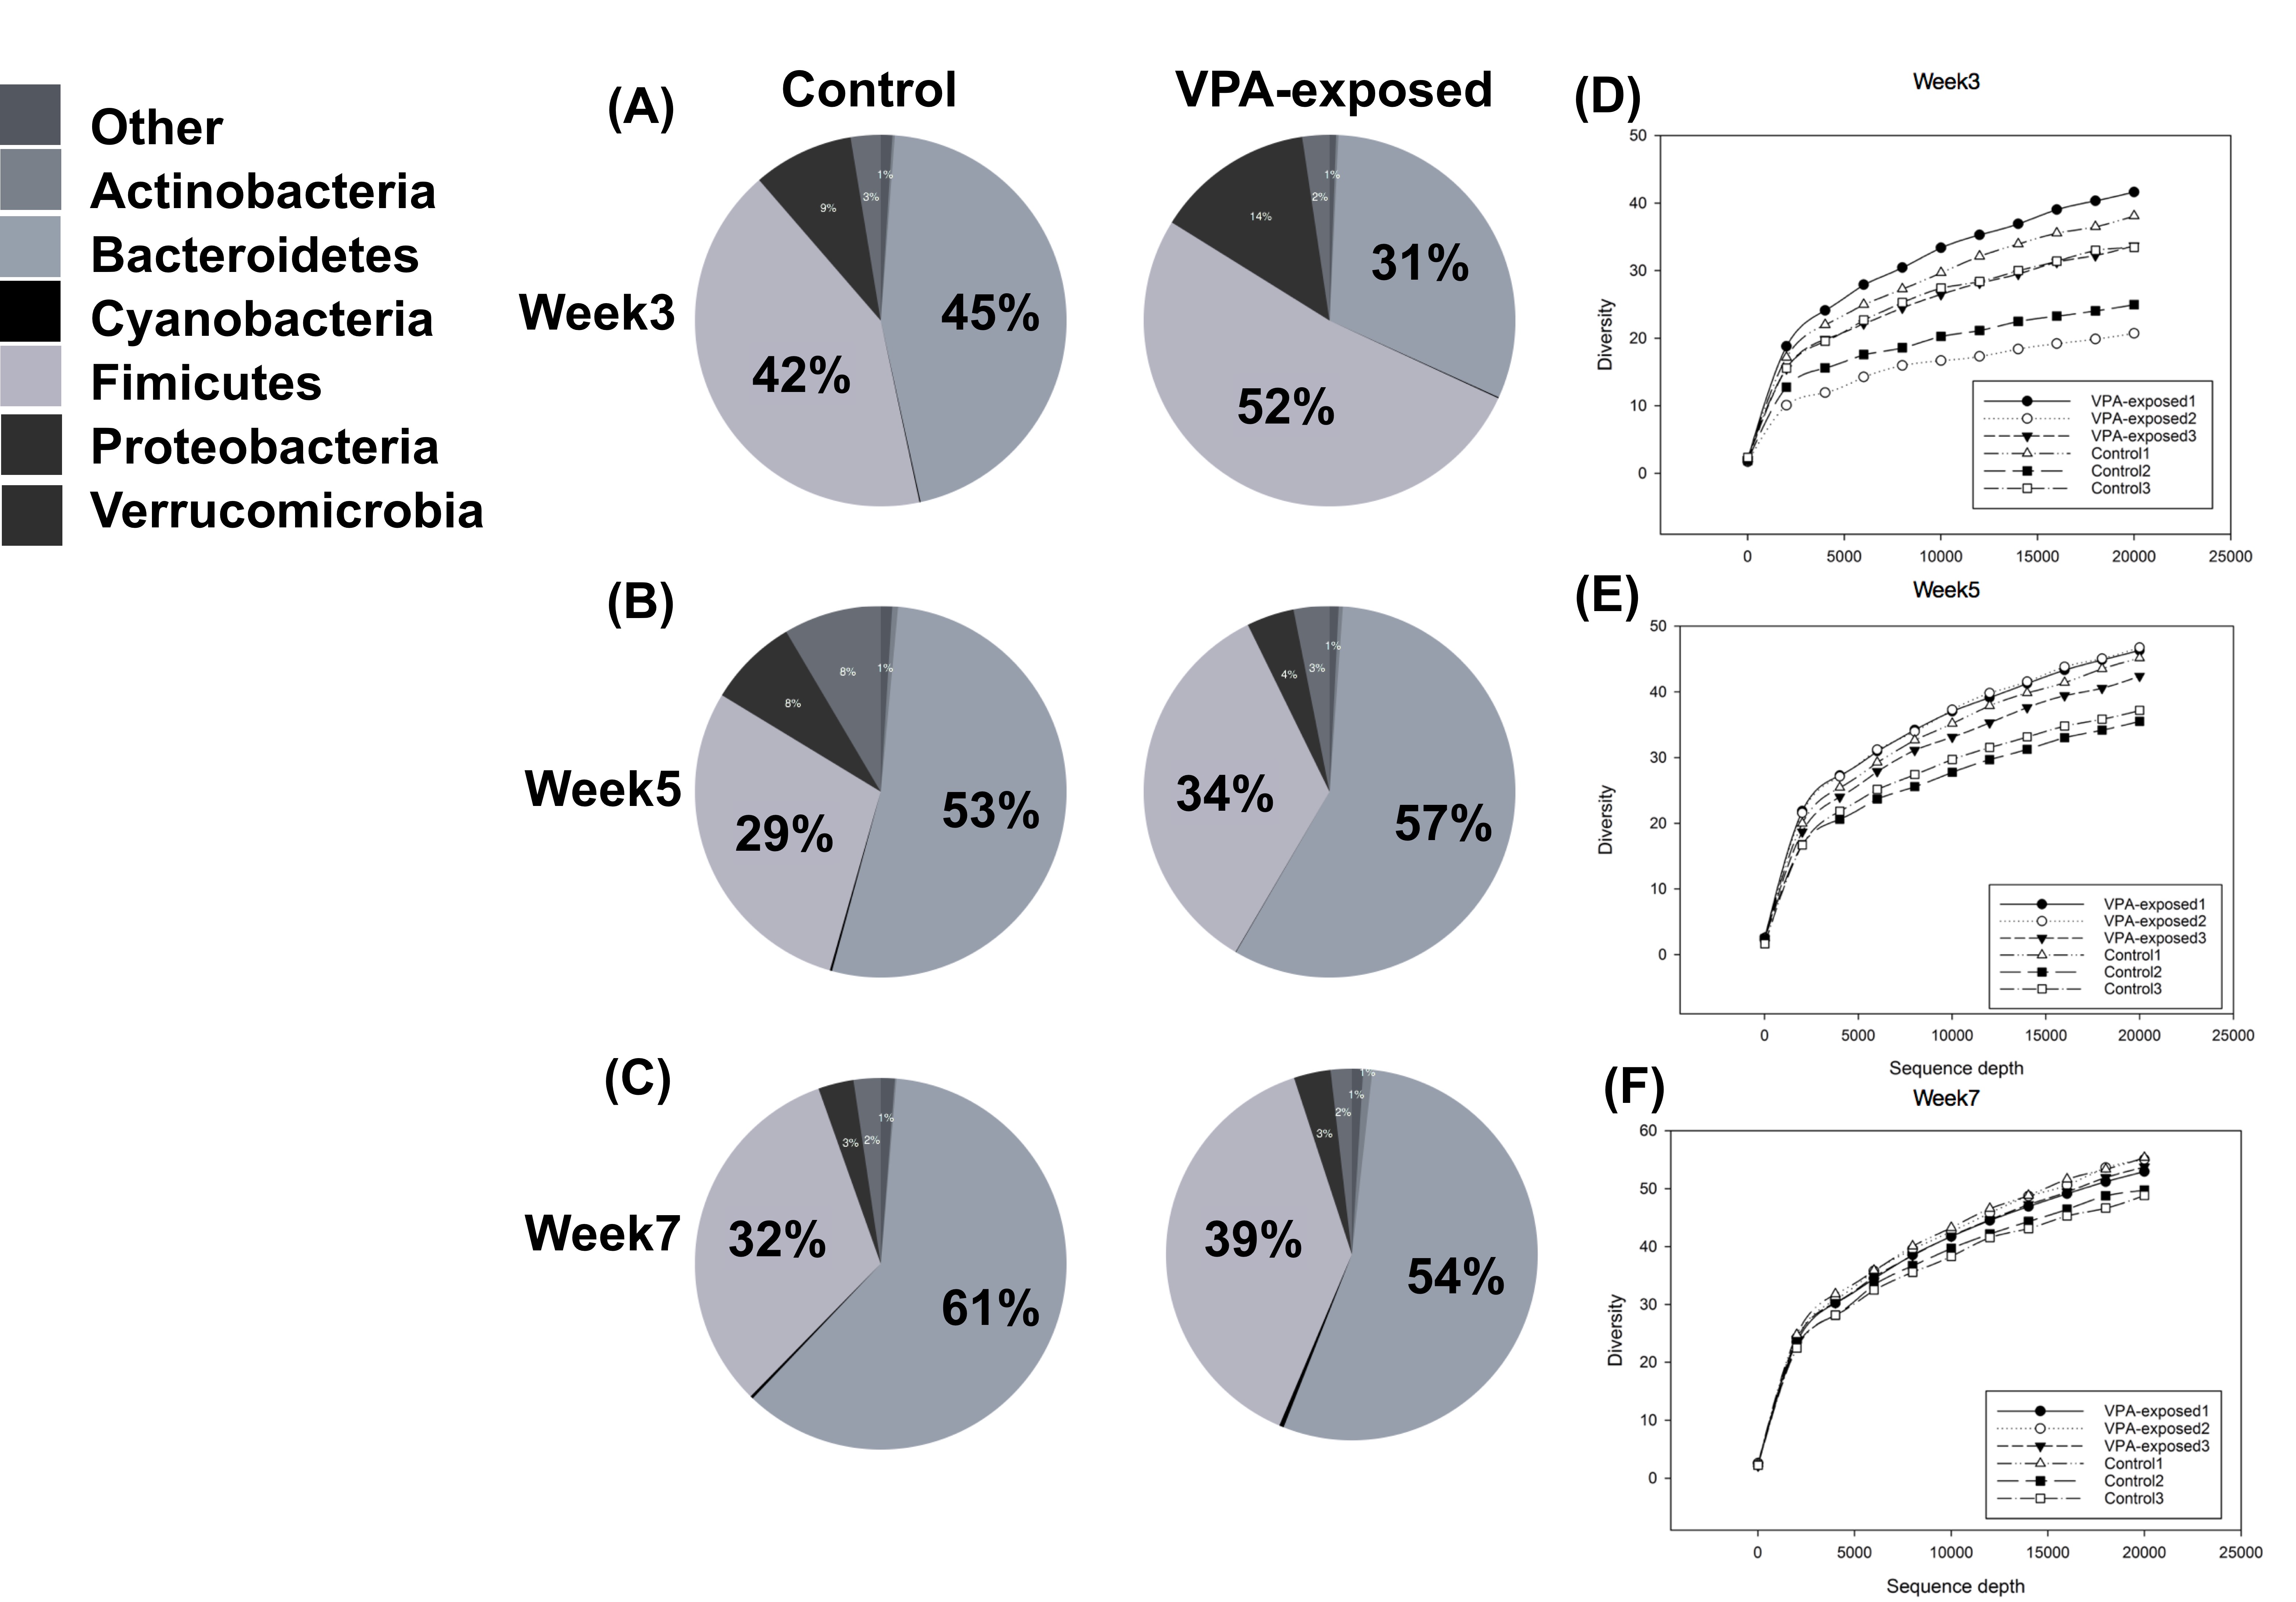
Figure 4.
The proportion of microbiome in the seven phylum was shown. Two major phylum of microbiome, Firmicutes and Bacteroidetes, were identified on (A) week 3, (B) week 5 and (C) week 7. Cyanobacteria showed massive change from week 3 to week 7 in the VPA-exposed group. The diversity level was higher in the VPA-exposed group than control group in (D) week 3, (E) week 5 and (F) week 7.
Abbreviation: VPA, valporic acid