3649
Genome-wide association studies of brain structure and function from UK Biobank data1FMRIB Centre, WIN, University of Oxford, Oxford, United Kingdom, 2Department of Statistics, University of Oxford, Oxford, United Kingdom, 3The Wellcome Centre for Human Genetics, University of Oxford, Oxford, United Kingdom
Synopsis
The genetic basis of brain structure and function is largely unknown. We carried out genome-wide association studies of 3,144 distinct brain imaging derived phenotypes in UK Biobank. Notable significant associations include: iron-related genes linked to T2* in subcortical regions; extracellular matrix associated with white matter microstructure and lesion volume; genes regulating midline axon guidance related to pontine crossing tract organisation. More broadly, effects were mainly seen in imaging measures associated with genes involved in brain development and transport of nutrients. Genes implicated in neurodegenerative disorders were largely related to iron and cardiovascular traits, and to brain development for psychiatric disorders.
Introduction
Variations in brain structure and function measured using MRI have been identified in many normal and abnormal brain processes, and provide intermediate or endophenotypes that can be used to assess the genetic architecture of neurodegenerative or psychiatric disorders. Joint analysis of both genetic and brain imaging UK Biobank datasets presents a unique opportunity for uncovering the genetic bases of brain structure and function, including genetic factors relating to brain development, ageing and disease.Methods
* A fully automated image processing pipelinewas developed that removes artefacts, renders images comparable across modalities and participants, and generates thousands of image-derived phenotypes (IDPs)1,2. These IDPs are distinct individual measures of brain structure and function extracted using ROIs, including three structural modalities (T1, T2 FLAIR and SWI), resting and task fMRI, and diffusion MRI (DTI and NODDI indices, captured using both TBSS and tractography).
* 8,428 nominally unrelated subjects3 were identified.
* We used the imputed dataset made available by UK Biobank in its July 2017 release3, filtering SNPs for minimum minor-allele-frequency and other quality/robustness metrics. This resulted in a dataset with 11,734,353 SNPs. We then used BGENIE v1.2 to carry out GWAS for each IDP.
Results and Discussion
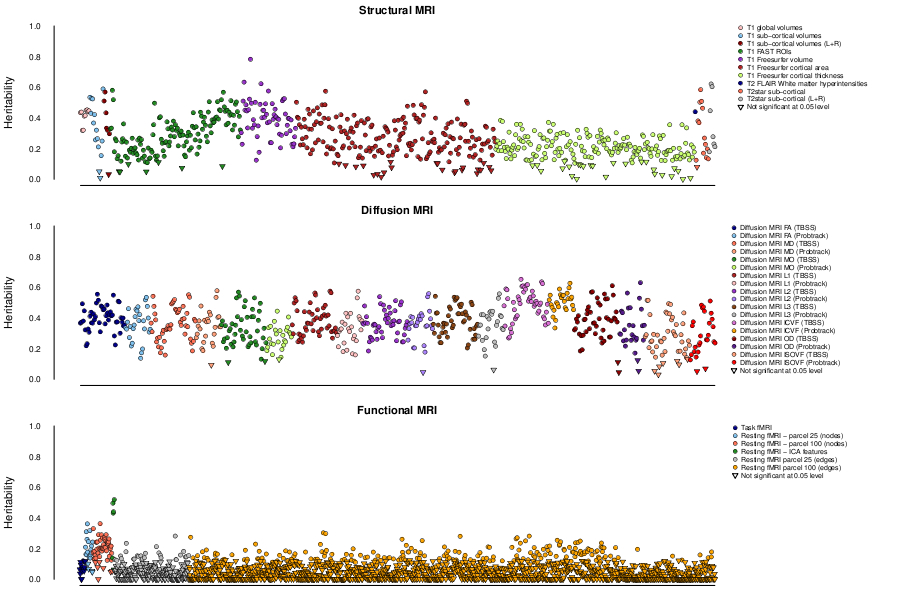
At a conservative threshold of p<10-11, we find 368 significant associations between genetic regions and IDPs. These associations with 78 SNPs can be grouped together into 38 distinct clusters. Some of the 38 clusters of associations relate to known brain-related genes or previous GWAS of white matter lesions or subcortical volumes4,5,6. Half of the IDPs show significant heritability (Figure 1).
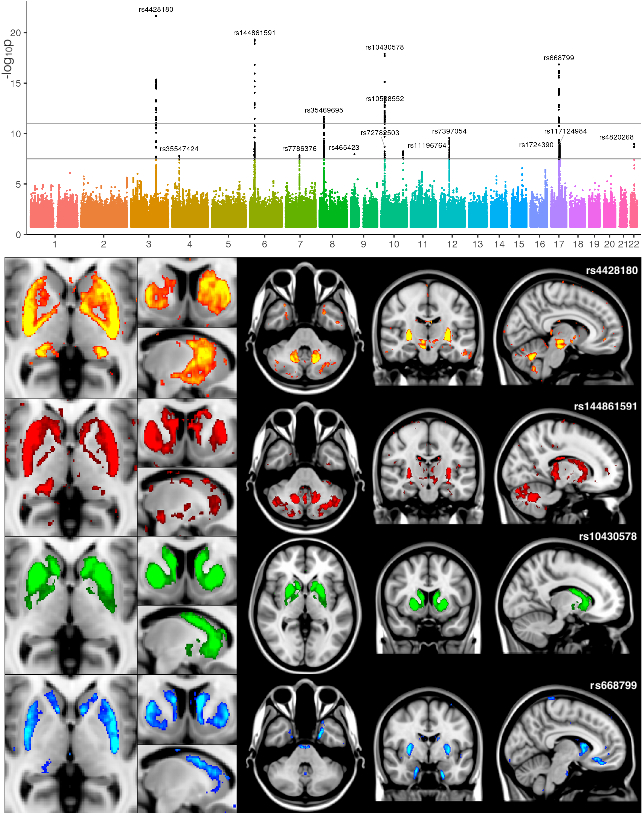
We identified many associations between T2* measurements in the basal ganglia with genes known to affect iron transport and storage. While all IDPs are ROI-based, further insight about spatial localisation of SNP associations can be obtained by interrogating the raw brain images voxelwise. This helps identify additional areas not already well captured by the IDPs (Figure 2).
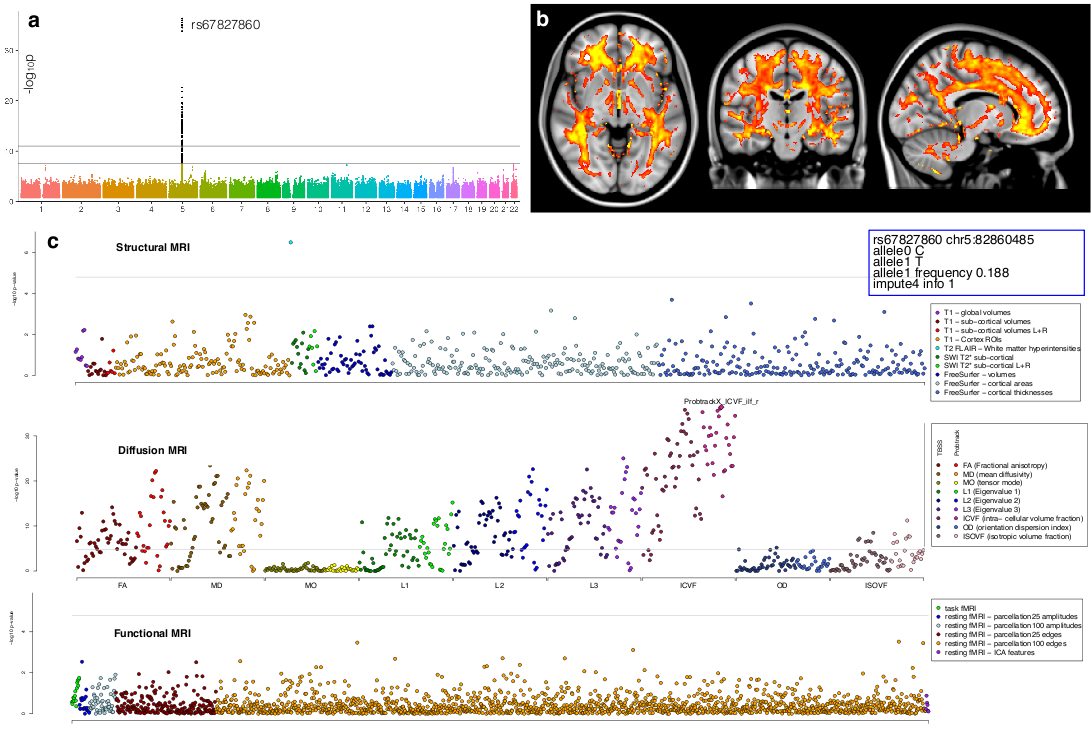
Interestingly, three clusters relating to white matter (including one measuring white matter lesions volume and one encompassing multiple DTI and NODDI measures of most of the WM tracts) were strongly associated with three different genes coding for proteins of the extracellular matrix (ECM) (Figure 3).
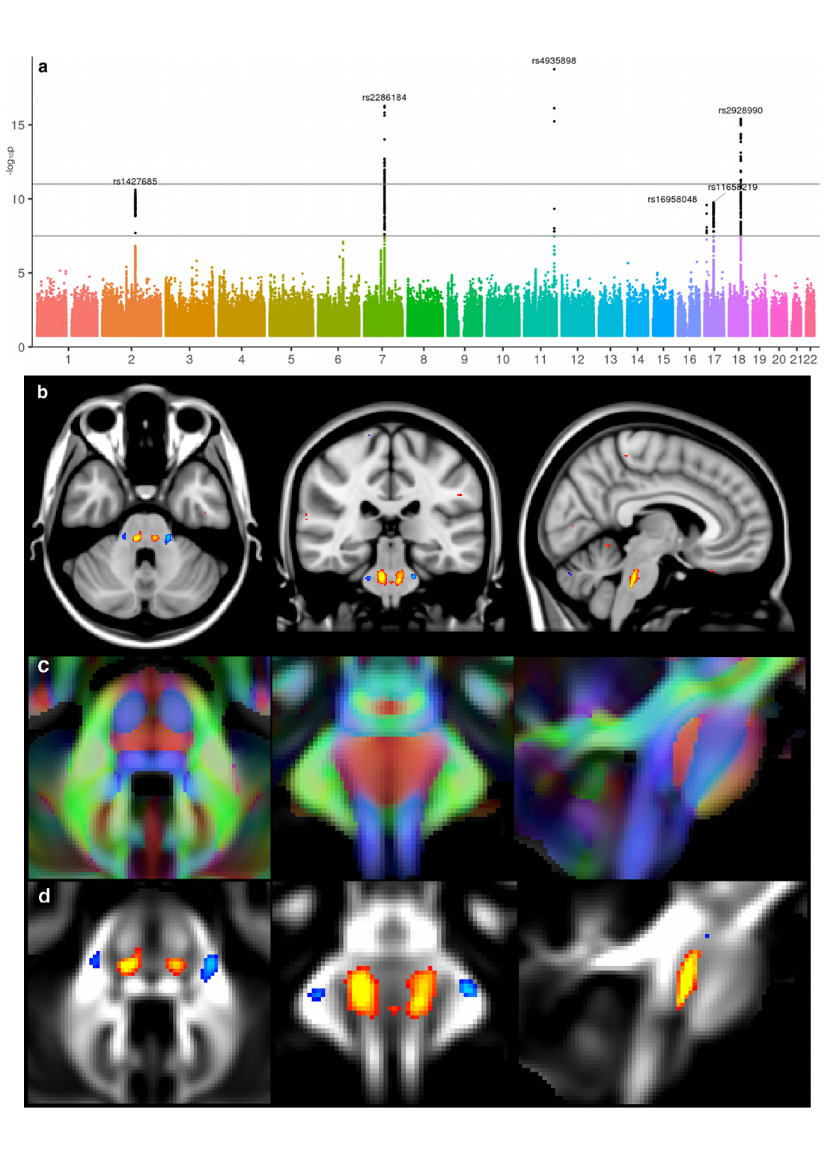
Amongst the three associations we identified for the crossing pontine tract, two were with genes that regulate axon guidance during development. The exact location of our IDP in the crossing fibres of the pons remarkably coincides with the function of ROBO3, mutations of which result in horizontal gaze palsy, a disorder in which axons fail to cross the midline (Figure 4).
Finally, SNPs found significant in this association study and that known to be involved in neurodegenerative disorders seem to be mainly related to iron and cardiovascular traits. TF and HFE might play a relevant role for iron mobilisation and regulation in neurodegenerative disorders such as Parkinson’s and Alzheimer’s; SLC25A37 shows increased expression in Alzheimer’s or Friedreich's ataxia; and mutations in COASY are associated with neurodegeneration with brain iron accumulation. PGC-1α is involved in obesity, cholesterol and blood pressure regulation, but seems to also show different expression in two Huntington’s and Alzheimer’s models; an LD region encompassing MRC1 and ZIP12 is implicated not only with neurodegenerative, but also neuropsychiatric disorders, and has been associated genome-wide with risk of cardiovascular disease7. Similarly to ZIP12, most of the genes linked to mental health disorders found in this association study are strongly involved in brain development, e.g., ZIP8 that has been found in a GWAS of schizophrenia8 or VCAN in a GWAS of major depressive disorder9.
Conclusions
We have here uncovered a very large number of significant and replicated associations at a stringent threshold of p<10-11 with all the main IDP groups, except the task fMRI measures. We mainly found associations between IDPs and genes involved in brain development and plasticity, as well as with genes contributing to transport of nutrients and minerals. Most of these genes have also been demonstrated to contribute to a vast array of disorders including major depression disorder, cardiovascular disease, schizophrenia and Alzheimer’s. The combination of very large subject numbers with imaging data collected on a maximally homogeneous imaging platform and protocol is a unique feature of UK Biobank. Over the next few years, the number of participants with imaging data will gradually increase to 100,000, which will allow a much more complete discovery of the genetic basis of human brain structure, function and connectivity.
The full set of results are available on the interactive Oxford Brain Imaging Genetics (BIG) web browser.
Acknowledgements
The data used in this work was obtained from UK Biobank under Data Access Application 8107. We are grateful to UK Biobank for making the resource data available, and are extremely grateful to all UK Biobank study participants, who generously donated their time to make this resource possible. F.A-A acknowledges funding from the UK Medical Research Council and the Wellcome Trust via UK Biobank. K.L.M. and S.M.S. receive further support from the Wellcome Trust. JM acknowledges funding for this work from the European Research Council (ERC; grant 617306). GD acknowledges funding for this work from the Medical Research Council UK (MR/K006673/1).
We are grateful to: Bruce Fischl, Doug Greve and Matt Glasser for advice on FreeSurfer processing; Jon Diprose and Robert Esnouf for their advice and support with high performance computing; Stuart McRobert for help setting up and configuring the Oxford Brain Imaging Genetics browser; Tom Nichols and Anderson Winkler for discussions about the imaging confounds.
References
1. Miller, K. L. et al. Multimodal population brain imaging in the UK Biobank prospective epidemiological study. Nat. Neurosci. 19, 1523–1536 (2016).
2. Alfaro-Almagro, F. et al. Image Processing and Quality Control for the first15 10,000 Brain Imaging Datasets from UK Biobank. bioRxiv (2017). doi:10.1101/130385
3. Bycroft, C. et al. Genome-wide genetic data on ~500,000 UK Biobank22 participants. bioRxiv (2017). doi:10.1101/166298
4. Hibar, D. P. et al. Common genetic variants influence human subcortical brain structures. Nature 520, 224–229 (2015).
5. Hibar, D. P. et al. Novel genetic loci associated with hippocampal volume. Nature Communications 8, 13624 (2017).
6. Fornage, M. et al. Genome-wide association studies of cerebral white matter lesion burden. Annals of Neurology 69, 928-939 (2011).
7. Middelberg, R. P. S. et al. Genetic variants in LPL, OASL and TOMM40/APOE-C1-C2-C4 genes are associated with multiple cardiovascular-related traits. BMC Med. Genet. 12, 123 (2011).
8. Haijma, S. V. et al. Brain volumes in schizophrenia: a meta-analysis in over 18 000 subjects. Schizophr Bull 39, 1129–1138 (2013).
9. Lewis, C. M. et al. Genome-Wide Association Study of Major Recurrent Depression in the U.K. Population. American Journal of Psychiatry 167, 949–957 (2010).
Figures