3648
Intracortical T1-weighted/T2-weighted ratio signal changes in Huntington’s Disease1Neuroscience, McMaster University, Hamilton, ON, Canada, 2University College London, London, United Kingdom, 3University of British Columbia, Vancouver, BC, Canada, 4Leiden University Medical Centre, Leiden, Netherlands, 5Institut du Cerveau et de la Moelle Epinière, Paris, France
Synopsis
Huntington’s disease (HD) is a genetic neurodegenerative disorder that is characterized by motor and cognitive dysfunction. Previous imaging studies have shown cortical thickness is reduced in HD, and here we investigated potential changes in cortical tissue composition in Huntington’s based on previously acquired T1-weighted (T1W) and T2-weighted (T2W) images. We analyzed T1W/T2W ratios formed using images collected in 321 subjects from the TRACK-HD dataset representing various stages of HD and healthy controls. Intracortical T1W/T2W signal analysis revealed significant changes in the most advanced HD group. This may reflect HD related increases in myelin and/or iron in the cortex or a change in cytoarchitecture.
INTRODUCTION
Huntington’s disease (HD) is an neurodegenerative disorder that is caused by a CAG repeat expansion in the huntingtin (HTT) gene [1]. This mutation leads to disrupted signaling in cortico-striatal circuits, followed by a loss of projection neurons in the striatum [2]. Symptomology of HD extends beyond motor dysfunction into mood and cognition; thus it is intriguing to investigate the cortex in HD. Previous postmortem studies have suggested that neuronal losses are prevalent in HD [3-6]. The focus in this study was to use previously collected T1W and T2W images to investigate changes in cortical composition with disease progression. The ratio of T1W and T2W images was a previously proposed method for investigating cortical tissue with reduced influence from bias fields [7]. The ratio maps were originally suggested to map myelin across the cortex [7], but recent evidence has suggested that they might not be entirely specific to myelin [8]. This needs to be considered in HD as there are changes in iron content [9] and changes to cellular distributions [6]. In this study, we are thus investigating the T1W/T2W ratio image as a general marker of cortical composition changes in HD.
Huntington’s disease (HD) is an neurodegenerative disorder that is caused by a CAG repeat expansion in the huntingtin (HTT) gene [1]. This mutation leads to disrupted signaling in cortico-striatal circuits, followed by a loss of projection neurons in the striatum [2]. Symptomology of HD extends beyond motor dysfunction into mood and cognition; thus it is intriguing to investigate the cortex in HD. Previous postmortem studies have suggested that neuronal losses are prevalent in HD [3-6]. The focus in this study was to use previously collected T1W and T2W images to investigate changes in cortical composition with disease progression. The ratio of T1W and T2W images was a previously proposed method for investigating cortical tissue with reduced influence from bias fields [7]. The ratio maps were originally suggested to map myelin across the cortex [7], but recent evidence has suggested that they might not be entirely specific to myelin [8]. This needs to be considered in HD as there are changes in iron content [9] and changes to cellular distributions [6]. In this study, we are thus investigating the T1W/T2W ratio image as a general marker of cortical composition changes in HD.METHODS
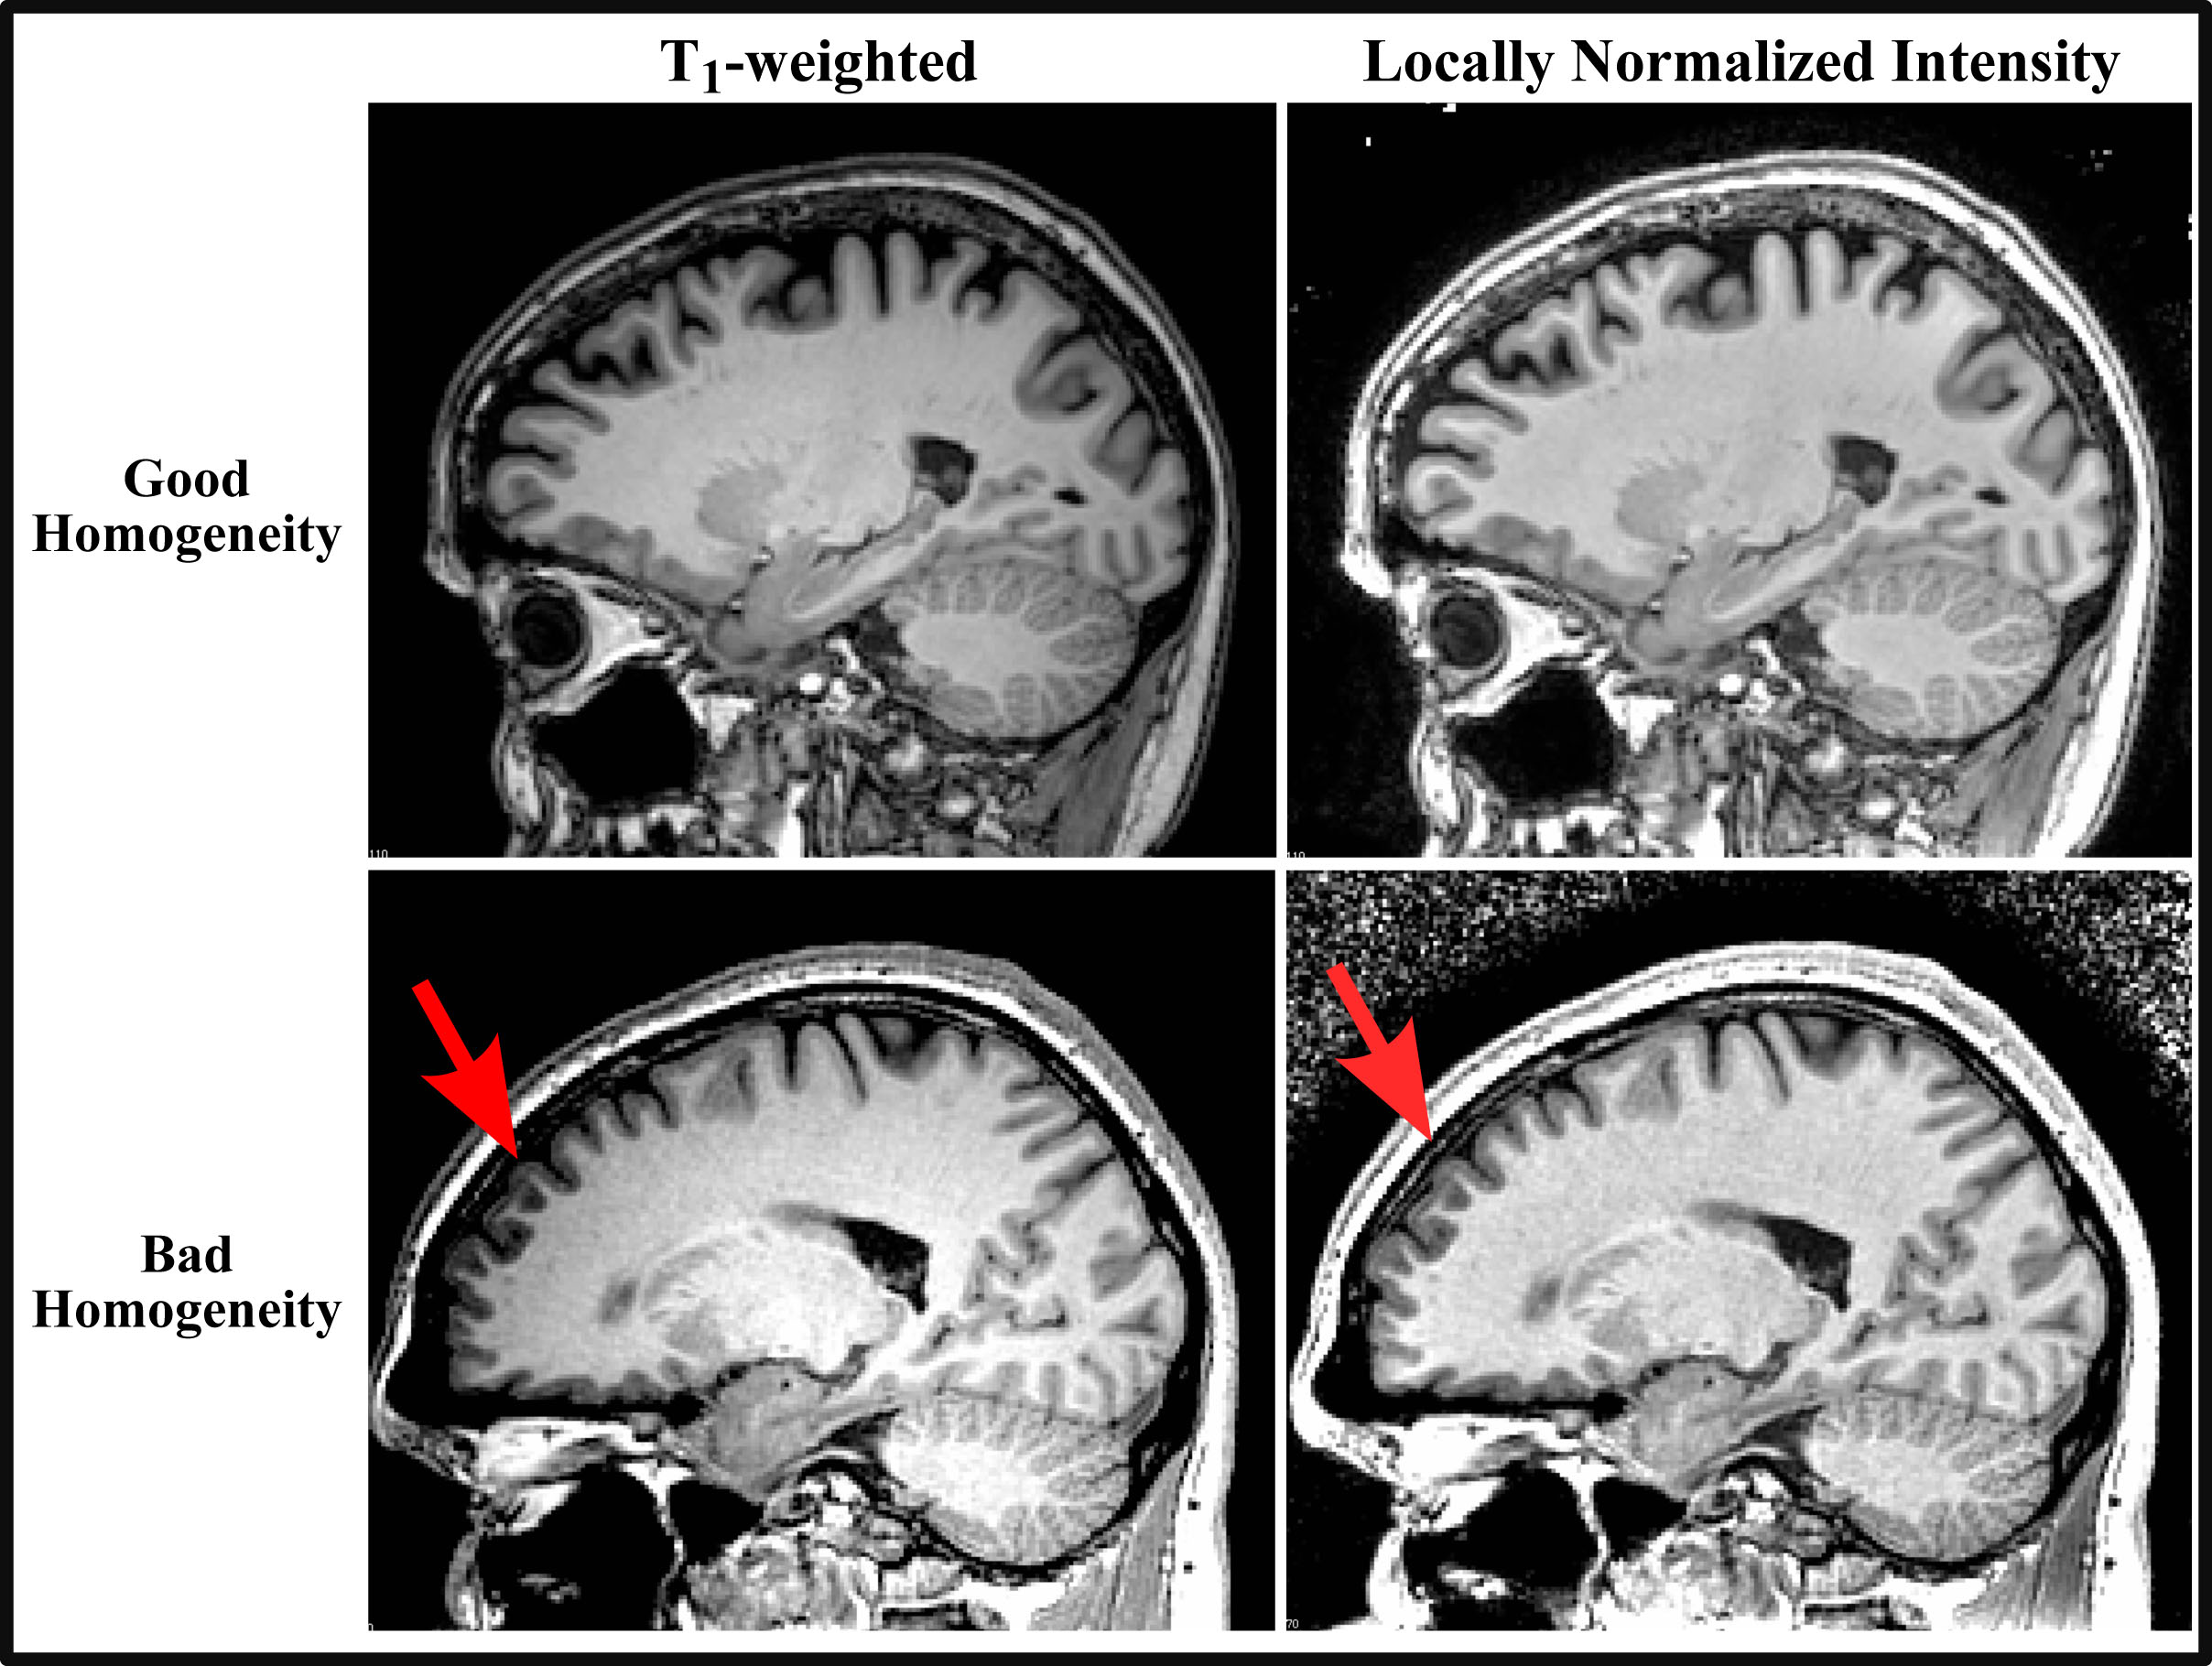
T1W and T2W images from 321 subjects in the TRACK-HD study [10] were used. This study included 109 healthy controls, 104 subjects with premanifest HD, and 108 subjects with HD. We used a new processing pipeline to account for bias fields at different imaging sites by applying a novel local intensity normalization algorithm (Figure 1) to aid in acquiring accurate cortical segmentations that are necessary for intracortical analysis. Segmentations were generated in Matlab using a custom thresholding technique, and were subsequently manually corrected to remove remaining dura mater and cerebellum. The analyst was blinded to subject’s demographics. Each subject’s surface was registered to the middle depth of the MNI-152 atlas using a multi-modal surface registration approach [11]. The MarsAtlas [12] was used to parcellate the cortex into 82 regions for analysis. The T1W/T2W, T1W, and T2W signals were sampled onto the surface and analyzed in each ROI using weighted linear regression, with age, disease group, and study site included as regressors.RESULTS
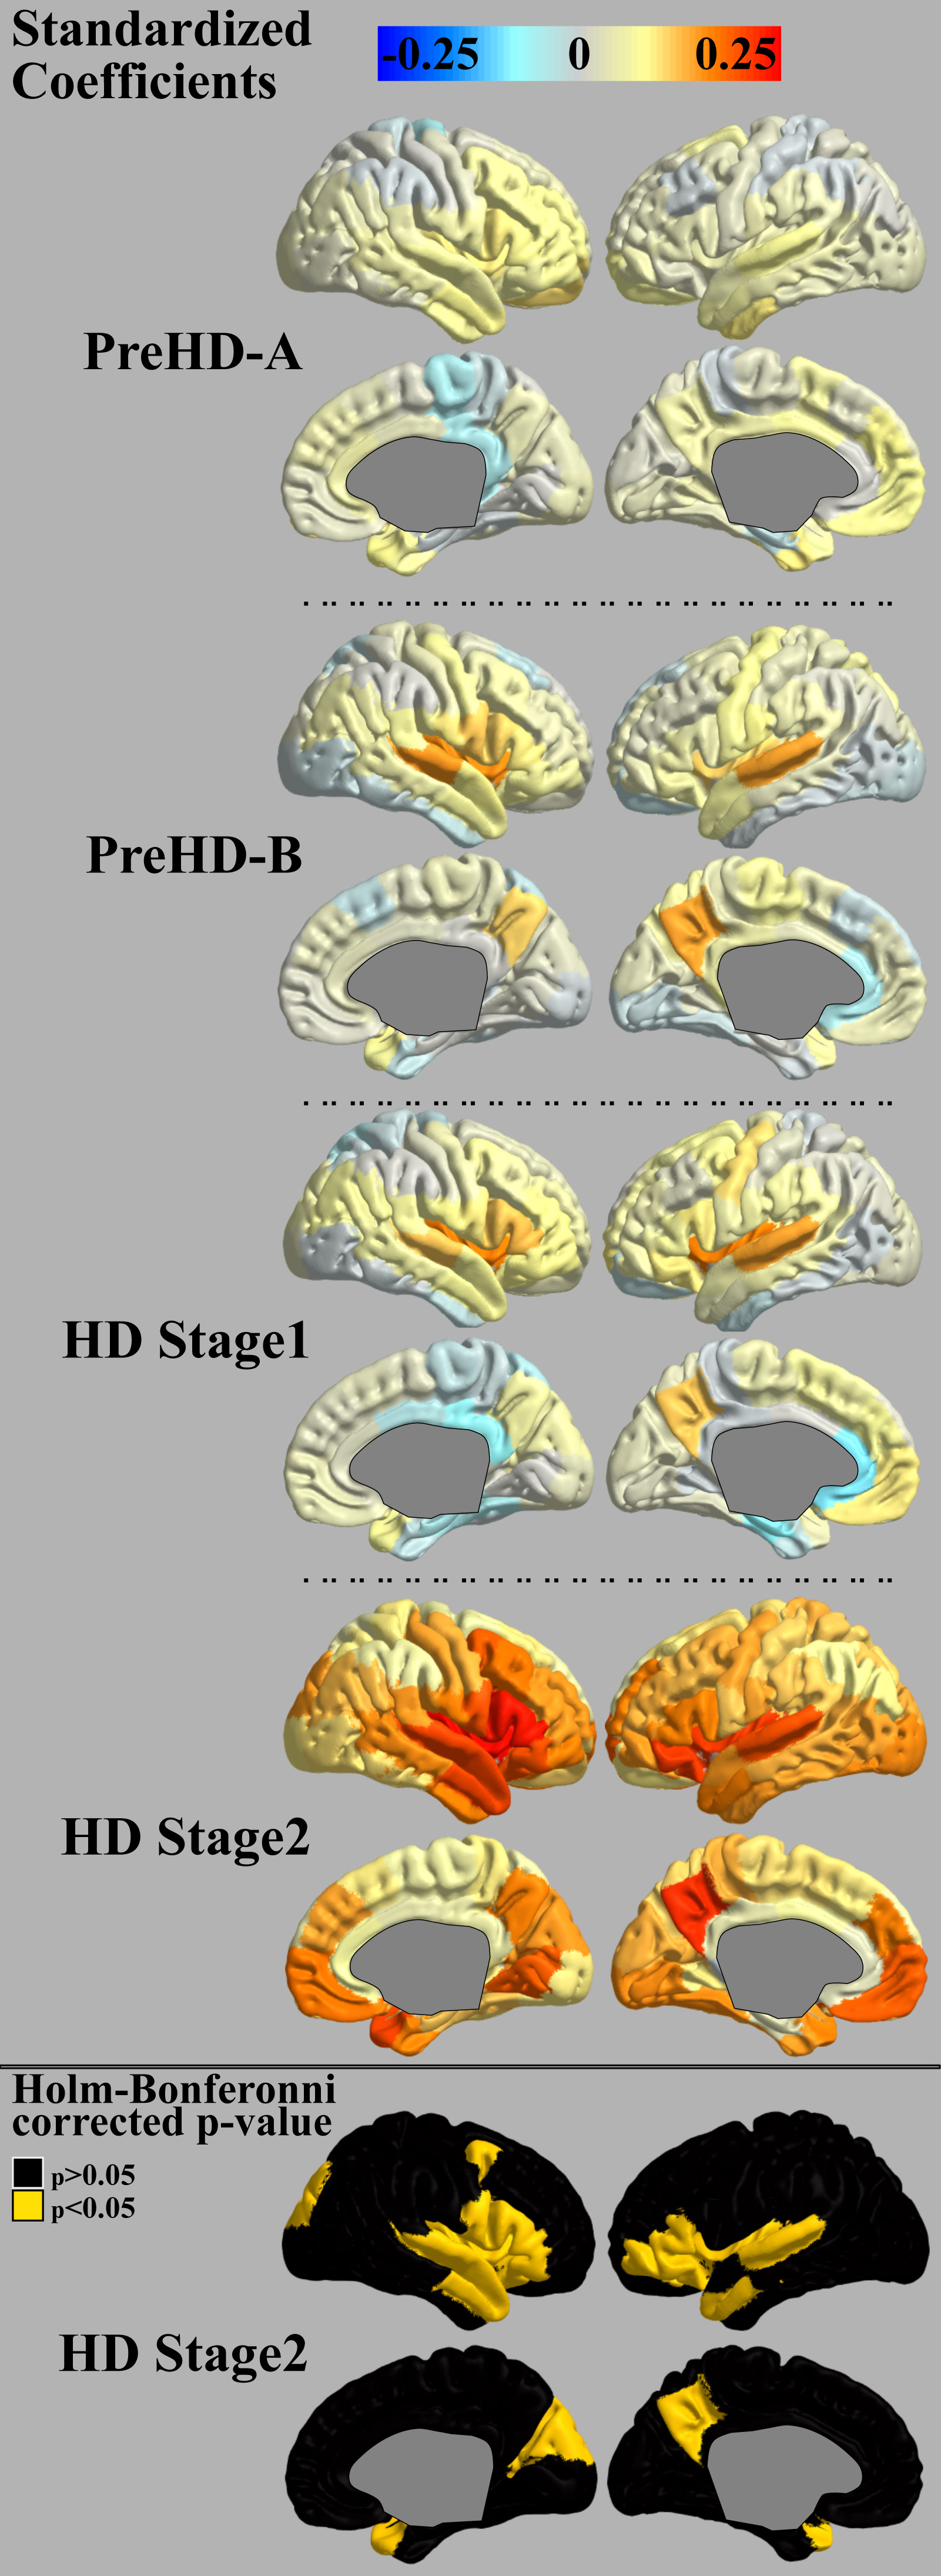
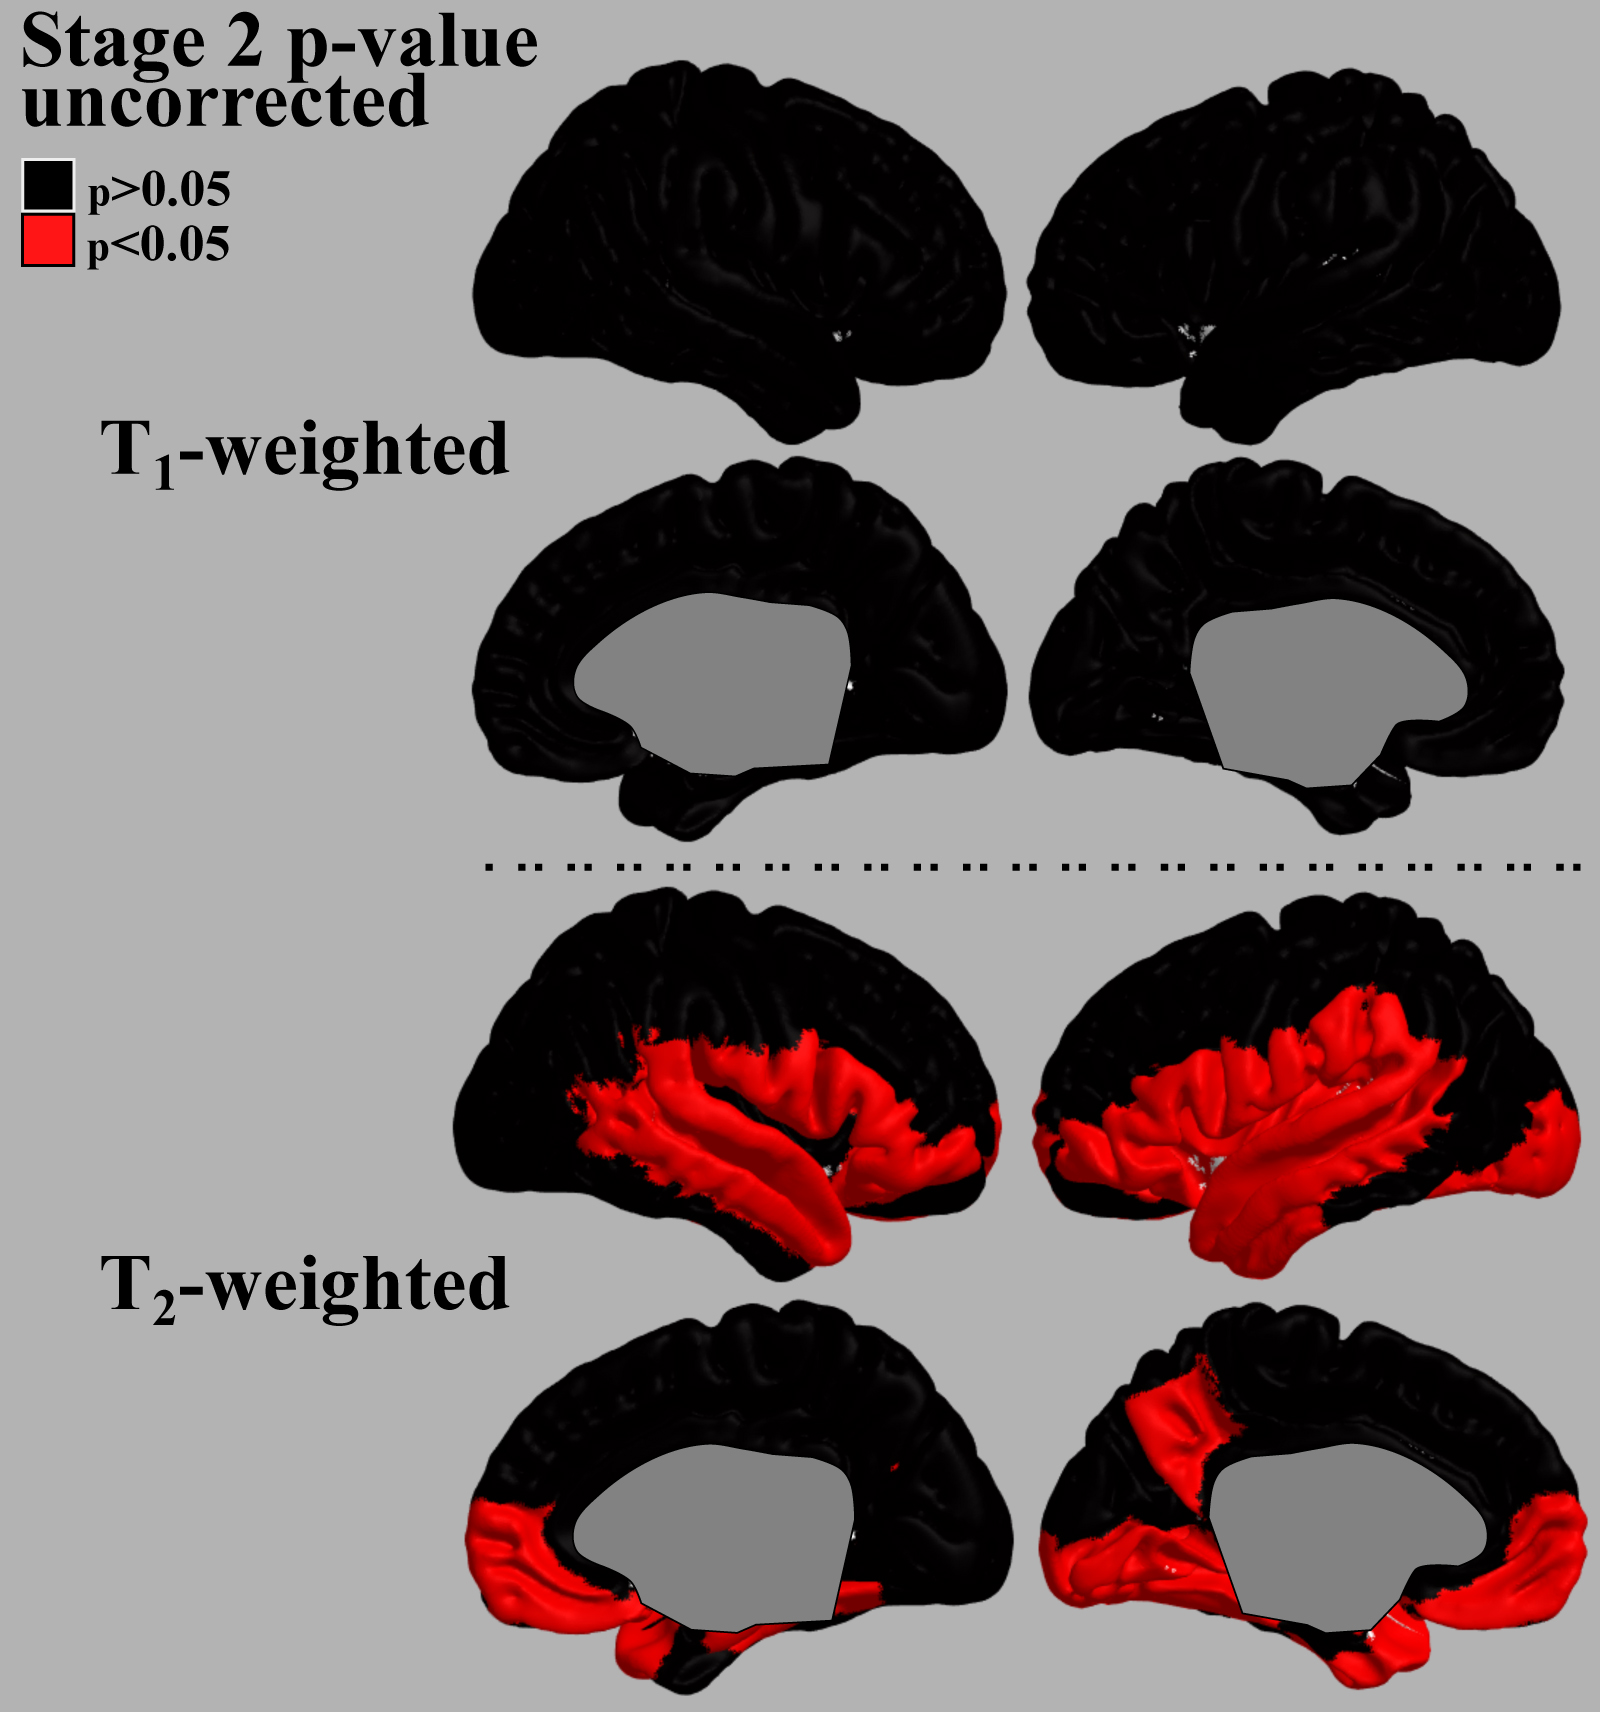
Group differences based on the T1W/T2W ratio image intensity are presented in Figure 2. Significant regions were found only in the HD Stage 2 group relative to controls. The ratio signal in this group increased in a similar pattern bilaterally within the following significant regions: pars opercularis, pars triangularis, superior temporal gyrus, medial temporal gyral pole, and cuneus. To investigate which signal contrast contributes most to the changes seen in HD Stage 2 in this study, we performed the same regression analysis on both T1W and T2W as for the ratio images. The uncorrected p-values for this analysis are mapped to the cortical surface in Figure 3. Regions were found to be significant (p<0.05 uncorrected) only in the T2W images in similar locations where the ratio image had shown significant changes in this group. A decrease in T2W intensity thus appears to be the driving factor for the increase in the T1W/T2W ratio signal.DISCUSSION
Our findings provide further evidence of cortical pathology in HD. The decrease in the T2W signal, and subsequent increase in the ratio signal could be due to increases in cortical myelin, increases in iron, or changes in the underlying cytoarchitecture resulting in decreased MR visible water. The ratio signal demonstrated better sensitivity to changes in HD versus each signal separately, and this is likely due to the bias correction built into the image division[7]. Bias correction aids in removing scanner induced variance in the analyzed data, thus improving the ability to observe group differences.CONCLUSION
The T1W/T2W ratio signal shows better sensitivity than either the T1W or T2W signal for detecting changes related to HD, likely in part due to the reduced impact of the bias fields to the image intensity. It would be worthwhile to revisit this study with targeted imaging for intracortical contrast, and with MRI protocols that account for intensity biases between imaging sites.Acknowledgements
We thank the TRACK-HD investigators, study participants and their families. TRACK-HD was supported by the CHDI Foundation, a not-for-profit organization dedicated to finding treatments for Huntington's disease.References
[1] M.E. MacDonald, C.M. Ambrose, M.P. Duyao, R.H. Myers, A novel gene containing a trinucleotide repeat that is expanded and unstable on Huntington's disease chromosomes, Cell. 72 (1993) 971–983. doi:10.1016/0092-8674(93)90585-E.
[2] C. Rangel-Barajas, G.V. Rebec, Dysregulation of Corticostriatal Connectivity in Huntington’s Disease: A Role for Dopamine Modulation, Jhd. 5 (2016) 303–331. doi:10.3233/JHD-160221.
[3] J.C. Hedreen, C.E. Peyser, S.E. Folstein, C.A. Ross, Neuronal loss in layers V and VI of cerebral cortex in Huntington's disease, Neuroscience Letters. 133 (1991) 257–261.
[4] E.H. Kim, D.C.V. Thu, L.J. Tippett, D.E. Oorschot, V.M. Hogg, R. Roxburgh, et al., Cortical interneuron loss and symptom heterogeneity in Huntington disease, Ann. Neurol. 75 (2014) 717–727. doi:10.1002/ana.24162.
[5] N.F. Mehrabi, H.J. Waldvogel, L.J. Tippett, V.M. Hogg, B.J. Synek, R.L.M. Faull, Symptom heterogeneity in Huntington's disease correlates with neuronal degeneration in the cerebral cortex, Neurobiol. Dis. 96 (2016) 67–74. doi:10.1016/j.nbd.2016.08.015.
[6] L.D. Selemon, G. Rajkowska, P.S. Goldman-Rakic, Evidence for progression in frontal cortical pathology in late-stage Huntington's disease, J. Comp. Neurol. 468 (2003) 190–204. doi:10.1002/cne.10938.
[7] M.F. Glasser, D.C. Van Essen, Mapping Human Cortical Areas In Vivo Based on Myelin Content as Revealed by T1- and T2-Weighted MRI, Journal of Neuroscience. 31 (2011) 11597–11616. doi:10.1523/JNEUROSCI.2180-11.2011.
[8] M. Arshad, J.A. Stanley, N. Raz, Test-retest reliability and concurrent validity of in vivo myelin content indices: Myelin water fraction and calibrated T1 w/T2 w image ratio, Hum. Brain Mapp. 38 (2017) 1780–1790. doi:10.1002/hbm.23481.
[9] H.D. Rosas, Y.I. Chen, G. Doros, D.H. Salat, N.-K. Chen, K.K. Kwong, et al., Alterations in brain transition metals in Huntington disease: an evolving and intricate story, Arch. Neurol. 69 (2012) 887–893. doi:10.1001/archneurol.2011.2945.
[10] S.J. Tabrizi, D.R. Langbehn, B.R. Leavitt, R. Roos, Biological and clinical manifestations of Huntington's disease in the longitudinal TRACK-HD study: cross-sectional analysis of baseline data, The Lancet. (2009). doi:10.1016/S1474-4422(09)70170-X.
[11] C.L. Tardif, A. Schäfer, M. Waehnert, J. Dinse, R. Turner, P.-L. Bazin, Multi-contrast multi-scale surface registration for improved alignment of cortical areas, NeuroImage. 111 (2015) 107–122. doi:10.1016/j.neuroimage.2015.02.005.
[12] G. Auzias, O. Coulon, A. Brovelli, MarsAtlas: A cortical parcellation atlas for functional mapping, Hum. Brain Mapp. 37 (2016) 1573–1592. doi:10.1002/hbm.23121.
Figures