3647
Phase Sensitive Inversion Recovery (PSIR) spinal cord imaging as a potential biomarker for Motor Neuron Disease1Neurology, UCSF, San Francisco, CA, United States, 2Neurology, UCSF ALS center, UCSF, San Francisco, CA, United States
Synopsis
With this study we investigated whether spinal cord gray and white matter atrophy could be detected in vivo in patients with a diagnosis within the motor neuron disease spectrum using PSIR imaging. Gray and white matter were successfully delineated in ten patients. Gray and white matter atrophy was detected in the majority of patients even if the lower or upper motor neuron was clinically unaffected. Patients with predominantly bulbar symptoms did not show relevant spinal cord abnormalities. This suggests a possible role of PSIR imaging as a biomarker for the spatial and temporal distribution of pathological changes in motor neuron disease.
PURPOSE
Currently no biomarker exists to disentangle the spatial and temporal progression of underlying neuropathological changes within the spinal cord (SC) in vivo in patients with motor neuron disease (MND).
A clinically feasible phase sensitive inversion recovery (PSIR) acquisition protocol has been demonstrated to reliably distinguish gray matter (GM) and white matter (WM) structures in the SC of healthy controls (HC)1,2 and in multiple sclerosis patients, in which it has been shown that GM atrophy correlates with clinical disability3.
With this study we investigated whether SC GM and WM atrophy could be detected in MND using PSIR imaging and whether GM and WM cord atrophy is associated with clinical disability.
METHODS
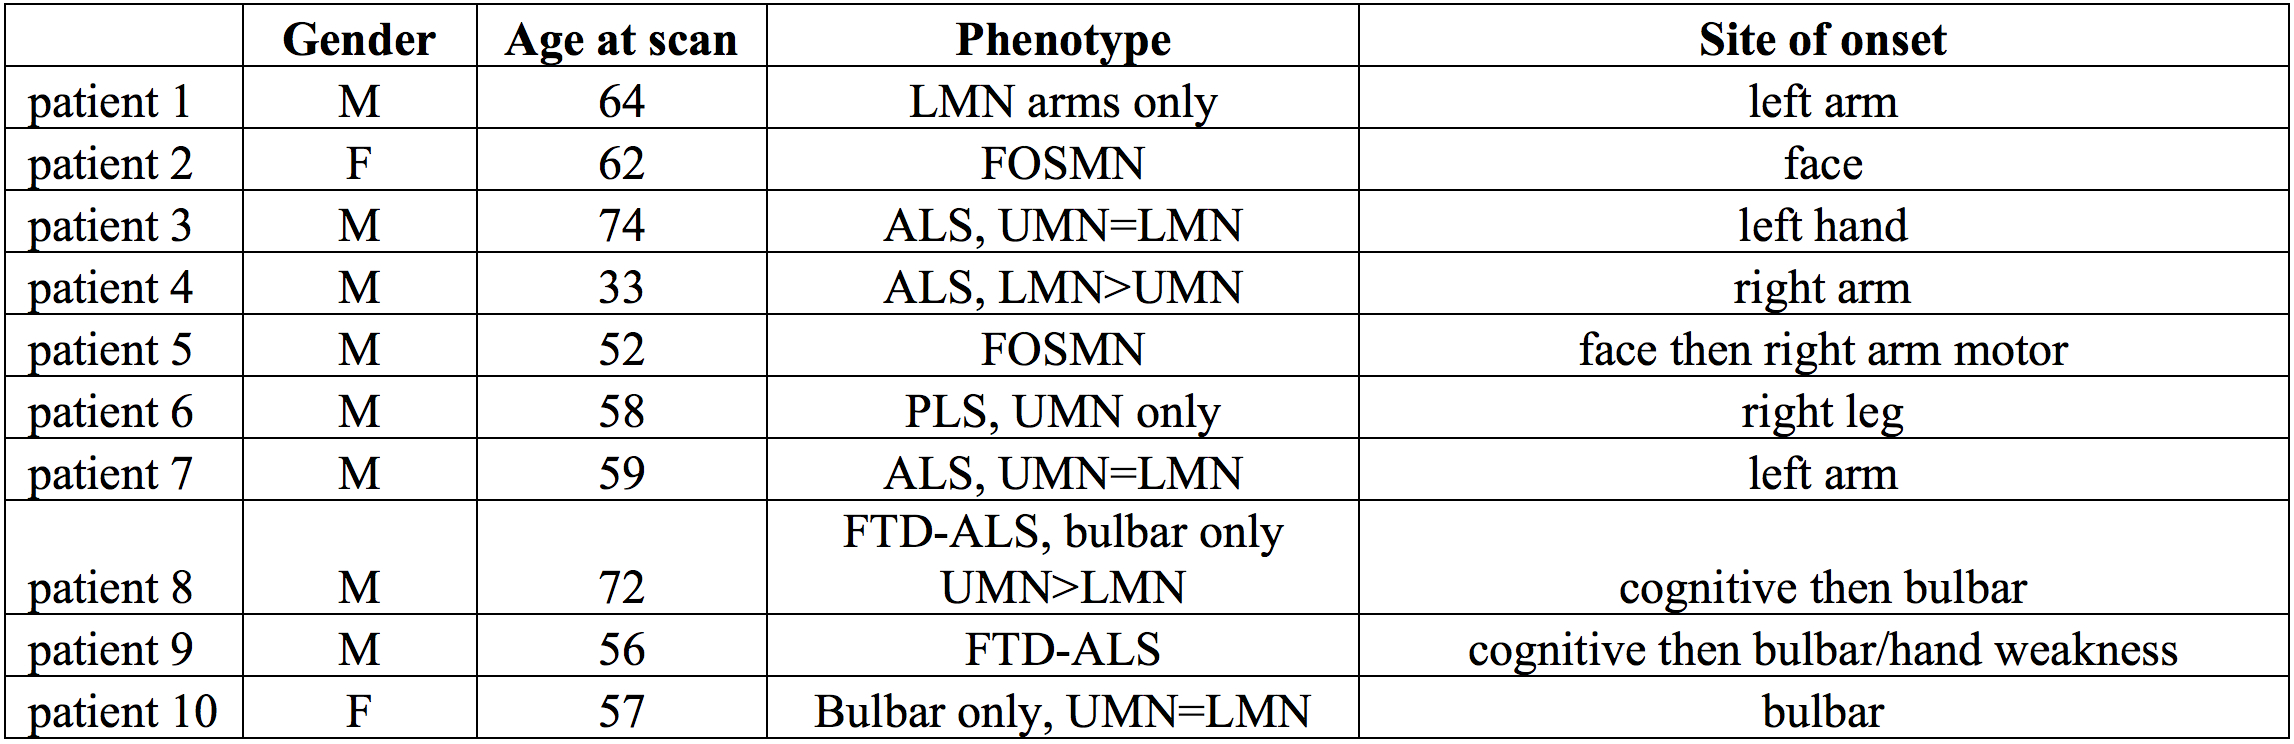
A total of 10 patients with a diagnosis within the MND spectrum (Figure 1) and 10 HC data previously published1,2 were included in the study.
MND was diagnosed by clinical and electrophysiological examination. Amyotrophic lateral sclerosis (ALS) was diagnosed according to the Awaji criteria4. The revised ALS functional rating scale (ALSFRS-R)5 was obtained by a neurologist.
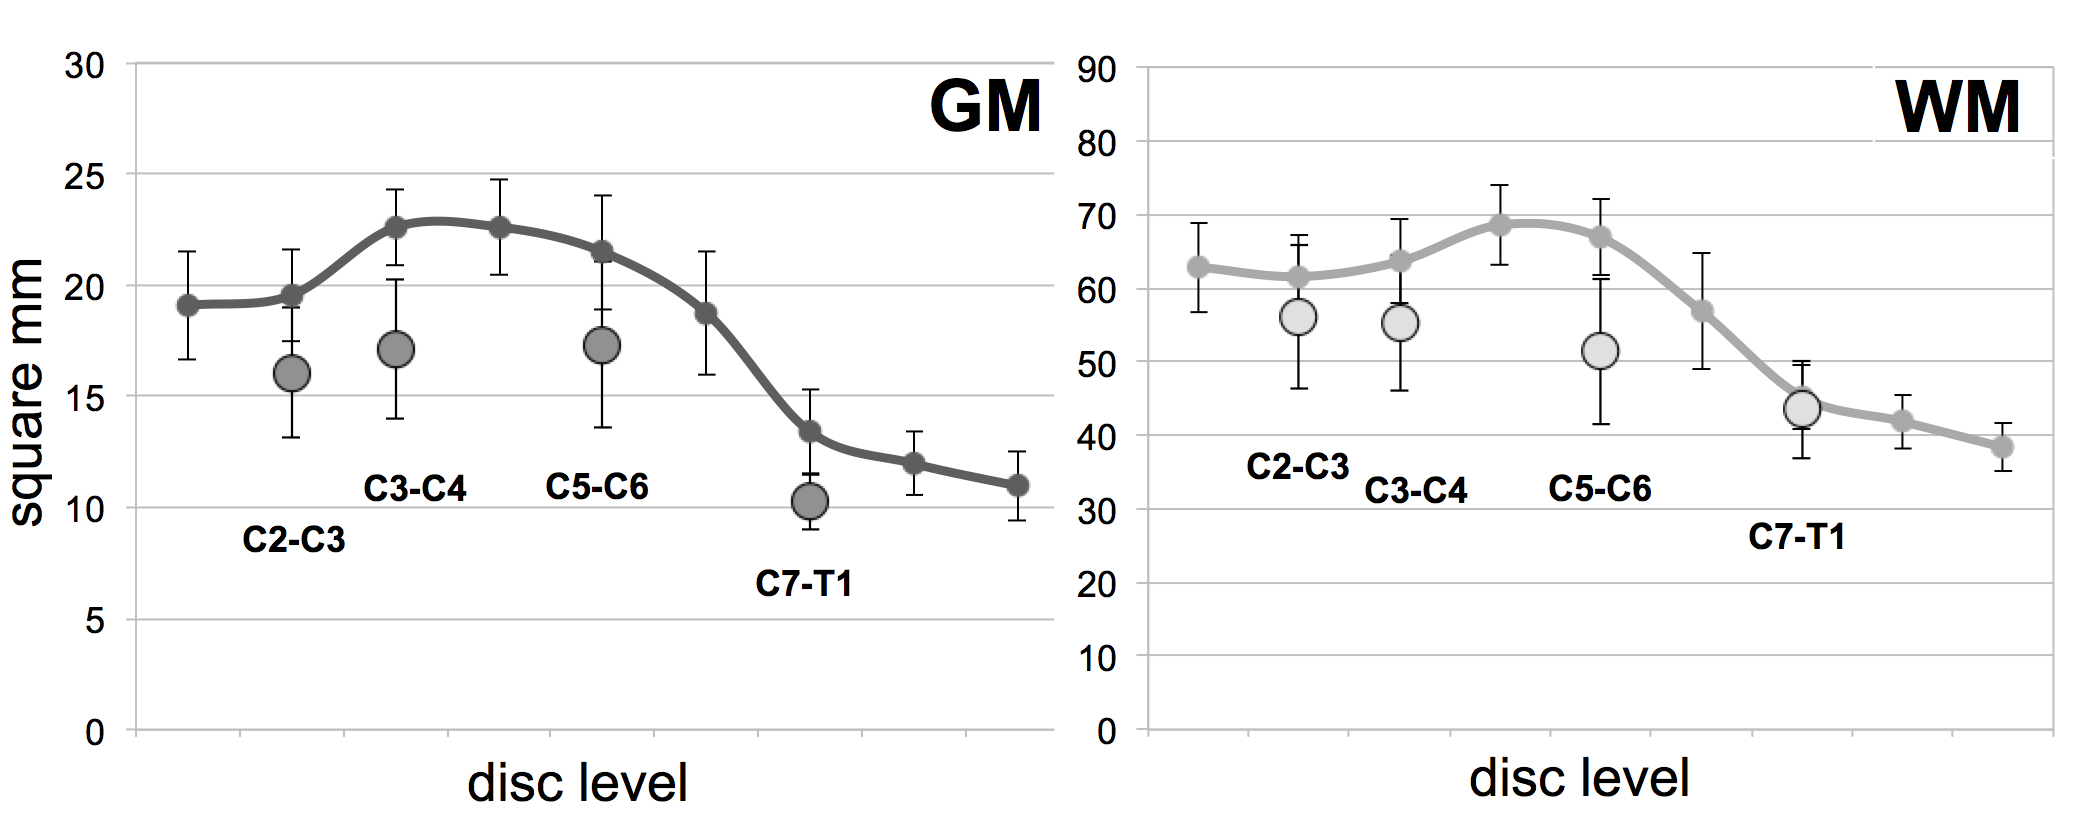
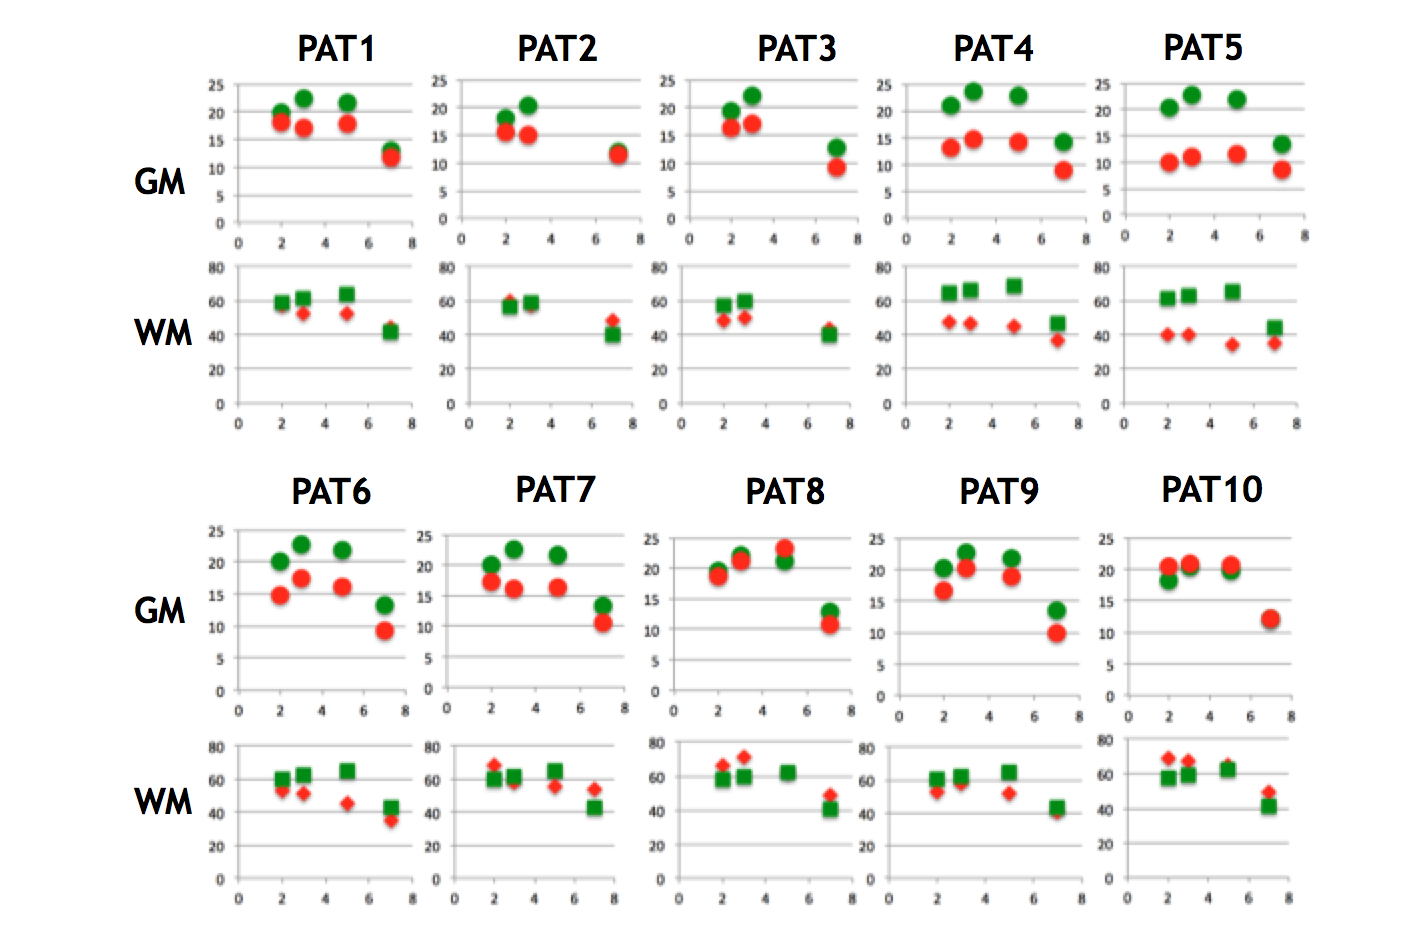
Axial 2D PSIR images were acquired at four cervical disc levels (C2-C3, C3-C4, C5-C6 and C7-T1) in the patients using a 3T Siemens Skyra MRI system. Total cross-sectional cord area (TCA) and GM areas of the ten patients at the four different levels were measured on the phase-sensitive reconstructed images using JIM6. TCA estimates were obtained in a semi-automated way by a single operator (NP) with a method that was previously proven to provide high intra- and inter-rater reliability1,2. Three operators (EC, AB and NP) manually segmented the GM area three times using JIM, and for each patient/level, the average GM area was calculated. The average measure across the three operators was finally computed. The WM area for each patient/level was calculated as the difference between the TCA and the average GM area.
Before working on the MND patients' dataset, the three operators trained on the data of the 10 HC at two selected levels (C2-C3 and C7-T1) and the consistency of results was tested with intraclass correlation coefficients (ICC) and t-tests.
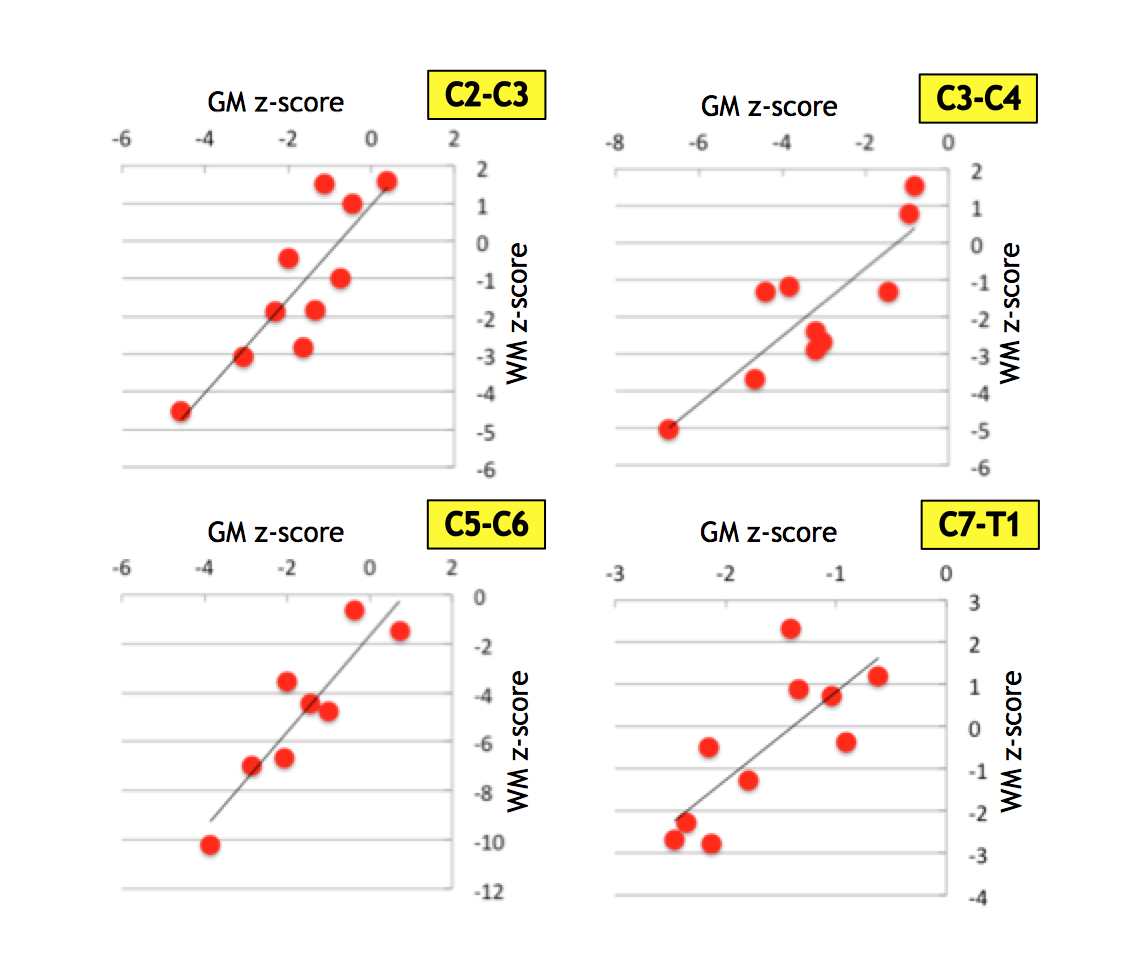
Differences between the means of GM, WM and TCA between the HC and the MND patients were analyzed using a two-tailed t-test. Z-cores for each patient (relative to the HC group) were computed at each level and the WM and GM values compared. ALSFRS-R scores were adjusted for disease duration to obtain the disease progression rate as suggested by Proudfoot et al.7. Linear regression analyses were performed to correlate ALSFRS-R scores with TCA, GM and WM areas in MND patients.
RESULTS
Six patients were diagnosed with ALS (bulbar: two, limb onset: four), two with facial-onset sensory and motor neuronopathy (FOSMN) syndrome, one with primary lateral sclerosis and one with progressive muscular atrophy. Two of the patients diagnosed with ALS also had frontotemporal dementia.
No statistical differences were found between the different operators on the HC data. The ICC among the three operators for all segmentations was 0.9808 and 0.9173 for the HC subset data and the MND patients, respectively.
MND patients had smaller cervical cord GM areas than did HC (Figure 2 and Figure 3) at all four levels (C2-C3: p=0.006, mean difference (MD):-3.5±1.1mm2; C3-C4: p=0.0001, MD:-5.5±1.1mm2; C5-C6 GM: p=0.013, MD:-4.2±1mm2; C7-T1: p=0.0004, MD:-3.1±0.7mm2). WM areas in MND were significantly reduced at C3-C4 (p=0.04, MD:-7.5±3.4mm2) and C5-C6 level (p=0.0003, MD:-15.4±3.3mm2). Significant changes in TCA were found at C2-C3 (p=0.05, MD:-8.9±4.3mm2), C3-C4 (p=0.004, MD:-13.9±4.2mm2) and C5-6 level (p=0.0006, MD:-19.6±4.6mm2).
There was a significant positive correlation between WM and GM area reductions described in terms of z-scores (Figure 4). WM areas at C3-C4 level were significantly correlated (p=0.044) with question 4 and 5 of the ALSFRS-R score reflecting arm motor function. MND patients with faster clinical disease progression had smaller TCA, GM and WM areas than did patients with slow clinical disease progression.
The two patients with clinically predominant bulbar involvement did not show relevant reductions in TCA, WM or GM areas. In patients with limb involvement both GM and WM area reductions were seen irrespective of the clinical phenotype, including the two patients with solely upper or lower motor neuron level phenotype, respectively.
DISCUSSION AND CONCLUSION
SC GM and WM atrophy can be detected in vivo in patients with MND using PSIR imaging. ALS patients with bulbar symptoms did not show relevant SC abnormalities. WM and GM atrophy was detected in patients even if the upper or lower motor neuron was clinically unaffected, suggesting a possible role of PSIR imaging as a biomarker for the spatial and temporal distribution of pathological changes in MND.Acknowledgements
No acknowledgement found.References
1. Papinutto N, Schlaeger R, Panara V, et al. 2D phase-sensitive inversion recovery imaging to measure in vivo spinal cord gray and white matter areas in clinically feasible acquisition times. J Magn Reson Imaging. 2015;42(3):698-708.
2. Papinutto N, Schlaeger R, Panara V, et al. Age, gender and normalization covariates for spinal cord gray matter and total cross-sectional areas at cervical and thoracic levels: A 2D phase sensitive inversion recovery imaging study. PLoS One. 2015;10(3):e0118576.
3. Schlaeger R, Papinutto N, Panara V, et al. Spinal cord gray matter atrophy correlates with multiple sclerosis disability. Ann Neurol. 2014;76(4):568-580.
4. de Carvalho M, Dengler R, Eisen A, et al. Electrodiagnostic criteria for diagnosis of ALS. Clin Neurophysiol. 2008;119(3):497-503.
5. Cedarbaum JM, Stambler N, Malta E, et al. The ALSFRS-R: a revised ALS functional rating scale that incorporates assessments of respiratory function. BDNF ALS Study Group (Phase III). J Neurol Sci. 1999;169(1-2):13-21.
6. Horsfield MA, Sala S, Neema M, et al. Rapid semi-automatic segmentation of the spinal cord from magnetic resonance images: application in multiple sclerosis. Neuroimage. 2010;50(2):446-455.
7. Proudfoot M, Jones A, Talbot K, Al-Chalabi A, Turner MR. The ALSFRS as an outcome measure in therapeutic trials and its relationship to symptom onset. Amyotroph Lateral Scler Frontotemporal Degener. 2016;17(5-6):414-425.
Figures