3645
Non-invasive Characterization of the Cerebellar Nuclei in Degenerative Cerebellar Ataxias (SCA3, SCA6) with Quantitative Susceptibility Mapping (QSM) at 3 Tesla1Medical Physics Group, Institute of Diagnostic and Interventional Radiology, Jena University Hospital, Jena, Germany, 2Department of Neurology, Essen University Hospital, Essen, Germany, 3Erwin L. Hahn Institute for Magnetic Resonance Imaging, University Duisburg-Essen, Essen, Germany, 4Institute of Diagnostic and Interventional Neuroradiology, Essen University Hospital, Essen, Germany, 5Medical Physics in Radiology, German Cancer Research Center (DKFZ), Heidelberg, Germany
Synopsis
We investigated non-invasively the cerebellar nuclei of spinocerebellar ataxia type 3 (SCA3) and SCA6 patients by using quantitative susceptibility mapping (QSM) at 3 T. Absolute volumes, relative volumes (with respect to the total intracranial volume), and magnetic susceptibilities of the cerebellar nuclei were found to be significantly lower for the dentate between SCA6 patients and healthy controls but did not significantly differ between SCA3 and healthy controls. Univariate linear correlations of relative nuclei volumes with ataxia rating scales revealed statistically significant correlations for the dentate and globose nuclei in SCA6 but not in SCA3.
Introduction
Degenerative cerebellar ataxias are slowly progressive disorders that affect the cerebellum and cerebellar pathways to various degrees.1 Histological studies show that “grumose” degeneration occurs in the dentate nucleus of spinocerebellar ataxia type 3 (SCA3) patients,2 and suggest that the dentate nucleus and the smaller cerebellar nuclei (i.e., the emboliform nucleus, globose nucleus and fastigial nucleus) undergo neurodegeneration in SCA6.3,4 As histological studies often comprise only a low numbers of subjects and are also limited in their ability to assign neurological deficits to morphological changes, high interest exists in characterizing the cerebellar nuclei in vivo. With a presumably tight coupling between the shape of the cerebellar nuclei and the internal distribution of iron,5 Stefanescu et al.6 demonstrated atrophy of the dentate nuclei in SCA3, which was even more pronounced in SCA6 using high-resolution susceptibility weighted imaging (SWI) at 7 Tesla. Because SWI tends to overestimate nuclei volumes due to its processing with non-local phase data and because ultrahigh-field scanners are not ubiquitously available, we investigated the cerebellar nuclei by using quantitative susceptibility mapping (QSM)7 at a clinical magnetic field strength of 3 T to verify the preliminary findings for the dentate nuclei observed with SWI and to investigate the behavior of the other smaller cerebellar nuclei in SCA3 and SCA6 patients.Material and Methods
Demography: Twenty-two SCA3 and 22 SCA6 patients as well as 40 healthy controls underwent MRI and neurological examinations including the Scale for the Assessment and Rating of Ataxia (SARA)8 and the International Cooperative Ataxia Rating Scale (ICARS).9 Age- and gender-matched comparison groups for SCA3 and SCA6 were formed from the healthy controls (Table 1).
MRI Data Acquisition: Multi-echo, 3D gradient-echo (GRE) imaging (TE1-4= 6.47ms/17.23ms/27.99ms/38.75ms, TR=62ms, flip angle [FA]=17°, bandwidth [BW]1-4=120Hz/px, voxel size=0.5mm×0.5mm×0.5mm) and whole-head T1-weighted imaging (MP-RAGE, voxel size=1mm×1mm×1mm, TE=3.26ms, TR=2530ms, inversion time (TI)=1100ms, FA=7°, BW=200Hz/px) were performed on a 3T whole-body MRI-PET system using a 16-channel head array coil.
MRI Data Processing: Quantitative susceptibility maps were calculated from GRE phase images using V-SHARP10, 11 and homogeneity enabled incremental dipole inversion (HEIDI).12 The total intracranial volume (TICV) was determined from the T1-weighted images using the Computational Anatomy Toolbox 12 (CAT12, http://www.neuro.uni-jena.de/cat/). If clearly discernible, cerebellar nuclei were manually traced in both hemispheres on the axial, sagittal and coronal susceptibility maps using MRICroN (http://people.cas.sc.edu/rorden/mricron/). Extracted absolute nuclei volumes represent the sum of the volumes of both hemispheres. They were divided by the TICV to obtain relative volumes to account for different head sizes.
Results
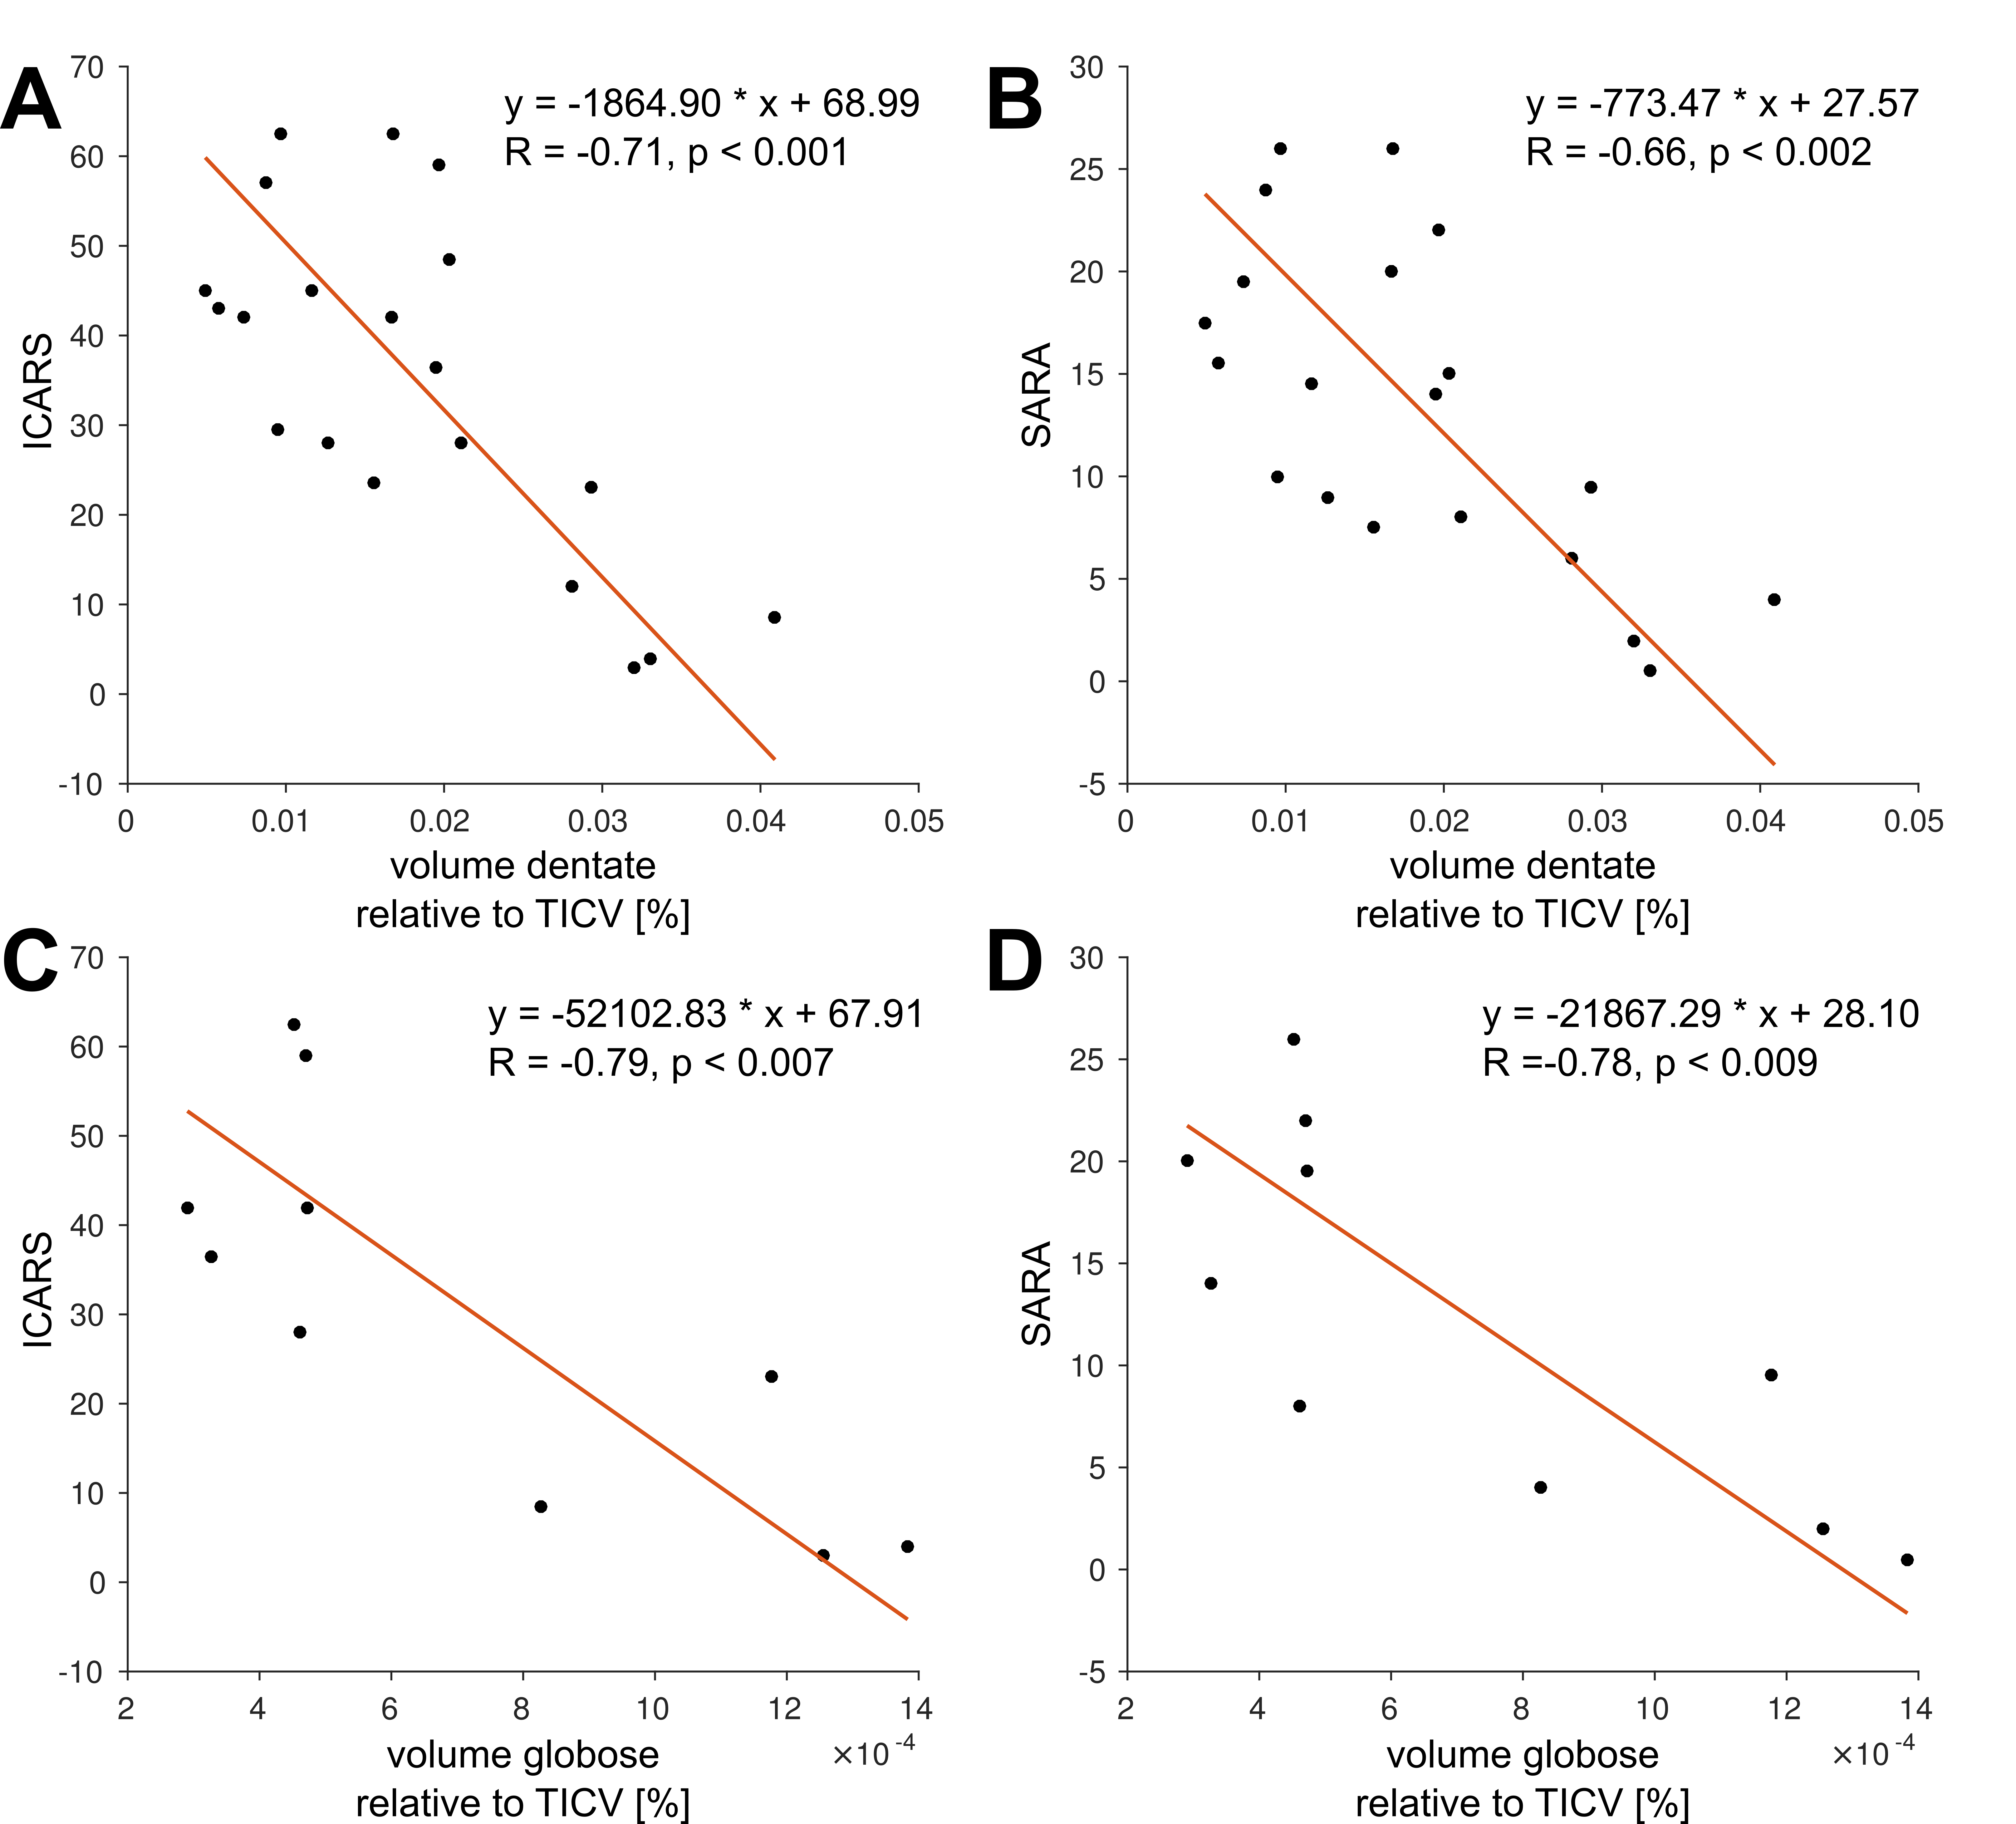
Figure 1A shows typical susceptibility maps of an SCA3 and an SCA6 patient together with a healthy age- and gender-matched subject. Whereas the dentate nuclei were clearly visible across the whole study population, the emboliform, globose and fastigial nuclei could not be identified for all participants (Table 2). Specifically, the three smaller nuclei could only be traced in less than half the SCA6 patients. Volumes and susceptibilities (see Table 2 and boxplots in Figures 1 and 2) were significantly lower for the dentate between SCA6 patients and healthy controls, as were relative volumes of the globose and fastigial nuclei (Table 2, Figure 2). Univariate linear correlations of relative nuclei volumes with ICARS and SARA revealed statistically significant correlations only for the dentate and globose nuclei in SCA6 (Figure 3).Discussion
Absolute volumes of the dentate and globose nuclei (Table 2) for healthy subjects are in good agreement with histological volume measurements (dentate: (784.7±192.7)mm³, globose: (19±8.5)mm³), whereas our extracted volumes for the emboliform and fastigial nuclei are substantially underestimated (emboliform: (99.7±24.0) mm³, fastigial: (91.4±20.4)mm³).13 The latter results should thus be viewed with caution. We were unable to replicate the previously reported relative volume reductions of the dentate nuclei in SCA3 compared to healthy controls6 with QSM at 3T, putatively due to different criteria to delineate the dentate. This is supported by the substantially lower volumes observed by Stefanescu et al.6 (dentate SCA3: (310±67.1)mm³, dentate HC: (427.9±96.9)mm³) compared to our study (Table 2). Our finding of substantially lower volumes in SCA6 compared to healthy controls is supported by literature.6 We demonstrated for the first time non-invasively that the globose nuclei also atrophy in SCA6 patients and that the volume correlates with neurological disease scores.Conclusion
QSM at 3T is able to delineate the cerebellar nuclei in both healthy subjects and ataxia patients. With faster acquisition strategies, such as WAVE-CAIPI14 or 3D echo-planar imaging,15 it is expected that high-resolution GRE acquisitions for QSM can be performed in a clinical setting to non-invasively characterize cerebellar nuclei in ataxia monitoring or to characterize other cerebellar diseases.Acknowledgements
We thank Beate Brol for manual delineation of the deep cerebellar nuclei. The study is funded by the German Research Foundation (DFG, DE 2516/1-1 and TI 239/17-1) and the Essener Ausbildungsprogramm "Labor und Wissenschaft" für den ärztlichen Nachwuchs (ELAN, awarded to D. Jäschke).References
1. Klockgether T. Update on degenerative ataxias. Current opinion in neurology. 2011;24(4):339-345.
2. Koeppen AH. The pathogenesis of spinocerebellar ataxia. Cerebellum. 2005;4(1):62-73.
3. Wang X, Wang H, Xia Y, et al. A neuropathological study at autopsy of early onset spinocerebellar ataxia 6. J Clin Neurosci. 2010;17(6):751-755.
4. Gierga K, Schelhaas HJ, Brunt ER, et al. Spinocerebellar ataxia type 6 (SCA6): neurodegeneration goes beyond the known brain predilection sites. Neuropathol Appl Neurobiol. 2009;35(5):515-527.
5. Koeppen AH, Ramirez RL, Yu D, et al. Friedreich's ataxia causes redistribution of iron, copper, and zinc in the dentate nucleus. Cerebellum. 2012;11(4):845-860.
6. Stefanescu MR, Dohnalek M, Maderwald S, et al. Structural and functional MRI abnormalities of cerebellar cortex and nuclei in SCA3, SCA6 and Friedreich's ataxia. Brain. 2015;138(Pt 5):1182-1197.
7. Deistung A, Schweser F, Reichenbach JR. Overview of quantitative susceptibility mapping. NMR Biomed. 2017;30(4).
8. Schmitz-Hubsch T, du Montcel ST, Baliko L, et al. Scale for the assessment and rating of ataxia: development of a new clinical scale. Neurology. 2006;66(11):1717-1720.
9. Trouillas P, Takayanagi T, Hallett M, et al. International Cooperative Ataxia Rating Scale for pharmacological assessment of the cerebellar syndrome. The Ataxia Neuropharmacology Committee of the World Federation of Neurology. J Neurol Sci. 1997;145(2):205-211.
10. Schweser F, Deistung A, Lehr BW, Reichenbach JR. Quantitative imaging of intrinsic magnetic tissue properties using MRI signal phase: an approach to in vivo brain iron metabolism? NeuroImage. 2011;54(4):2789-2807.
11. Wu B, Li W, Guidon A, Liu C. Whole brain susceptibility mapping using compressed sensing. Magn Reson Med. 2012;67(1):137-147.
12. Schweser F, Sommer K, Deistung A, Reichenbach JR. Quantitative susceptibility mapping for investigating subtle susceptibility variations in the human brain. NeuroImage. 2012;62(3):2083-2100.
13. Tellmann S, Bludau S, Eickhoff S, Mohlberg H, Minnerop M, Amunts K. Cytoarchitectonic mapping of the human brain cerebellar nuclei in stereotaxic space and delineation of their co-activation patterns. Front Neuroanat. 2015;9:54.
14. Bilgic B, Xie L, Dibb R, et al. Rapid multi-orientation quantitative susceptibility mapping. NeuroImage. 2016;125:1131-1141.
15. Sati P, Thomasson DM, Li N, et al. Rapid, high-resolution, whole-brain, susceptibility-based MRI of multiple sclerosis. Mult Scler. 2014;20(11):1464-1470.
Figures