3644
1H-[13C]-NMR Evaluation of Neurometabolism in Rotenone Mouse Model of Parkinson’s disease1NMR Microimaging and Spectroscopy, Centre for Cellular and Molecular Biology, Hyderabad, India
Synopsis
Parkinson’s disease (PD) is a common progressive neurodegenerative disorder, which affects motor coordination and movement. Currently there is no biomarker for the early diagnosis of disease. In the current study we have evaluated the neurometabolism in rotenone mouse model of PD using 1H-[13C]-NMR NMR spectroscopy in conjunction with an infusion of [1,6-13C2]glucose. Our results show that the neurometabolism is compromised in rotenone treated mice suggesting that both the excitatory and inhibitory neurotransmission are impaired in PD.
INTRODUCTION
Parkinson’s disease (PD) is an age dependent, progressive movement disorder, which is associated with the degeneration of dopaminergic neurons in the substantia nigra pars compacta. Bradykinesia, tremors at rest, stiffness and postural inability are the cardinal symptoms of the disease.1 Despite years of thorough research, the disease still lacks accurate diagnostic techniques. Rotenone, a naturally occurring pesticide, causes typical symptoms of PD in rodents.2 Moreover, epidemiological studies in human suggested exposure to rotenone causes PD.3 Glutamate and GABA are the major excitatory and inhibitory neurotransmitters, respectively, in the matured central nervous system.4 These neurotransmitters are shown to be impaired in different neurological disorders.5,6 In this study, we have used 1H-[13C]-NMR spectroscopy to investigate neuronal metabolic activity across brain in Rotenone mouse model of PD.METHODS
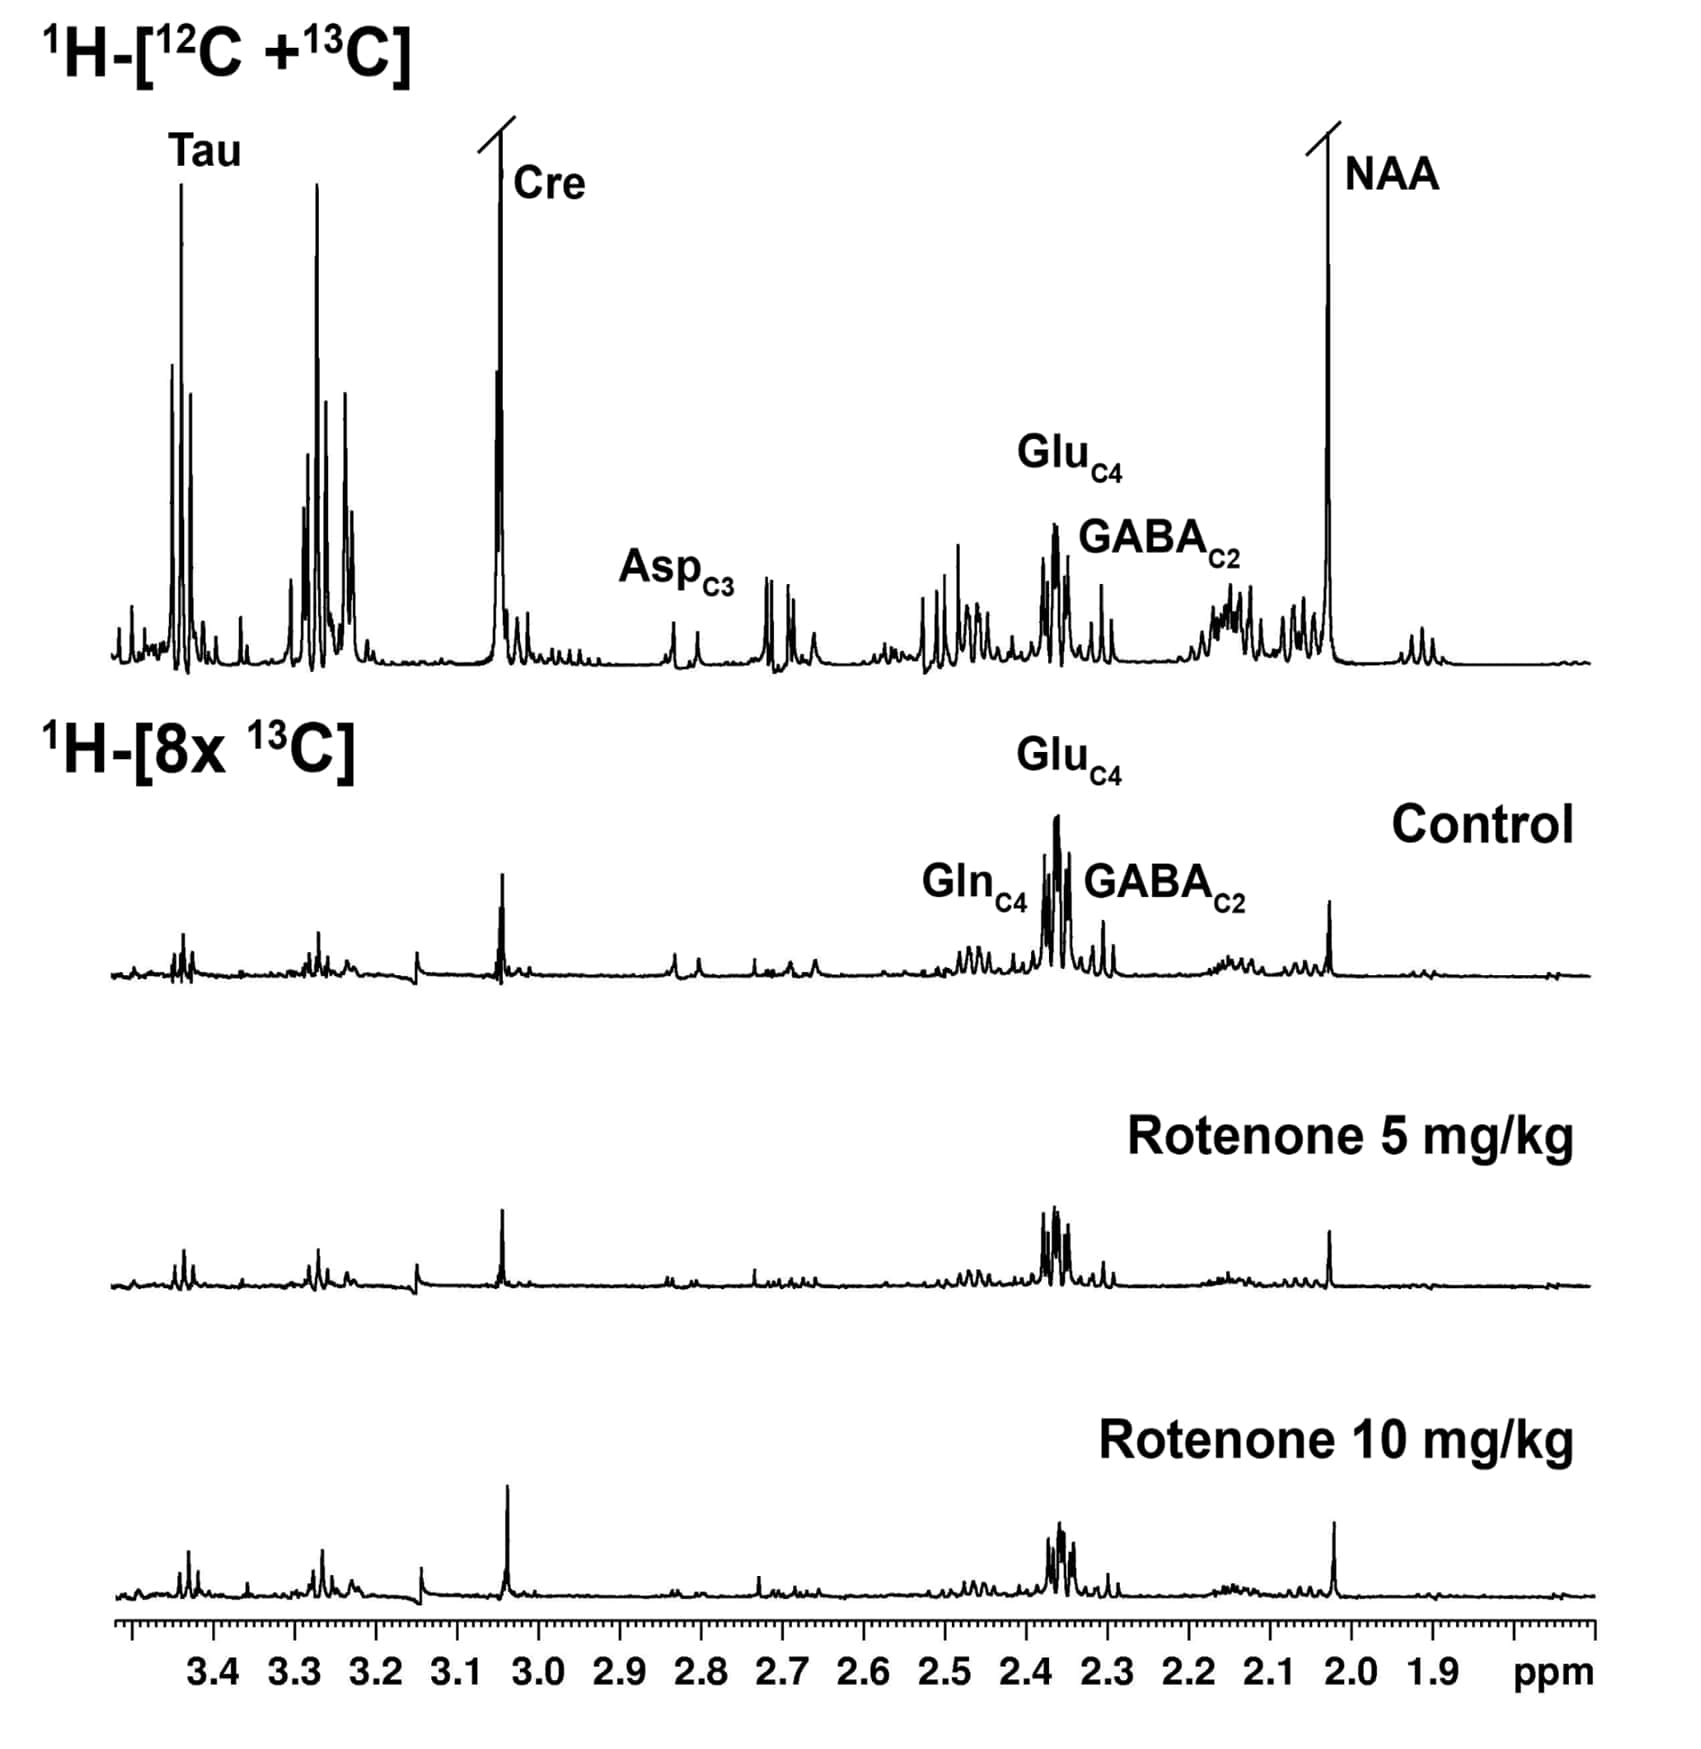
Animal experiments were conducted in accordance with the approved protocol from Institutional Animal Ethics Committee, CSIR-CCMB. Four months old C57BL6J mice were used for the study. Rotenone dissolved in DMSO was diluted 50 times with sunflower oil, and administered with dose of 5 mg/kg (n=5) and 10 mg/kg (n=3) intraperitoneally for a period of 28 days. The control mice (n=7) received the vehicle for the same duration. Motor function was evaluated using Grip-Strength and Rotarod tests. For metabolic measurements, mice were anesthetized with urethane (1.5 mg/kg, intraperitoneal), and were infused with [1,6-13C2]glucose via the tail vein for 10 minutes using a bolus variable infusion rate.7 Brain metabolism was arrested using Focused Beam Microwave Irradiation (4.9kW, 0.85s). Metabolites were extracted from brain tissues, and 1H-[13C]-NMR spectra of tissue extracts were obtained at 600 MHz NMR spectrometer for measurement of the concentration and the 13C labeling of brain metabolites.8 The cerebral metabolic rates of glucose oxidation (CMRGlc(ox)) were calculated from the 13C labeling of amino acids.9 One way ANOVA was carried out to determine the statistical significance of difference of metabolite levels and metabolic rates among different groups.RESULTS AND DISCUSSIONS
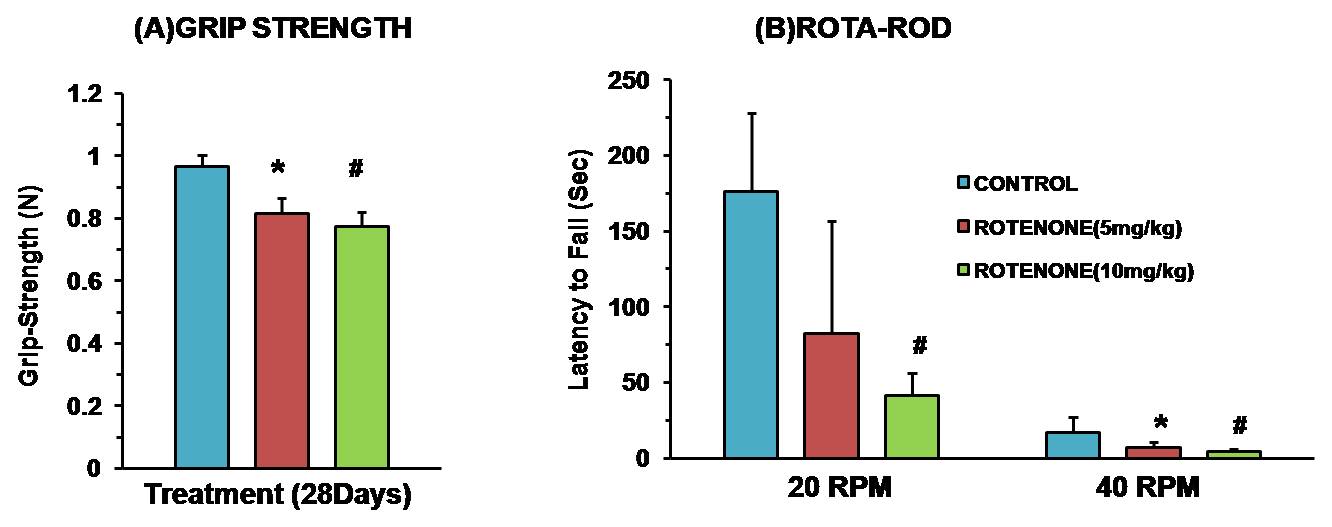
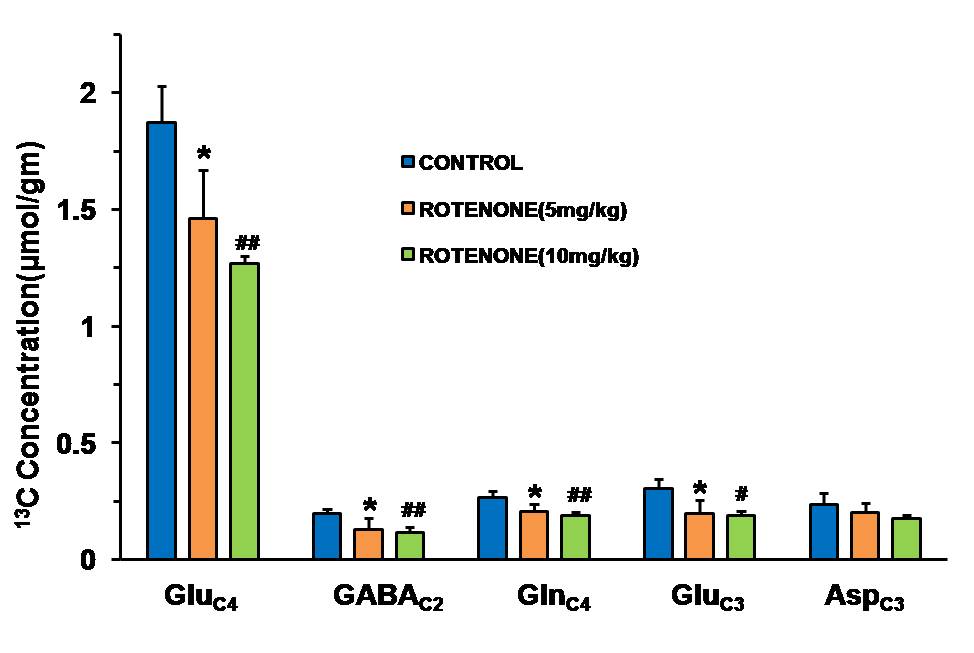
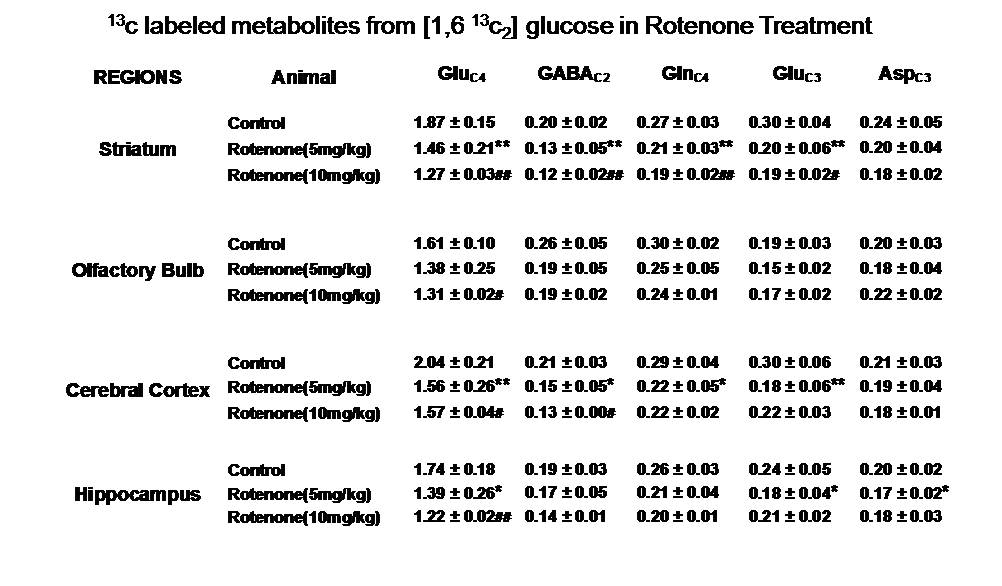
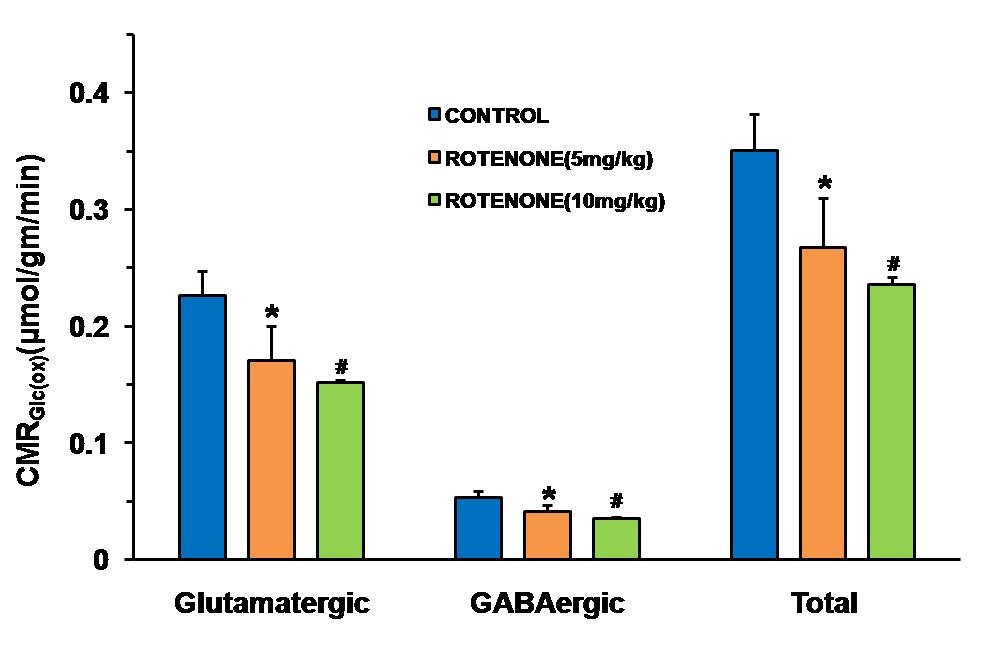
Mice exposed to rotenone showed reduced paw grip-strength as compared with vehicle treated controls. Moreover, rotenone treated mice showed reduced motor coordination at 20 and 40 rpm in rota-rod test. These data suggest that exposure to rotenone leads to manifestation of Parkinson like symptoms. There was no significant change in levels of neurometabolite following rotenone exposure in mice. The concentrations of 13C labeled metabolites such as GluC4, GABAC2, GlnC4 and GluC3 were decreased in the striatum, cerebral cortex, olfactory bulb and hippocampus in rotenone treated mice when compared with controls. The rates of glucose oxidation by glutamatergic and GABAergic neurons were reduced significantly (p<0.01) in the striatum, while glutamategric neuronal metabolic activity was reduced significantly (p<0.05) in the hippocampus and Cerebral Cortex in both groups .These findings together with reported stoichiometric coupling between neuronal glucose oxidation and neurotransmitter cycling10 suggest that both excitatory and inhibitory neurotransmission is impaired in rotenone mouse model of PD.Acknowledgements
This Study was supported by Grant from CSIR-CCMB.References
1. Postuma RB, Berg D, Stern M, et al (2015) MDS clinical diagnostic criteria for Parkinson's disease. Mov Disord 30:1591–1601.
2. Cannon JR, Tapias VM, Na HM, Honick AS, Drolet RE, Greenamyre JT (2009) A highly reproducible rotenone model of Parkinson’s disease. Neurobiology of disease 34(2):279-290.
3. Tanner CM, Kamel F, Ross GW, et al. Rotenone, Paraquat, and Parkinson’s Disease (2011) Environmental Health Perspectives. 119(6):866-872.
4. Chowdhury GM, Patel AB, Mason GF, Rothman DL, Behar KL (2007) Glutamatergic and GABAergic neurotransmitter cycling and energy metabolism in rat cerebral cortex during postnatal development. J Cereb Blood Flow Metab 27:1895–1907.
5. Veeraiah P, Noronha JM, Maitra S, Bagga P, Khandelwal N, Chakravarty S, Kumar A, Patel AB* (2014) Dysfunctional Glutamatergic and GABAergic Activities in Prefrontal Cortex of Mice in Social Defeat Model of Depression. Biol Psychiatry 76:231-238.
6. Patel AB, Tiwari V, Veeraiah P, Saba K (2017) Increased Astroglial Activity and Reduced Neuronal Function Across Brain in AβPP-PS1 Mouse Model of Alzheimer's Disease. J Cereb Blood Flow Metab DOI: 10.1177/0271678X17709463.
7. Tiwari V, Ambadipudi S, Patel AB (2013) Glutamatergic and GABAergic TCA cycle and neurotransmitter cycling fluxes in different regions of mouse brain. J Cerebr Blood Flow Metab 33(10):1523-1531.
8. Patel AB, de Graaf RA, Mason GF, Rothman DL, Shulman RG, Behar KL (2005) The contribution of GABA to glutamate/glutamine cycling and energy metabolism in the rat cortex in vivo. Proc Natl Acad Sci USA 102(15):5588-5593.
9. de Graaf RA, Brown PB, Mason GF, Rothman DL and Behar KL (2003) Detection of [1,6-13C2]-glucose metabolism in rat brain by in vivo 1H-[13C]-NMR spectroscopy. Magn Reson Med, 49: 37–46.
10. Hyder F, Patel AB, Gjedde A, Rothman DL, Behar KL, Shulman RG (2006) Neuronal-glial glucose oxidation and glutamatergic-GABAergic function. J Cereb Blood Flow Metab. 26(7):865-77.
Figures