3637
White Matter Property of the Reward Circuits in Impulse Control Disorders in Parkinson’s Disease1Neurology Department, National Taiwan University Hospital Hsinchu branch, Hsinchu city, Taiwan, 2Neurology Department, Tzu Chi Hospital, Hualien City, Taiwan, 3Institute of Medical Device and Imaging, National Taiwan University, Taipei City, Taiwan, 4Graduate Institute of Brain and Mind Sciences, National Taiwan University, Taipei City, Taiwan, 5Neurology Department, National Taiwan University Hospital, Taipei City, Taiwan
Synopsis
Approximately 10-20% of Parkinson’s disease (PD) patients treated with dopamine agonist may develop impulse control disorder (ICD). We aimed to investigate microstructural characteristics of the white matter (WM) tracts in the reward circuits in PD-ICD by DSI images. ReMAP (Mean Apparent Propagator) was used for DSI reconstruction and TBAA (tract-based automatic analysis) for further tract analysis. Among the frontostriatal tracts (FS) and amygdala-related tracts, we found
Background
Loss of dopaminergic cells is the main cause of motor symptoms in Parkinson’s disease (PD), and dopamine replacement therapies are the major treatment for PD. However, approximately 10-20% of PD patients treated with dopamine agonist may develop impulse control disorder (ICD). Dysfunction of the reward circuits is considered the main underlying mechanism.1,2 In this study, we aimed to investigate microstructural characteristics of the white matter (WM) tracts in the reward circuits in PD-ICD.Method
We collected 13 PD patients with ICD (pathological gambling) (group ICD), 13 PD patients without ICD (group PD) and 14 healthy controls (group HC).
MRI acquisition
All images were acquired on a 3T MRI system (TIM Trio, Siemens, Erlangen, Germany) with a 32-channel phased-array head coil. T1-weighted images were acquired with rapid gradient echo sequence: TR/TE=2000ms/2.98ms; flip angle=90o; matrix size=256×192×208; FOV=256×192×208mm3. DSI with 56 contiguous axial images was acquired with a pulsed gradient spin-echo diffusion echo planar imaging sequence with twice-refocused balanced echo to reduce eddy current distortion. The parameters were as followings: TR=9600ms; TE=130ms; matrix size=80×80; FOV=200×200mm2; and slice thickness=2.5mm without gap. A total of 102 volumes of diffusion-weighted images were acquired with diffusion-encoding gradient vectors pointing at the grid points within a half sphere of the q-space; the maximum diffusion sensitivity was 4,000 s/mm2.
DSI data reconstruction
ReMAP was used for DSI reconstruction. Mean Apparent Propagator (MAP)-MRI is a robust method to convert the diffusion signal attenuation to the diffusion propagator through the well-known Fourier transform (FT) relationship. MAP-MRI fits with a linear combination of Hermite functions. ReMAP is an improved version of MAP-MRI by regularizing the optimization process during estimation.3,4 Various diffusion indexes were calculated from the MAP-MRI coefficients, including GFA, FA, AD, RD, and MD.
Tract-based automatic analysis (TBAA) 5
A study-specific-template (SST) was created from the datasets of the 40 participants and then registered to the NTU-DSI-122 template. Sampling coordinates of the predefined 76 major WM tracts were transformed from the NTU-DSI-122 template to individual DSI. GFA, FA, AD, RD, and MD values were sampled in native DSI space using the transformed sampling coordinates. In this study, we derive the mean indices of each tract bundle in each participant.
Statistics
From the previous understanding of ICD and other addiction studies, we chose 11 tracts in reward circuits for further analysis, including bilateral frontostriatal (FS) tracts (from the striatum to the orbitofrontal, dorsolateral prefrontal, ventromedial prefrontal, and precentral motor cortices) and the amygdala-related tracts including bilateral stria terminalis (connecting septal nuclei and amygdala) and the callosal fibers connecting bilateral amygdala.
MANCOVA with age and sex as covariates was performed between the two groups, ICD and PD groups, to evaluate the WM structural difference related to ICD development.
Result
Sample characteristics
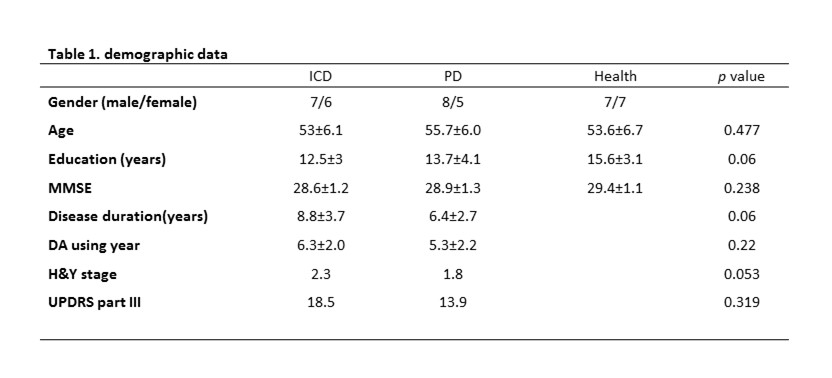
There were no significant differences in age, sex, disease duration, disease severity between the two groups. (Table 1)
Microstructural characteristics of the WM
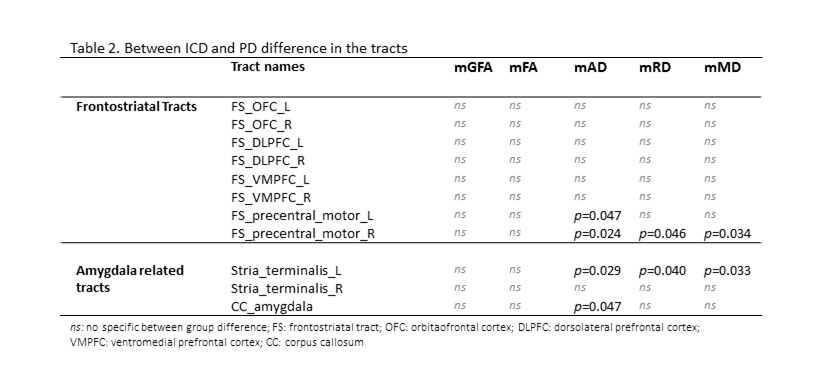
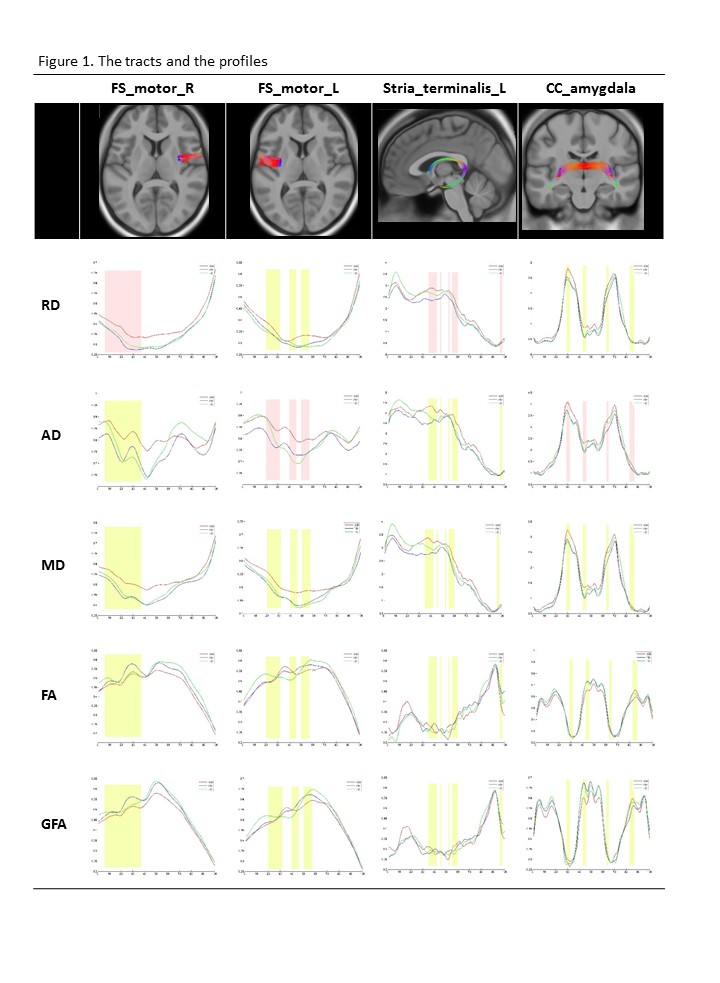
Among the 11 tracts, mean AD, RD and MD showed significant difference between ICD and PD in the right FS_motor cortex, and the left stria terminalis. Mean AD difference is also found in the left FS_motor cortex and the callosal fibers connecting bilateral amygdala. The profiles of the indices along the tracts are shown in Figure 1 with highlight of the segments according to the intergroup RD difference in the former two tracts and according to intergroup AD difference in the latter two tracts. There is no inter-group difference in FA and GFA. The profiles of the HC subjects were plotted together for interpretation. Even though significance was not achieved, among the profiles worse FA and GFA of the right FS_motor cortex were found in ICD comparing to PD and HC.
Discussion
Among the image indices, GFA and FA are known to refer to the white matter integrity, while recent data support that increased RD may indicate poor myelination or axonal packing attenuation, and the increment of AD might be due to increased extra-axonal space following neuronal loss.
Our result suggests ICD subjects have worse myelination in the frontostriatal tracts to the motor cortex and the amygdala related tracts as compared to the PD group. A poor WM microstructure in rewarding circuits could underlie the ICD developement, or a superior WM microstructure could play a protective role in those without ICD. The less healthy WM microstructure in rewarding circuits could explain the vulnerability to dopaminergic stimulation and results in hyper-gambling behavior. The ICD subjects’ inferiority of WM property in reward circuits could be either innate or disease related.
Conclusion
Worse WM property in the rewarding circuits was found in ICD subjects as compared to those without ICD, and it may help elucidate the underlying mechanism.Acknowledgements
No acknowledgement found.References
1. Rao, H., Mamikonyan, E., Detre, J. A., Siderowf, A. D., Stern, M. B., Potenza, M. N., & Weintraub, D. (2010). Decreased ventral striatal activity with impulse control disorders in Parkinson's disease. Movement Disorders, 25(11), 1660-1669.
2. Aracil-Bolaños, I., & Strafella, A. P. (2016). Molecular imaging and neural networks in impulse control disorders in Parkinson's disease. Parkinsonism & related disorders, 22, S101-S105.
3. Özarslan, E., Koay, C. G., Shepherd, T. M., Komlosh, M. E., İrfanoğlu, M. O., Pierpaoli, C., & Basser, P. J. (2013). Mean apparent propagator (MAP) MRI: a novel diffusion imaging method for mapping tissue microstructure. NeuroImage, 78, 16-32.
4. Avram, A. V., Sarlls, J. E., Barnett, A. S., Özarslan, E., Thomas, C., Irfanoglu, M. O., ... & Basser, P. J. (2016). Clinical feasibility of using mean apparent propagator (MAP) MRI to characterize brain tissue microstructure. NeuroImage, 127, 422-434.
5. Chen, Y. J., Lo, Y. C., Hsu, Y. C., Fan, C. C., Hwang, T. J., Liu, C. M., ... & Tseng, W. Y. I. (2015). Automatic whole brain tract‐based analysis using predefined tracts in a diffusion spectrum imaging template and an accurate registration strategy. Human brain mapping, 36(9), 3441-3458.
Figures