3636
Alteration of brain structure network in Parkinson’s disease with and without rapid eye movement sleep behavior disorder1Radiology, Second Affiliated Hospital of Zhejiang University School of Medicine, Hangzhou, China, 2Second Affiliated Hospital of Zhejiang University School of Medicine, Hangzhou, China
Synopsis
We detected the alteration of structure correlation network in Parkinson’s disease (PD) patients with and without Rapid eye movement sleep behavior disorder (RBD). 191 PD patients including 51 possible RBD (pRBD) and 140 non-possible RBD (npRBD) and 76 normal controls were included. Structure brain networks were constructed by thresholding gray matter volume correlation matrices and analyzed using graph theoretical approaches. Significant enhanced nodal properties and hub recruitment were found mainly in limbic system while decreased nodal parameters were observed in cerebellum in PD-pRBD. This study may contribute to understand the pathophysiology of PD-RBD.
Introduction
Rapid eye movement (REM) sleep behavior disorder (RBD) is a common parasomnia characterized by loss of normal skeletal muscle atonia during REM sleep with prominent dreaming and motor activity1, 2. Studies show that it has a strong association with α synucleinpathies such as Parkinson’s disease (PD)3, 4, where it can either occur during the course of the disease or appear at the prodromal phase of PD5. PD patients with RBD tend to have a poorer prognosis in terms of postural instability, gait disturbance, cognitive impairment, and even an association with visual hallucination compared with PD patients without RBD6, 7. Therefore, it is necessary to investigate the pathophysiological mechanism of RBD in PD patients, which may provide new insights to understand the substrate of PD. In the current study, we sought to investigate the altered topological properties of the structural correlation network in PD patients with possible RBD (PD-pRBD) and non-possible RBD (PD-npRBD). We hypothesized that both PD-pRBD and PD-npRBD had disrupted brain network, and PD-pRBD would exhibited a disinhibition (activated) trend.Methods
191 PD patients including 51 with possible RBD (pRBD) and 140 non-possible RBD (npRBD) and 76 normal controls (NCs) were included in the present study. Structure brain networks were constructed by thresholding gray matter volume correlation matrices of 116 regions and analyzed using graph theoretical approaches. We analyzed small-worldness (σ), global and regional properties as well as hub distribution of structure correlation networks of three groups. Non-parametric permutation test with 1000 repetitions was used to test the statistical significance of the between-group differences in network topology properties.Results
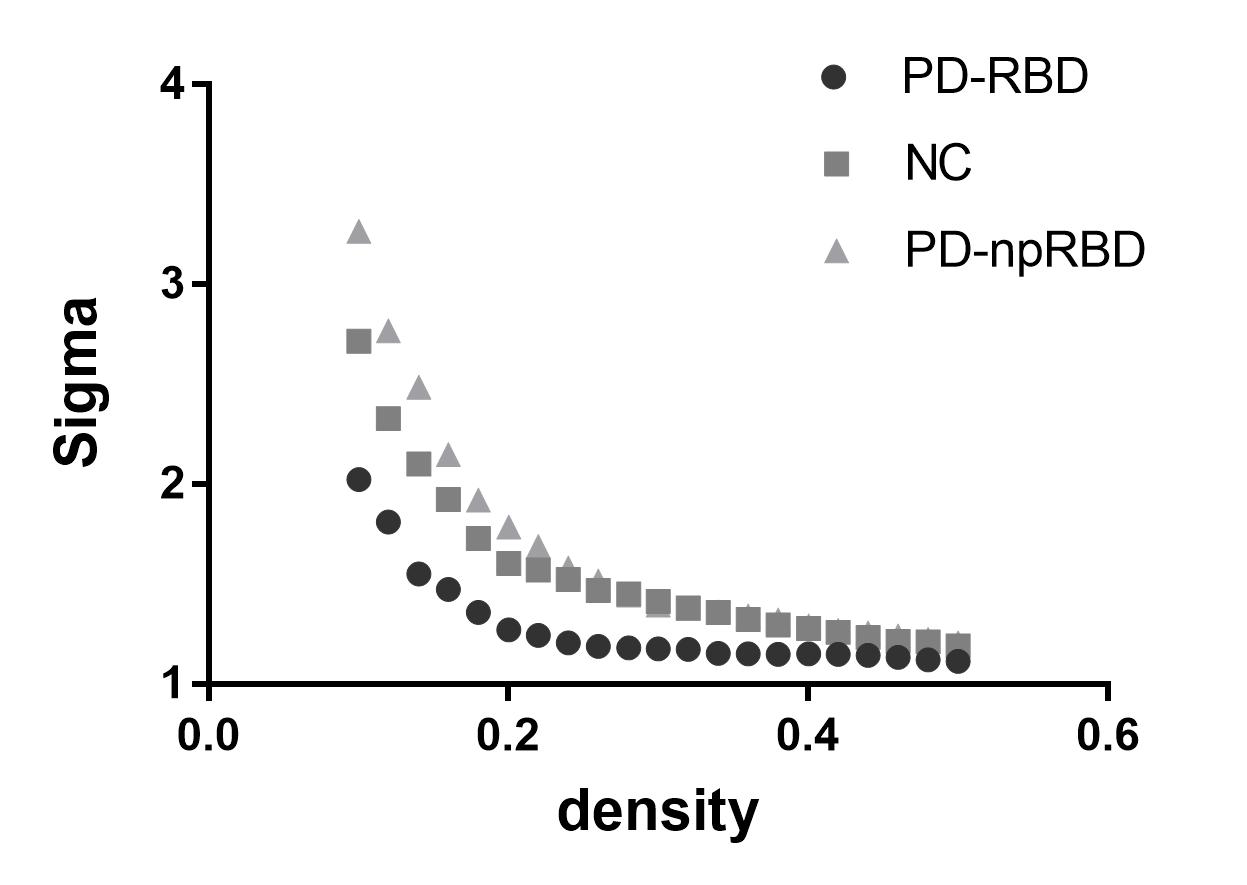
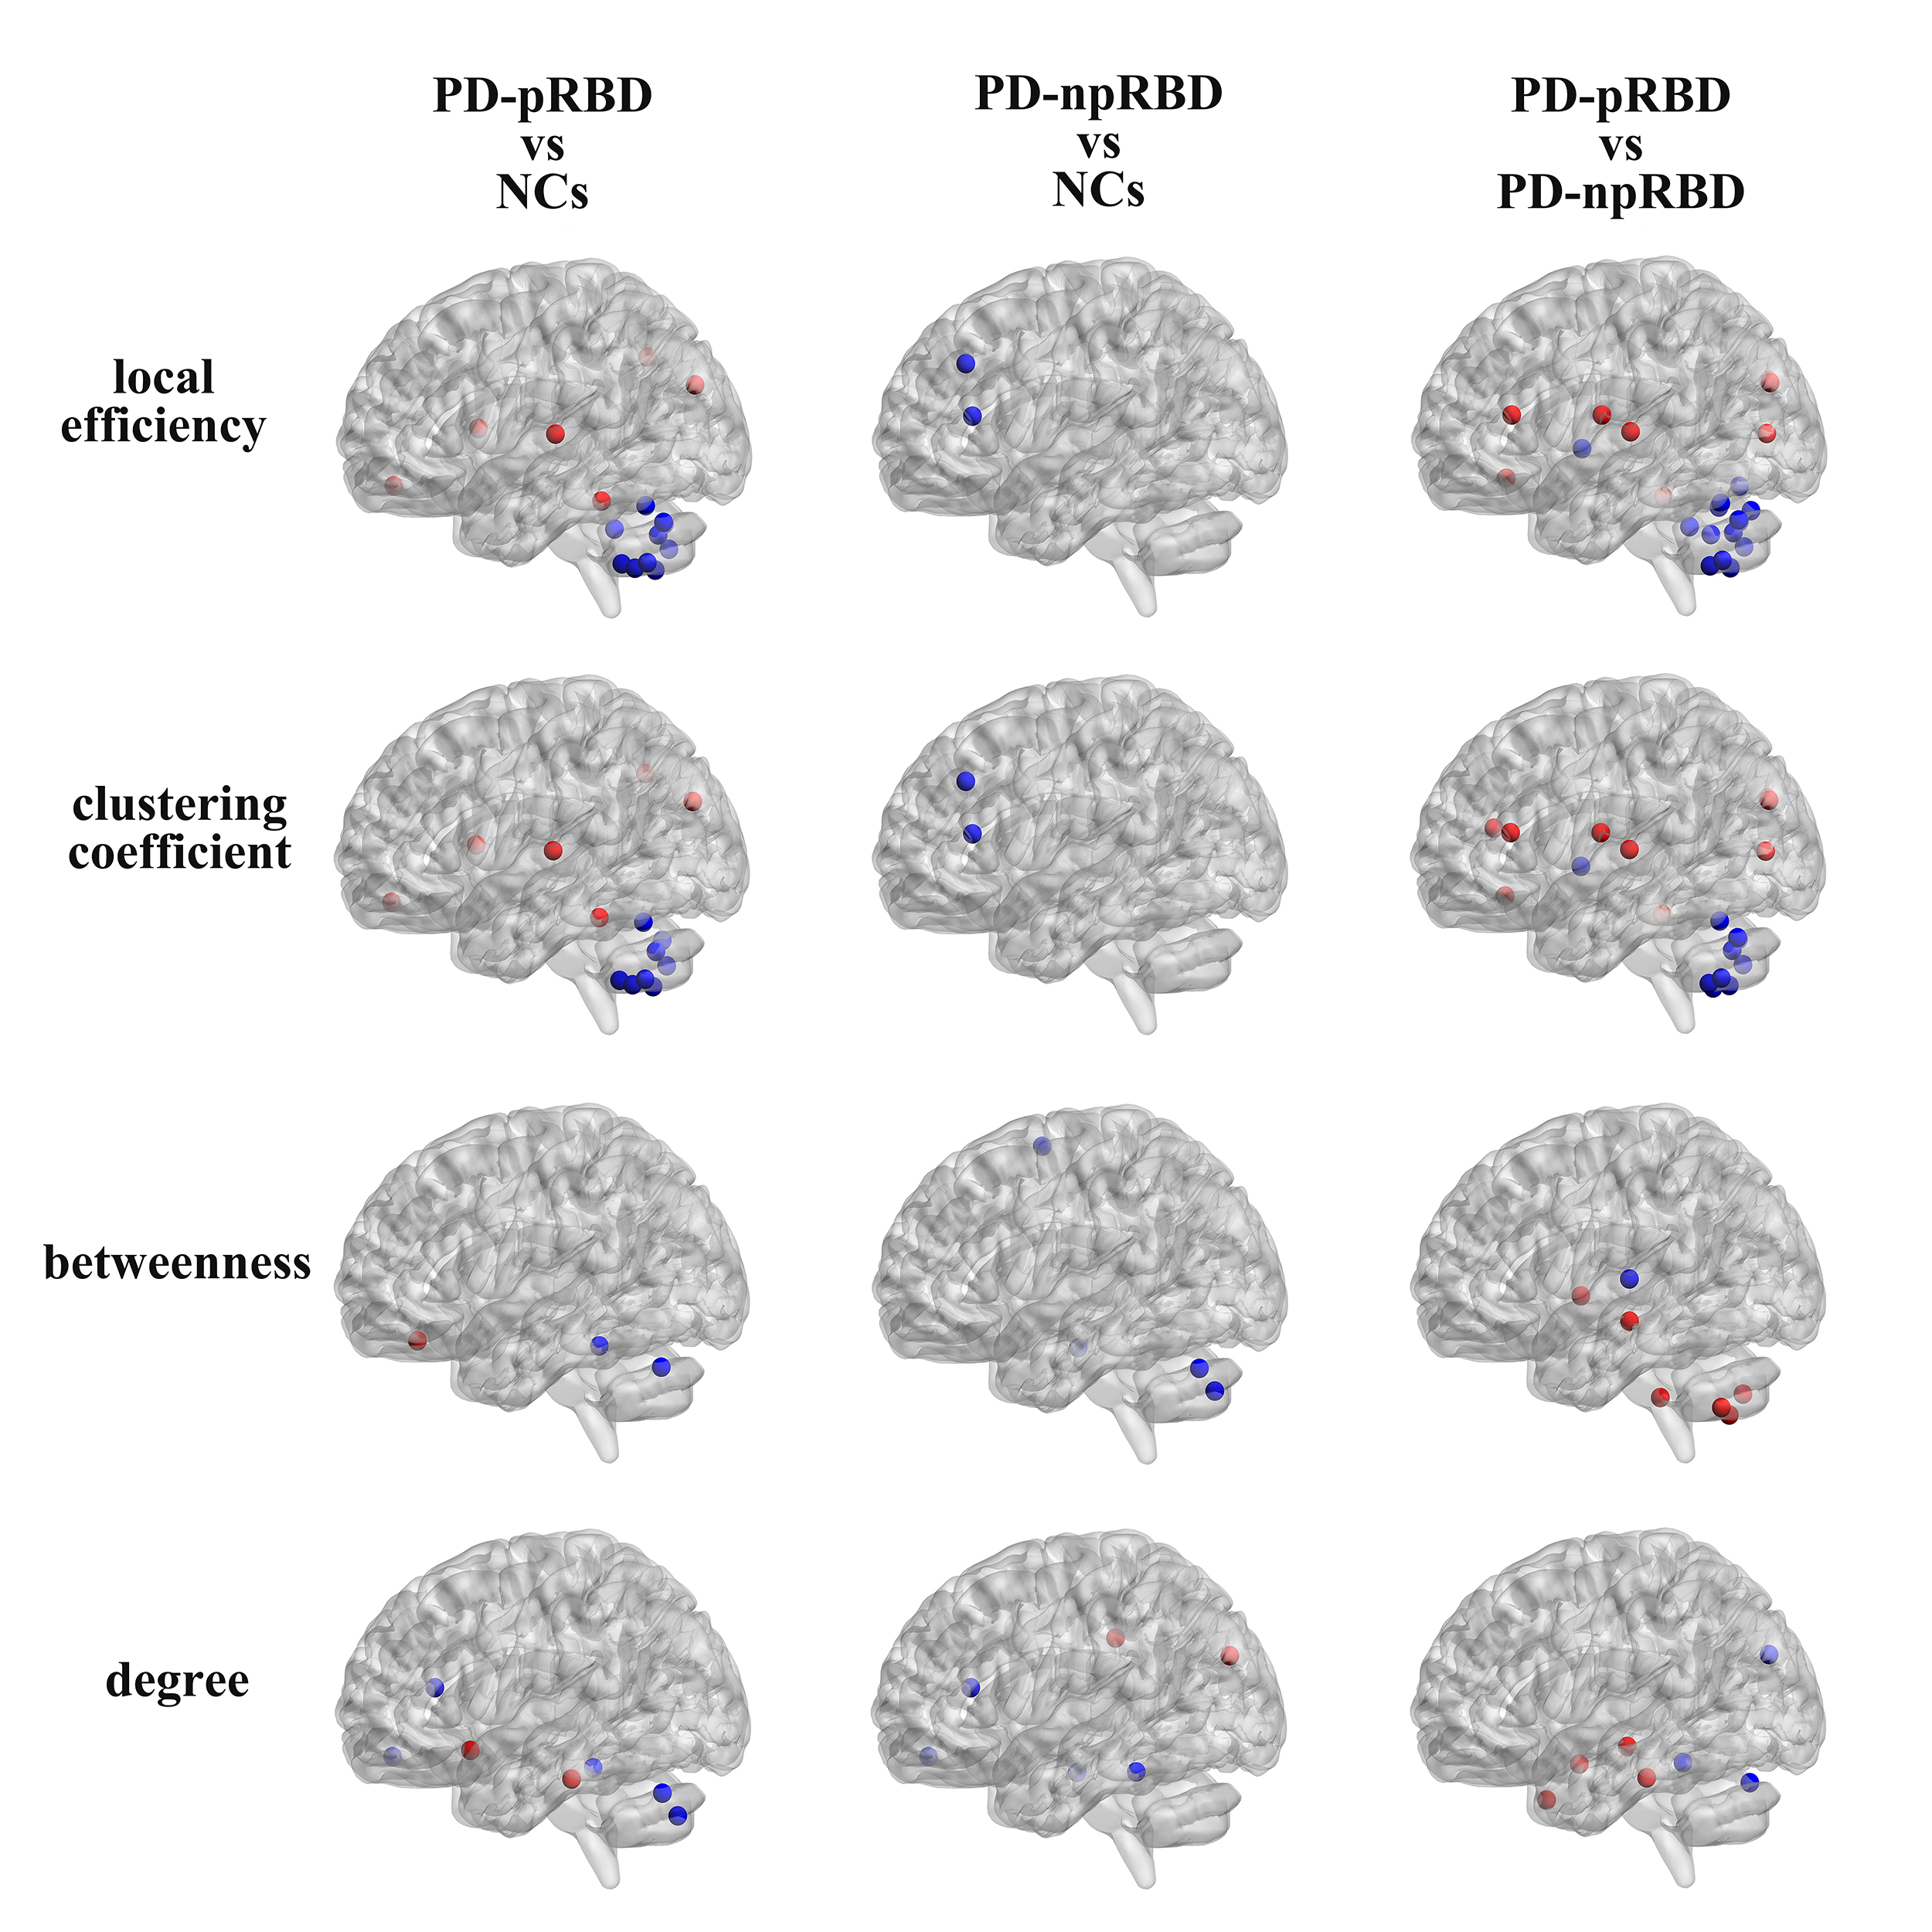
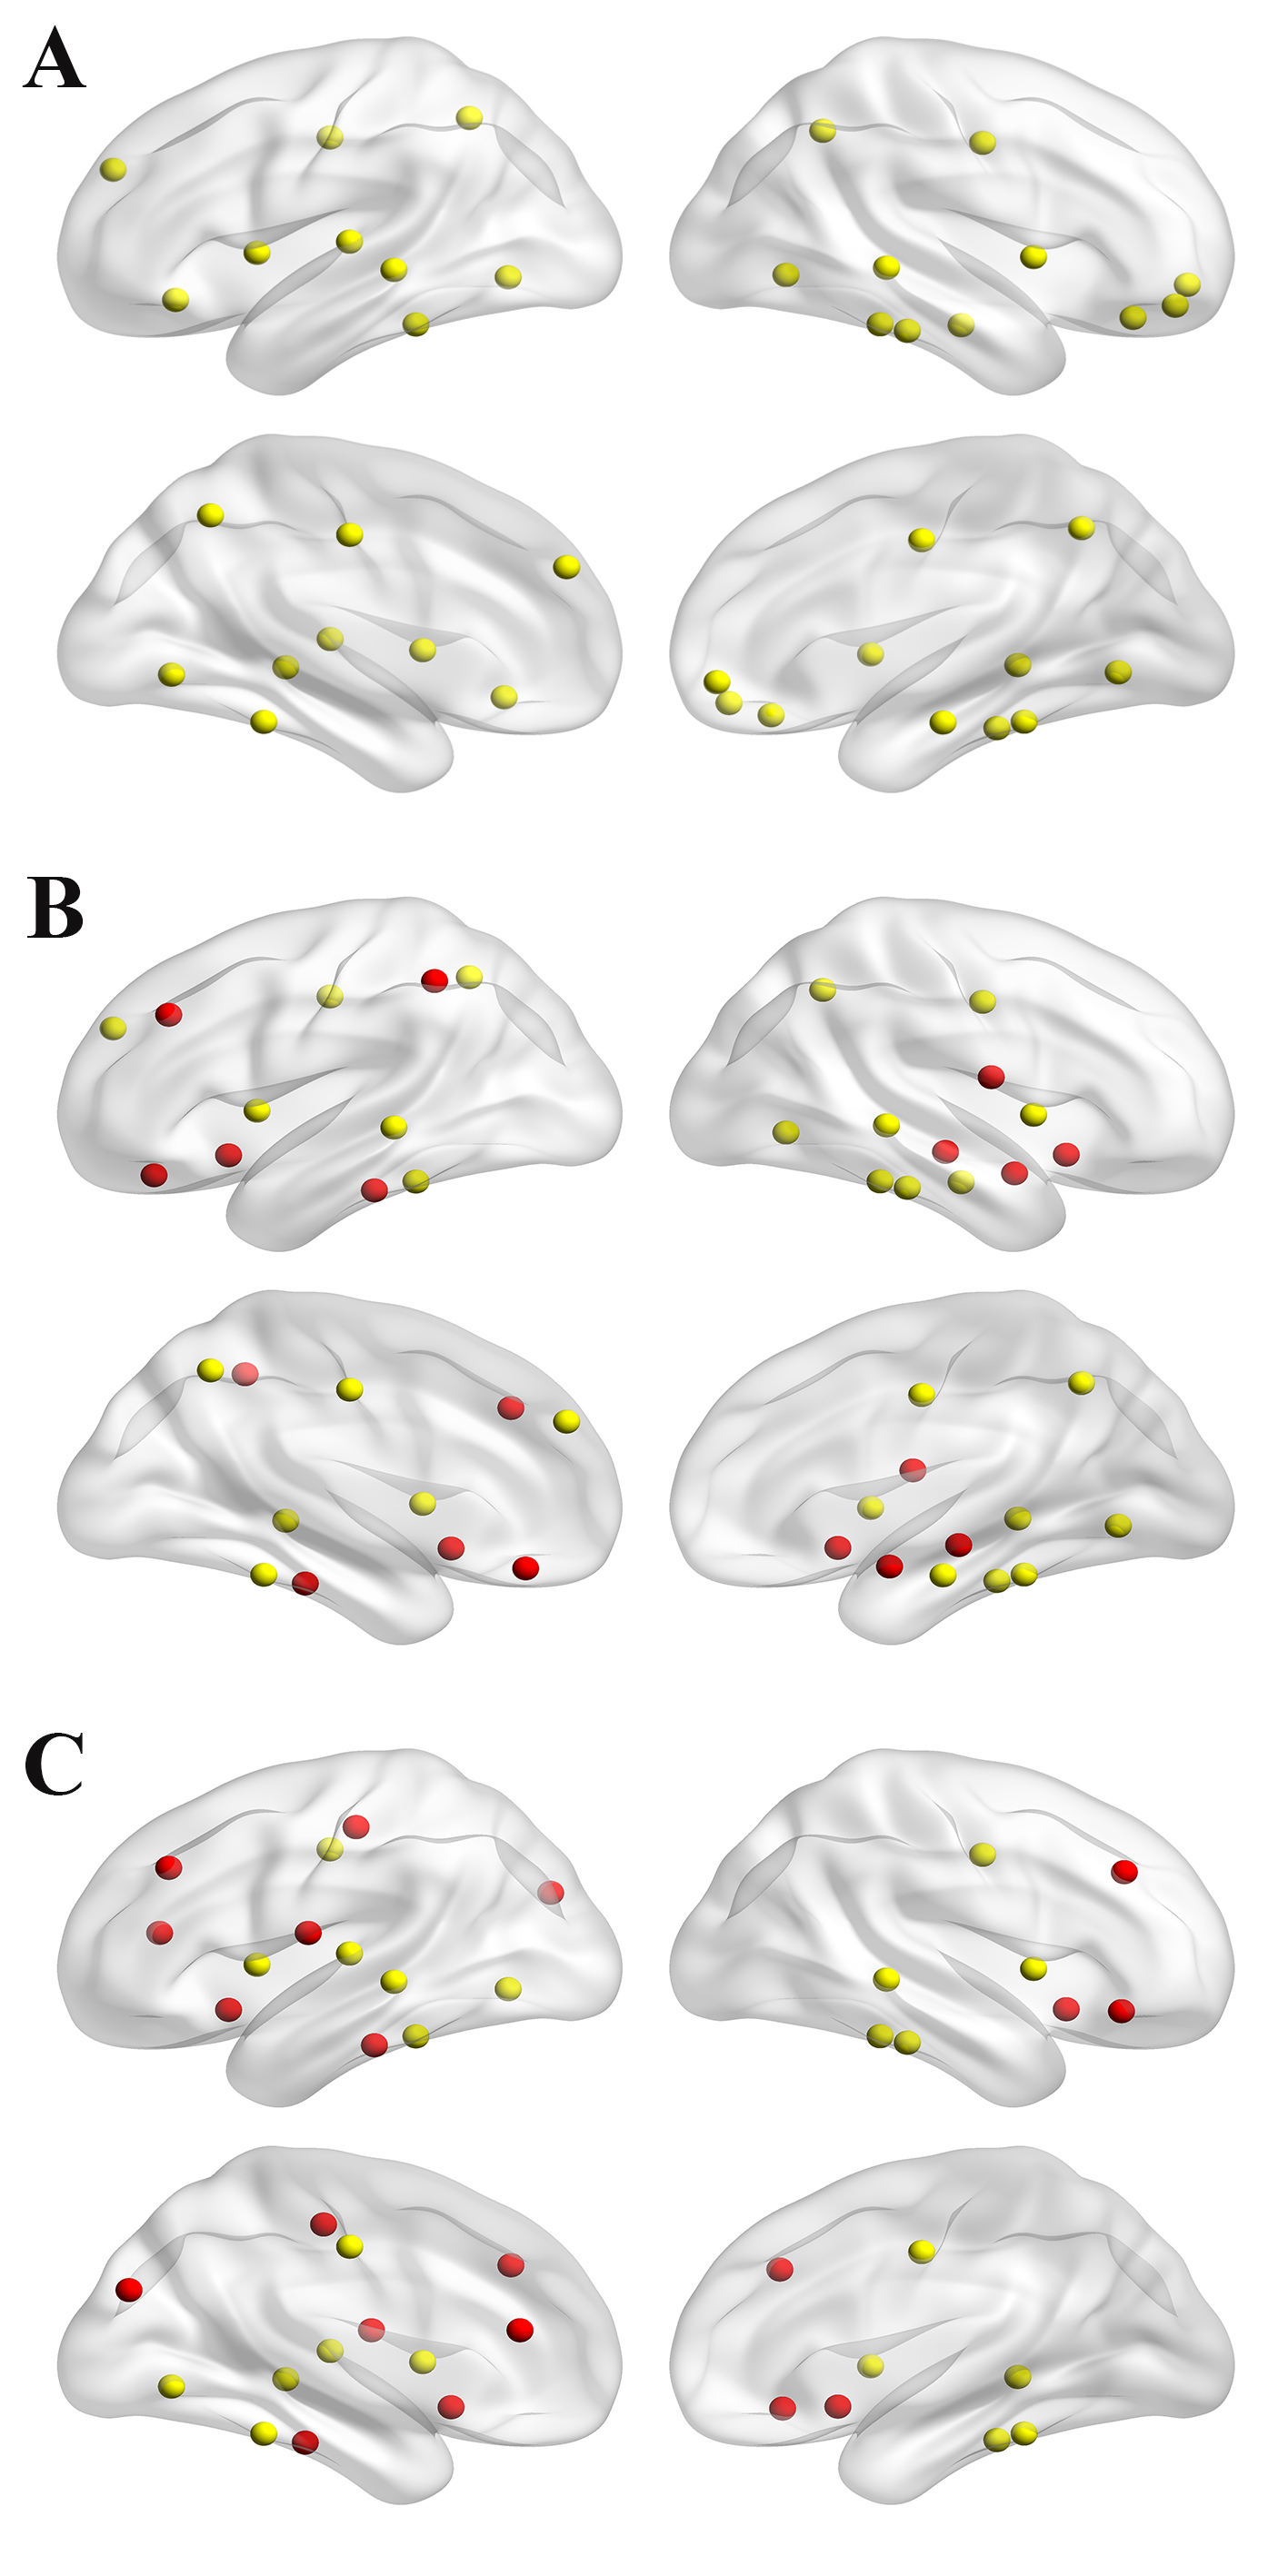
We found that over the density range of 0.1 to 0.5, σ was consistently greater than 1 for structural networks of NCs, PD-npRBD group, PD-pRBD group (Figure 1), which demonstrated that PD-pRBD group, PD-npRBD group and NCs exhibited typical features of small-worldness. Besides, there was no difference in global properties between groups. Interestingly, enhanced nodal properties in limbic system, occipital regions and frontal-temporal regions were observed in PD-pRBD while decreased nodal parameters in cerebellum were found in PD-pRBD (Figure 2). Moreover, we found significant increased hub in limbic system and inferior parietal in PD-pRBD (Figure 3).Discussion
In this study, we applied graph theoretical analyses to compare gray matter volume correlation networks of two PD groups (PD-pRBD and PD-npRBD) and controls, which would be helpful to make out the potential neural substrates of PD-pRBD. we found both PD-pRBD group, PD-npRBD group and controls group exhibited typical features of small-worldness, and there was no difference between any two groups in global network measures, which indicated that both two PD groups still keep a relatively integrated global function including abilities for information processing within and across anatomically interconnected brain regions. The reason for the reserved small world architectures maybe that our PD patients were at a relatively early stage, the mean Hoehn and Yahr stage was 1.6.
Interestingly, we found significantly increased nodal properties in some regions including frontal-temporal regions, occipital lobe regions, and limbic regions. And hubs that were most notably altered in PD-pRBD were located in limbic system areas such as hippocampus and amygdala. Several studies exhibited increased gray mater densities in both hippocampi and the adjacent parahippocampal gyrus, and also found hypermatabolism in hippocampus8, 9. Both these studies would fit the result of increased nodal properties and recruitment of hubs in limbic system in our study. Combined increased nodal parameters and recruitment of hubs in limbic system regions, we speculate that limbic system may play a compensate role in the pathophysiological of PD-RBD. Besides, clinically PD patients expressing RBD tend to have an association with visual hallucination6, which may be due to the abnormal activation of visual cortical. In our study, we found increased nodal parameters in occipital regions, which is support the activation of visual cortical. And the increased nodal properties in frontal-temporal regions may balance the degeneration in other regions.
In addition, significantly reduced nodal parameters in cerebellum were observed in PD-pRBD, which is in line with the finding of decreased regional cerebral blood flow in cerebellar hemispheres observed by Hanyu H et al10. Our research may provide new insight to understand the role of cerebellum in the pathophysiology of PD patients with RBD.
Conclusion
The increased nodal properties and the remapping of the hub distribution in limbic system as well as the disturbance of cerebellum in PD-pRBD should come into our notice to investigate the pathophysiology of RBD in PD patients in a specific perspective.Acknowledgements
This work was supported by the 13th Five-year Plan for National Key Research and Development Program of China (No.2016YFC1306600).The authors acknowledge the whole staff of the Parkinson’s Progression Markers Initiative (PPMI) database.References
1. Olson EJ, Boeve BF, Silber MH. Rapid eye movement sleep behaviour disorder: demographic, clinical and laboratory findings in 93 cases. Brain 2000;123 ( Pt 2):331-339.
2. Schenck CH, Mahowald MW. REM sleep behavior disorder: clinical, developmental, and neuroscience perspectives 16 years after its formal identification in SLEEP. Sleep 2002;25(2):120-138.
3. Gagnon JF, Bedard MA, Fantini ML, et al. REM sleep behavior disorder and REM sleep without atonia in Parkinson's disease. Neurology 2002;59(4):585-589.
4. Sudarsky L, Friedman J. REM sleep behavior disorder: a possible early marker for synucleinopathies. Neurology 2006;67(11):2090; author reply 2090-2091.
5. Iranzo A, Molinuevo JL, Santamaria J, et al. Rapid-eye-movement sleep behaviour disorder as an early marker for a neurodegenerative disorder: a descriptive study. Lancet Neurol 2006;5(7):572-577.
6. Sinforiani E, Pacchetti C, Zangaglia R, Pasotti C, Manni R, Nappi G. REM behavior disorder, hallucinations and cognitive impairment in Parkinson's disease: a two-year follow up. Mov Disord 2008;23(10):1441-1445.
7. Postuma RB, Bertrand JA, Montplaisir J, et al. Rapid eye movement sleep behavior disorder and risk of dementia in Parkinson's disease: a prospective study. Mov Disord 2012;27(6):720-726.
8. Scherfler C, Frauscher B, Schocke M, et al. White and gray matter abnormalities in idiopathic rapid eye movement sleep behavior disorder: a diffusion-tensor imaging and voxel-based morphometry study. Ann Neurol 2011;69(2):400-407.
9. Mazza S, Soucy JP, Gravel P, et al. Assessing whole brain perfusion changes in patients with REM sleep behavior disorder. Neurology 2006;67(9):1618-1622.
10. Hanyu H, Inoue Y, Sakurai H, et al. Regional cerebral blood flow changes in patients with idiopathic REM sleep behavior disorder. Eur J Neurol 2011;18(5):784-788.
Figures