3635
Concurrent assessment of perfusion and functional connectivity in Parkinson’s disease1Fondazione Don Carlo Gnocchi ONLUS, Milan, Italy, 2Department of Electronics, Information and Bioengineering, Politecnico di Milano, Milan, Italy, 3Buffalo Neuroimaging Analysis Center, Department of Neurology, School of Medicine and Biomedical Sciences, University at Buffalo, State University of New York, Buffalo, NY, United States, 4Università degli Studi di Milano, Milan, Italy, 5Radiology, Fondazione Don Carlo Gnocchi ONLUS, Milan, Italy
Synopsis
We aimed to assess if resting state functional connectivity (FC) changes were related to hypoperfusion in a group of Parkinson’s disease (PD) patients. Independent component analysis was performed to identify common spatial patterns of FC and of arterial spin labeling perfusion separately, in the whole group of PD and healthy controls. Concurrent FC and perfusion group differences were assessed. The observed FC alteration in the visual network may be influenced by the significantly reduced cerebral blood flow in the lateral occipital cortex, and vice-versa. The cross-talk between functional and perfusion findings should be considered when interpreting the results.
INTRODUCTION
Progressive cortical hypometabolism and hypoperfusion in lateral and medial parieto-occipital cortices of Parkinson’s disease (PD) were extensively reported even at early disease stages, using fludeoxyglucose PET and SPECT.1,2 Decreased perfusion patterns in PD were recently non-invasively observed also with arterial spin labeling (ASL) MRI.3 In addition to perfusion alterations, resting state functional MRI (rsfMRI) studies have shown reduced functional connectivity (FC) in sensori-motor and visual areas in these patients population.4,5 However, since rsfMRI is an hemodynamic-driven technique (based on BOLD signal), a cross-talk between functional and perfusion alteration results may exist. In this study, we aimed to assess if functional changes detected with rsfMRI in a group of PD patients were related to hypoperfusion.METHODS
Twenty-six PD patients (mean age= 67.31±8.46years, 4 females) and eighteen age- and sex-matched healthy controls (HC) (mean age= 65.50±8.19years, 7 females) were imaged on a 1.5 Siemens scanner. The acquisition protocol included: a high resolution T1-weighted image (TR=1900 ms, TE=3.37 ms, resolution=1×1×1 mm3, 176 axial slices), a multi-echo T2* EPI sequence (TR=2570 ms; TE=15, 34, 54 ms; resolution=3.7×3.75×4.49 mm3; 31 axial slices), and a multi-delay pseudo-continuous ASL with background suppressed 3D GRASE (TR/TE=3500/22.58 ms, labelling duration=1500 ms, 5 post-labelling delays=[700, 1200, 1700, 2200, 2700] ms, 12 pairs of tag/control images for each delay, resolution=3.5x3.5x5 mm3, 32 slices). Multi-echo rsfMRI T2* EPI data preprocessing (i.e. re-alignment, time-series de-spiking and slice time correction) was performed using the AFNI6 tool meica.py.7,8 ASL images were preprocessed (i.e. re-alignment, motion correction, partial volume error correction), and gray matter cerebral blood flow (CBF) maps were computed with oxford_asl FSL tool.9 Then, rsfMRI and ASL preprocessed data were aligned to the corresponding T1-weithted image and registered to MNI standard space with ANTs.10 Independent component analysis (ICA) was performed both on rsfMRI and ASL preprocessed datasets independently, with automatic number of component estimation, using MELODIC FSL tool.11 The independent components (ICs) derived from rsfMRI data (RS-ICs) depicted the resting state networks, while the ICs extracted from CBF maps (CBF-ICs) represented common spatial patterns of perfusion. Reliability of ICs was assessed with Icasso12 (stability index > 0.8). FC voxel-wise group differences were tested in reliable RS-ICs using randomise FSL tool13 (5,000 iterations, Threshold-Free Cluster Enhancement method, family wise error (FWE) correction with threhold=0.05), considering age and sex as covariates. Group differences in CBF-ICs were tested by comparing the CBF-ICs loading factors, indicative of the magnitude of perfusion, with an analysis of covariance (ANCOVA), considering age and sex as covariates. P-values≤0.05 were considered significant. CBF-ICs presenting significant group differences in terms of loading factors were split in anatomically separate clusters of voxels. The clusters overlapping with areas showing significant FC group differences were identified. The overlapping voxels were used as region of interest (ROI), where the mean CBF was computed for all subjects, and group differences were tested with ANCOVA, correcting for age (ROI-based analysis).RESULTS
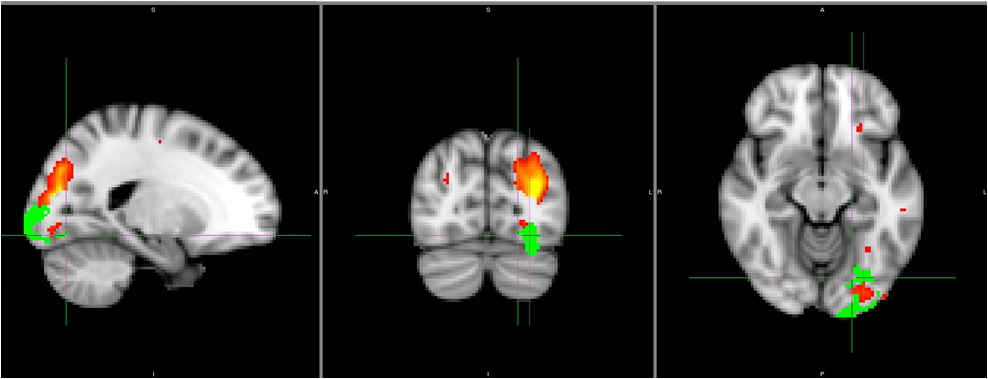
Twenty RS-ICs and 21 CBF-ICs were obtained. Thirteen RS -ICs and all CBF-ICs were classified as stable. PD patients showed areas of significantly reduced FC with respect to HC within RS-IC7 (visual network) and RS-IC11 (sensory-motor network). Significantly lower loading factors were obtained for PD in CBF-IC1 (p=0.02) and CBF-IC17 (p=0.01). CBF-IC1 included lateral occipital cortex, supramarginal, angular and precentral gyri, occipital pole and superior parietal lobule. CBF-IC17 corresponded to insular cortex, precuneous, precentral and postcentral gyri, middle frontal, paracingulate, and superior frontal gyris and lateral occipital cortex. CBF-IC1 overlapped partially in areas where PD showed significantly reduced FC (Figure 1). Specifically, this overlap was in the lateral occipital cortex, and the extracted CBF showed significant (p=0.02) group differences (mean±standard deviation of HC: 46.52±14.05 ml/100 g/min; of PD: 37.24±14.47 ml/100 g/min).DISCUSSION
The observed significantly reduced FC in visual and sensory motor networks in PD is in line with literature.5 Furthermore, the areas of decreased perfusion are comparable with the one obtained in a previous study that tested differences of CBF patterns in PD with principal component analysis.3 Our work showed the importance of estimating perfusion in rsfMRI studies. In fact, the observed FC alteration in the visual network may be influenced by the significantly reduced CBF in the lateral occipital cortex, or vice-versa. On the other hand, the functional alteration reported in the sensory motor network seemed not to be ascribed to a possible cross-talk with a reduced blood supply of the involved cortical regions.CONCLUSION
Acquiring ASL MRI in combination with rsfMRI could allow to identify cases of FC changes potentially influenced by perfusion cross-talk and vice-versa. This cross-talk should be considered when interpreting the results.Acknowledgements
This study was in part funded by a grant awarded by the Annette Funicello Research Fund for Neurological Diseases.
Prof. Danny JJ Wang (UCLA, CA, USA) provided us with the pCASL sequence.
References
1. Borghammer P, Chakravarty M, Jonsdottir KY, Sato N, Matsuda H, Ito K, Arahata Y, Kato T, Gjedde A. Cortical hypometabolism and hypoperfusion in Parkinson’s disease is extensive: probably even at early disease stages. Brain Structure and Function. 2010;214(4):303-17.
2. Bohnen NI, Koeppe RA, Minoshima S, Giordani B, Albin RL, Frey KA, Kuhl DE. Cerebral glucose metabolic features of Parkinson disease and incident dementia: longitudinal study. Journal of Nuclear Medicine. 2011;52(6):848-55.
3. Melzer TR, Watts R, MacAskill MR, Pearson JF, Rüeger S, Pitcher TL, Livingston L, Graham C, Keenan R, Shankaranarayanan A, Alsop DC. Arterial spin labelling reveals an abnormal cerebral perfusion pattern in Parkinson’s disease. Brain. 2011;134(3):845-55.
4. Wu T, Wang L, Chen Y, Zhao C, Li K, Chan P. Changes of functional connectivity of the motor network in the resting state in Parkinson's disease. Neuroscience letters. 2009;460(1):6-10.
5. Hacker CD, Perlmutter JS, Criswell SR, Ances BM, Snyder AZ. Resting state functional connectivity of the striatum in Parkinson’s disease. Brain. 2012;135(12):3699-711.
6. Cox RW. AFNI: software for analysis and visualization of functional magnetic resonance neuroimages. Computers and Biomedical research. 1996;29(3):162-73.
7. Kundu P, Brenowitz ND, Voon V, et al. Integrated strategy for improving functional connectivity mapping using multiecho fMRI. Proceedings of the National Academy of Sciences of the United States of America. 2013;110(40):16187–92.
8. Kundu P, Santin MD, Bandettini PA, et al. Differentiating BOLD and non-BOLD signals in fMRI time series from anesthetized rats using multi-echo EPI at 11.7 T. NeuroImage. 2014;102:861–74.
9. Chappell MA, Groves AR, Whitcher B, Woolrich MW. Variational Bayesian inference for a nonlinear forward model. IEEE Transactions on Signal Processing. 2009;57(1):223-36.
10. Avants BB, Tustison N, Song G. Advanced normalization tools (ANTS). Insight j. 2009;2:1-35.
11. Beckmann, C.F. and S.M. Smith, Probabilistic independent component analysis for functional magnetic resonance imaging. IEEE Trans Med Imaging. 2004. 23(2): p. 137-52.
12. Himberg J, Hyvarinen A. Icasso: software for investigating the reliability of ICA estimates by clustering and visualization. InNeural Networks for Signal Processing, 2003. NNSP'03. 2003 IEEE 13th Workshop on 2003 Sep 17 (pp. 259-268). IEEE.
13. Winkler AM, Ridgway GR, Webster MA, Smith SM, Nichols TE. Permutation inference for the general linear model. Neuroimage. 2014;92:381-97.
Figures