3634
Investigating differences in laterality and novel diffusion-derived metrics between freezing of gait (FOG) and non-FOG early Parkinson’s disease patients1Imaging, Cleveland Clinic Lou Ruvo Center for Brain Health, Las Vegas, NV, United States
Synopsis
In this study, we utilized the diffusion MRI (
Introduction
Freezing of gait (FOG) is a brief, episodic absence or reduction of forward progression of the feet despite the intention to walk, most commonly seen in advanced Parkinson’s disease (PD) patients1. Studies with diffusion-weighted magnetic resonance imaging (dMRI) have demonstrated reduced structural connectivity of pedunculopontine nucleus (PPN) within the mesencephalic locomotor region (MLR) of the right hemispheres of PD-FOG patients2. However, the neurological correlates of these freezing episodes are still unclear in early PD patients. We used dMRI data of PD patients from Parkinson’s Progressive Markers Initiative (PPMI) database to investigate whether hemispheric laterality3 exists in early PD-FOG patients. Furthermore, we also explored the association of disease duration and severity with the diffusion-derived metrics of the 13 cortical and subcortical regions that were previously reported to investigate freezing of gait4. Both conventional and novel metrics such as fractional anisotropy (FA), free-water fraction (fiso) that was shown to be a biomarker to distinguish various PD patients5, and recently proposed weighted FA (FAwt)6 were evaluated.Methods
Subjects: Self-reported freezing from PPMI database was employed, and only those patients that have dMRI data for at least four-time points was used. To reduce noise variance due to different scanners, only data from 3T Siemens scanner was used. This criterion yielded 47 PD-FOG patients. dMRI dataset of each PD patient were corrected for eddy-current distortions using FSL, and the average motion across diffusion directions was calculated. Only those patients with less than a voxel movement (on an average) were used and only data from the first visit was used in this study. Imaging parameters are described at http://www.ppmi-info.org7. Only 7 PD-FOG patients (1 female (F), age=66.86±5.33years, years of education (YOE) =16.57±2.23, disease duration=6.78±4.89 months, UPDRS score=24.57±13.64) had less than a voxel movement across different diffusion encoding directions. 7 PD-nonFOG patients (1F, age=67.41±7.86years, YOE=15±2.94, disease duration=9.98±7.99 months, UPDRS score=20.43±3.59) matched for the demographics were randomly selected from the motion corrected database. Patients in each group were scanned across the same five different scanner sites. Conventional tensor fitting: Single tensor was fitted for every subject using FSL and a voxel-wise estimate of FA was calculated. Deterministic tracking: Whole brain tractography was performed using diffusion toolkit8. 13 bilateral cortical and subcortical regions of interest (ROI) in MNI space were registered to each subject’s native diffusion space using FSL. The ROIs were expanded by four voxels9 and only those fibre tracts having their ends in either ROIs were retained. Each connection was weighted by the product of number of fibres and average FA of fibres connecting the ROIs and normalized by average fibre tract length. Estimation of fiso and FAwt: Since all 13 ROIs have a significant proportion of crossing-fibre tracts, an algorithm to estimate unbiased fiso and FAwt from clinical dMRI datasets was used to estimate these novel diffusion-derived metrics6. Laterality analysis: A laterality index10 was calculated for each ROI and a parametric ranksum was performed to test for significance of laterality. Cohen’s d was also calculated to estimate the effect size of laterality between PD-FOG and PD-nonFOG patients. Regression analysis: Mean FA, FAwt, and fiso were extracted for each ROI for every patient and was compared for statistical difference using PALM11. Furthermore, the values were regressed against UPDRS scores and disease duration to evaluate their effects on regional white matter abnormality. All statistical tests were performed correcting for the effect of age, gender, YOE, total intracranial volume, site, and handedness.Results
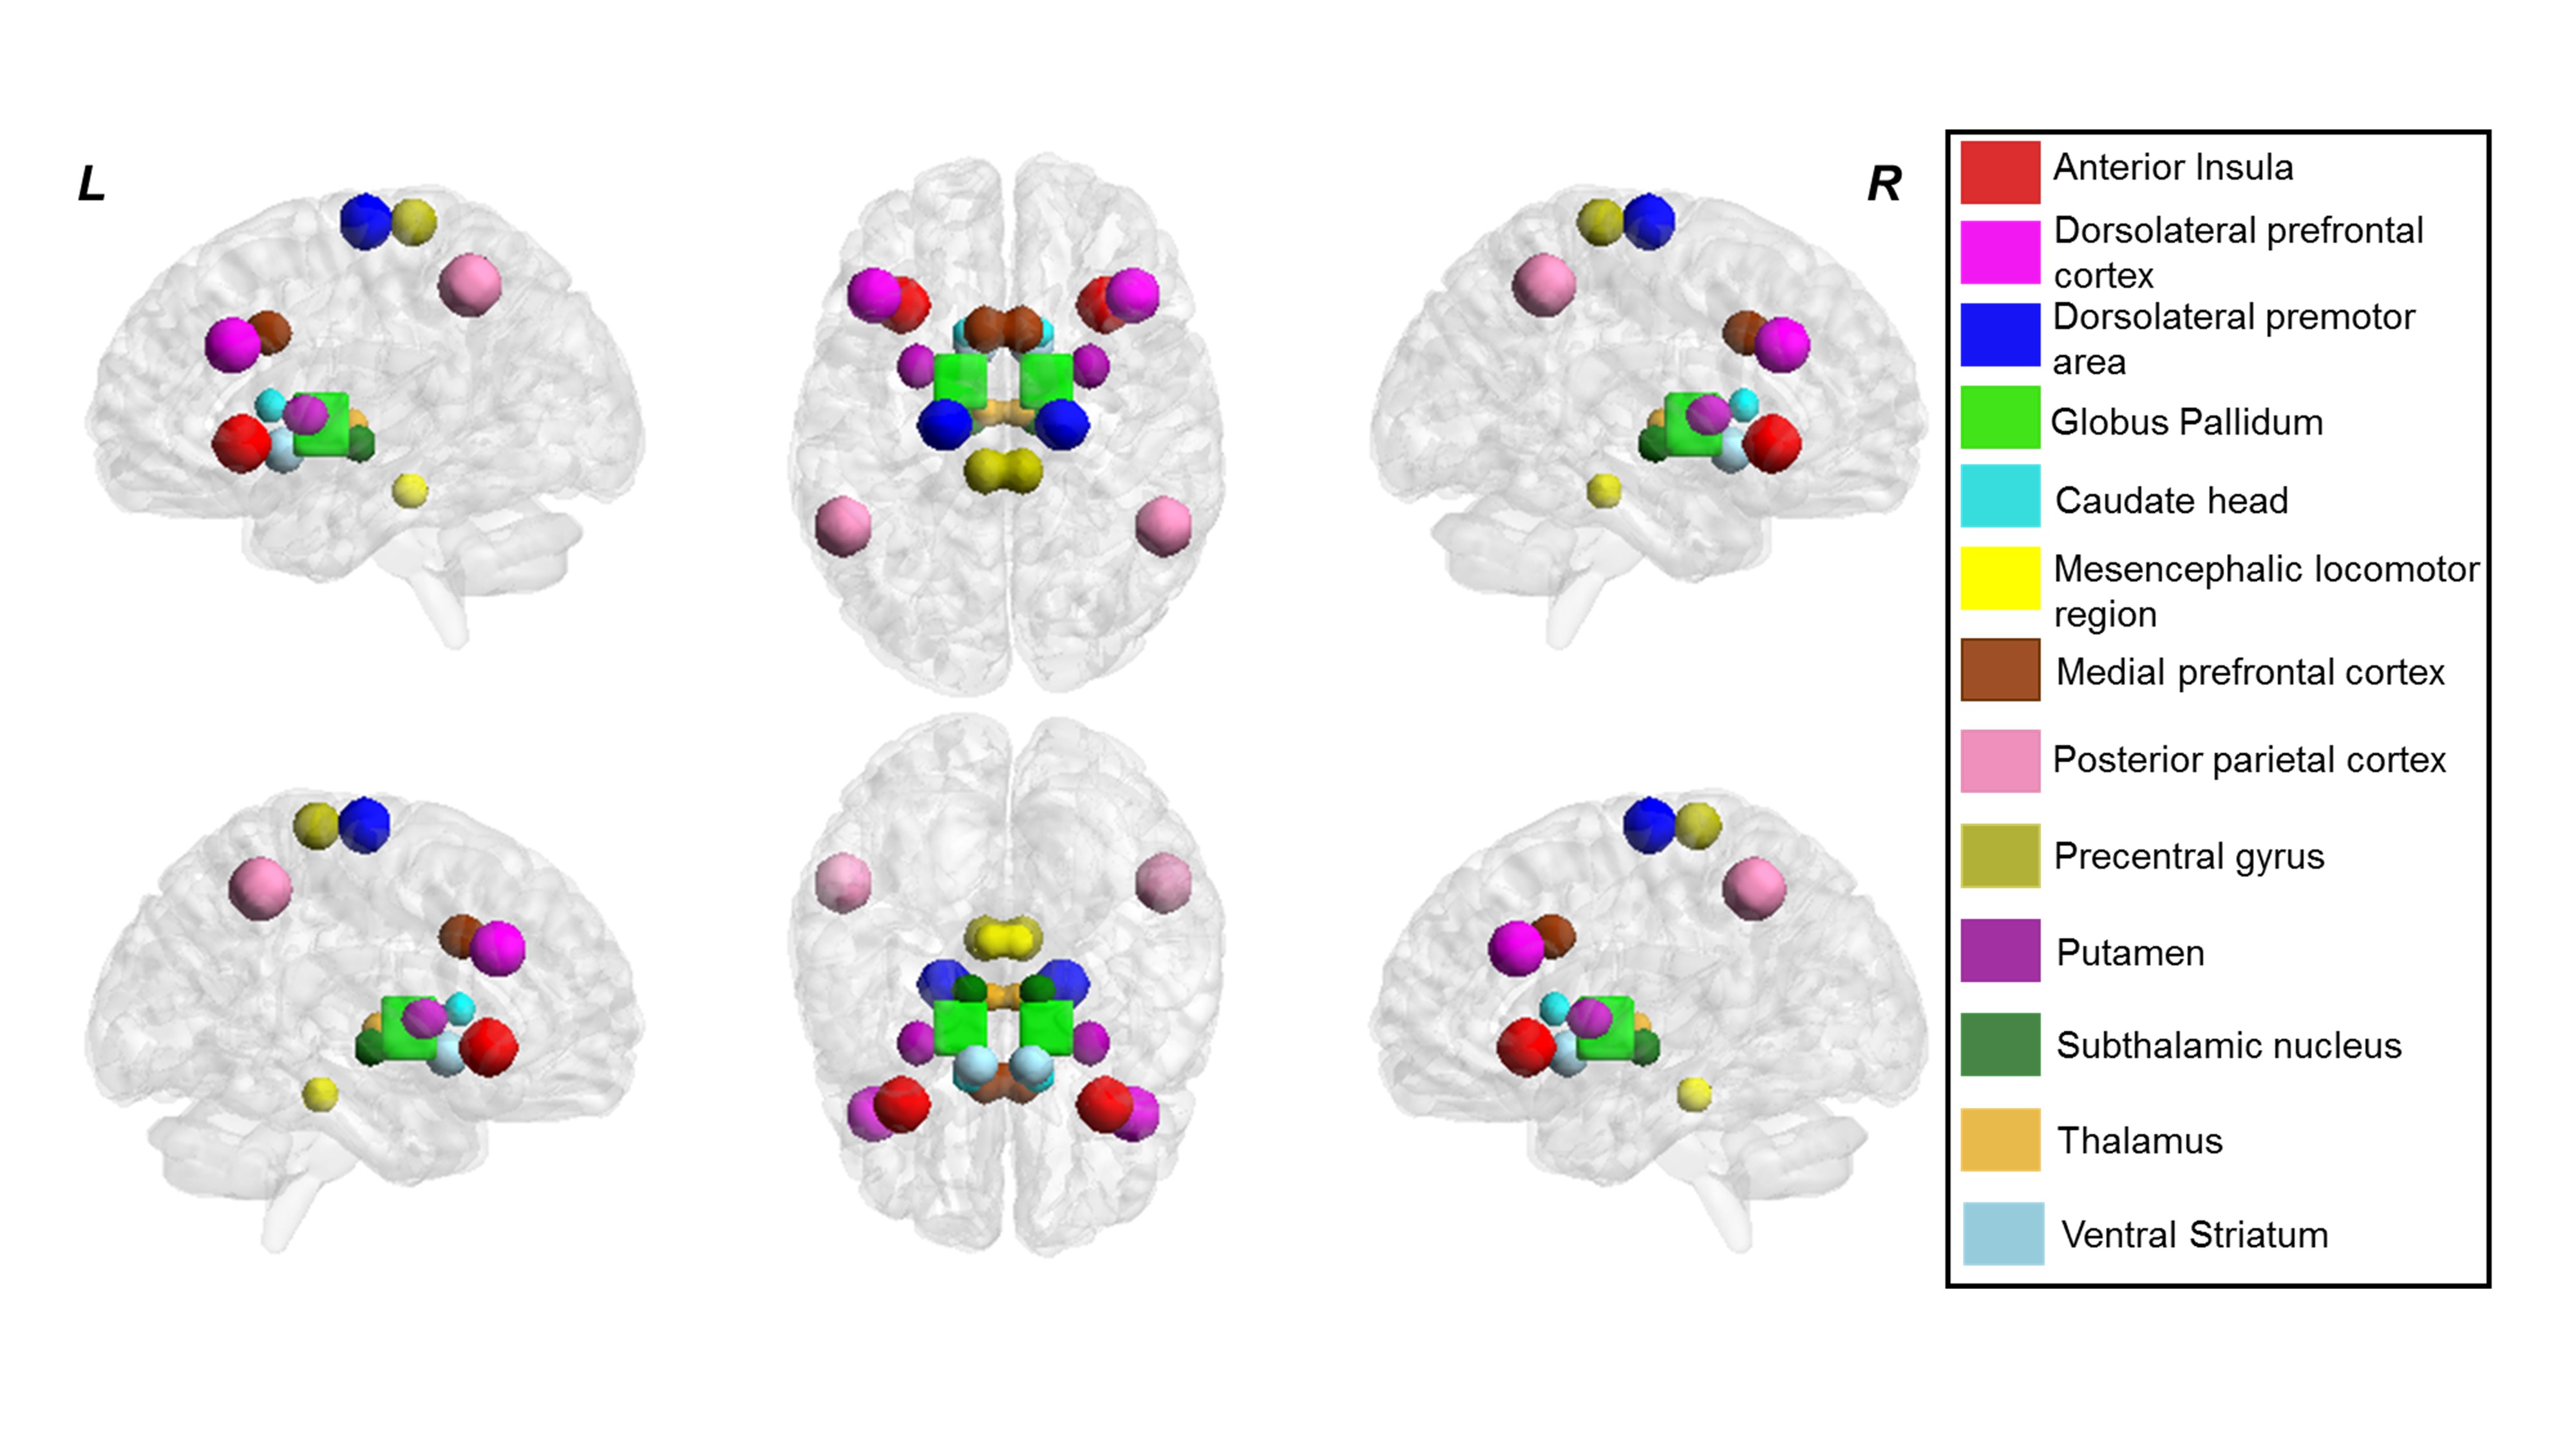
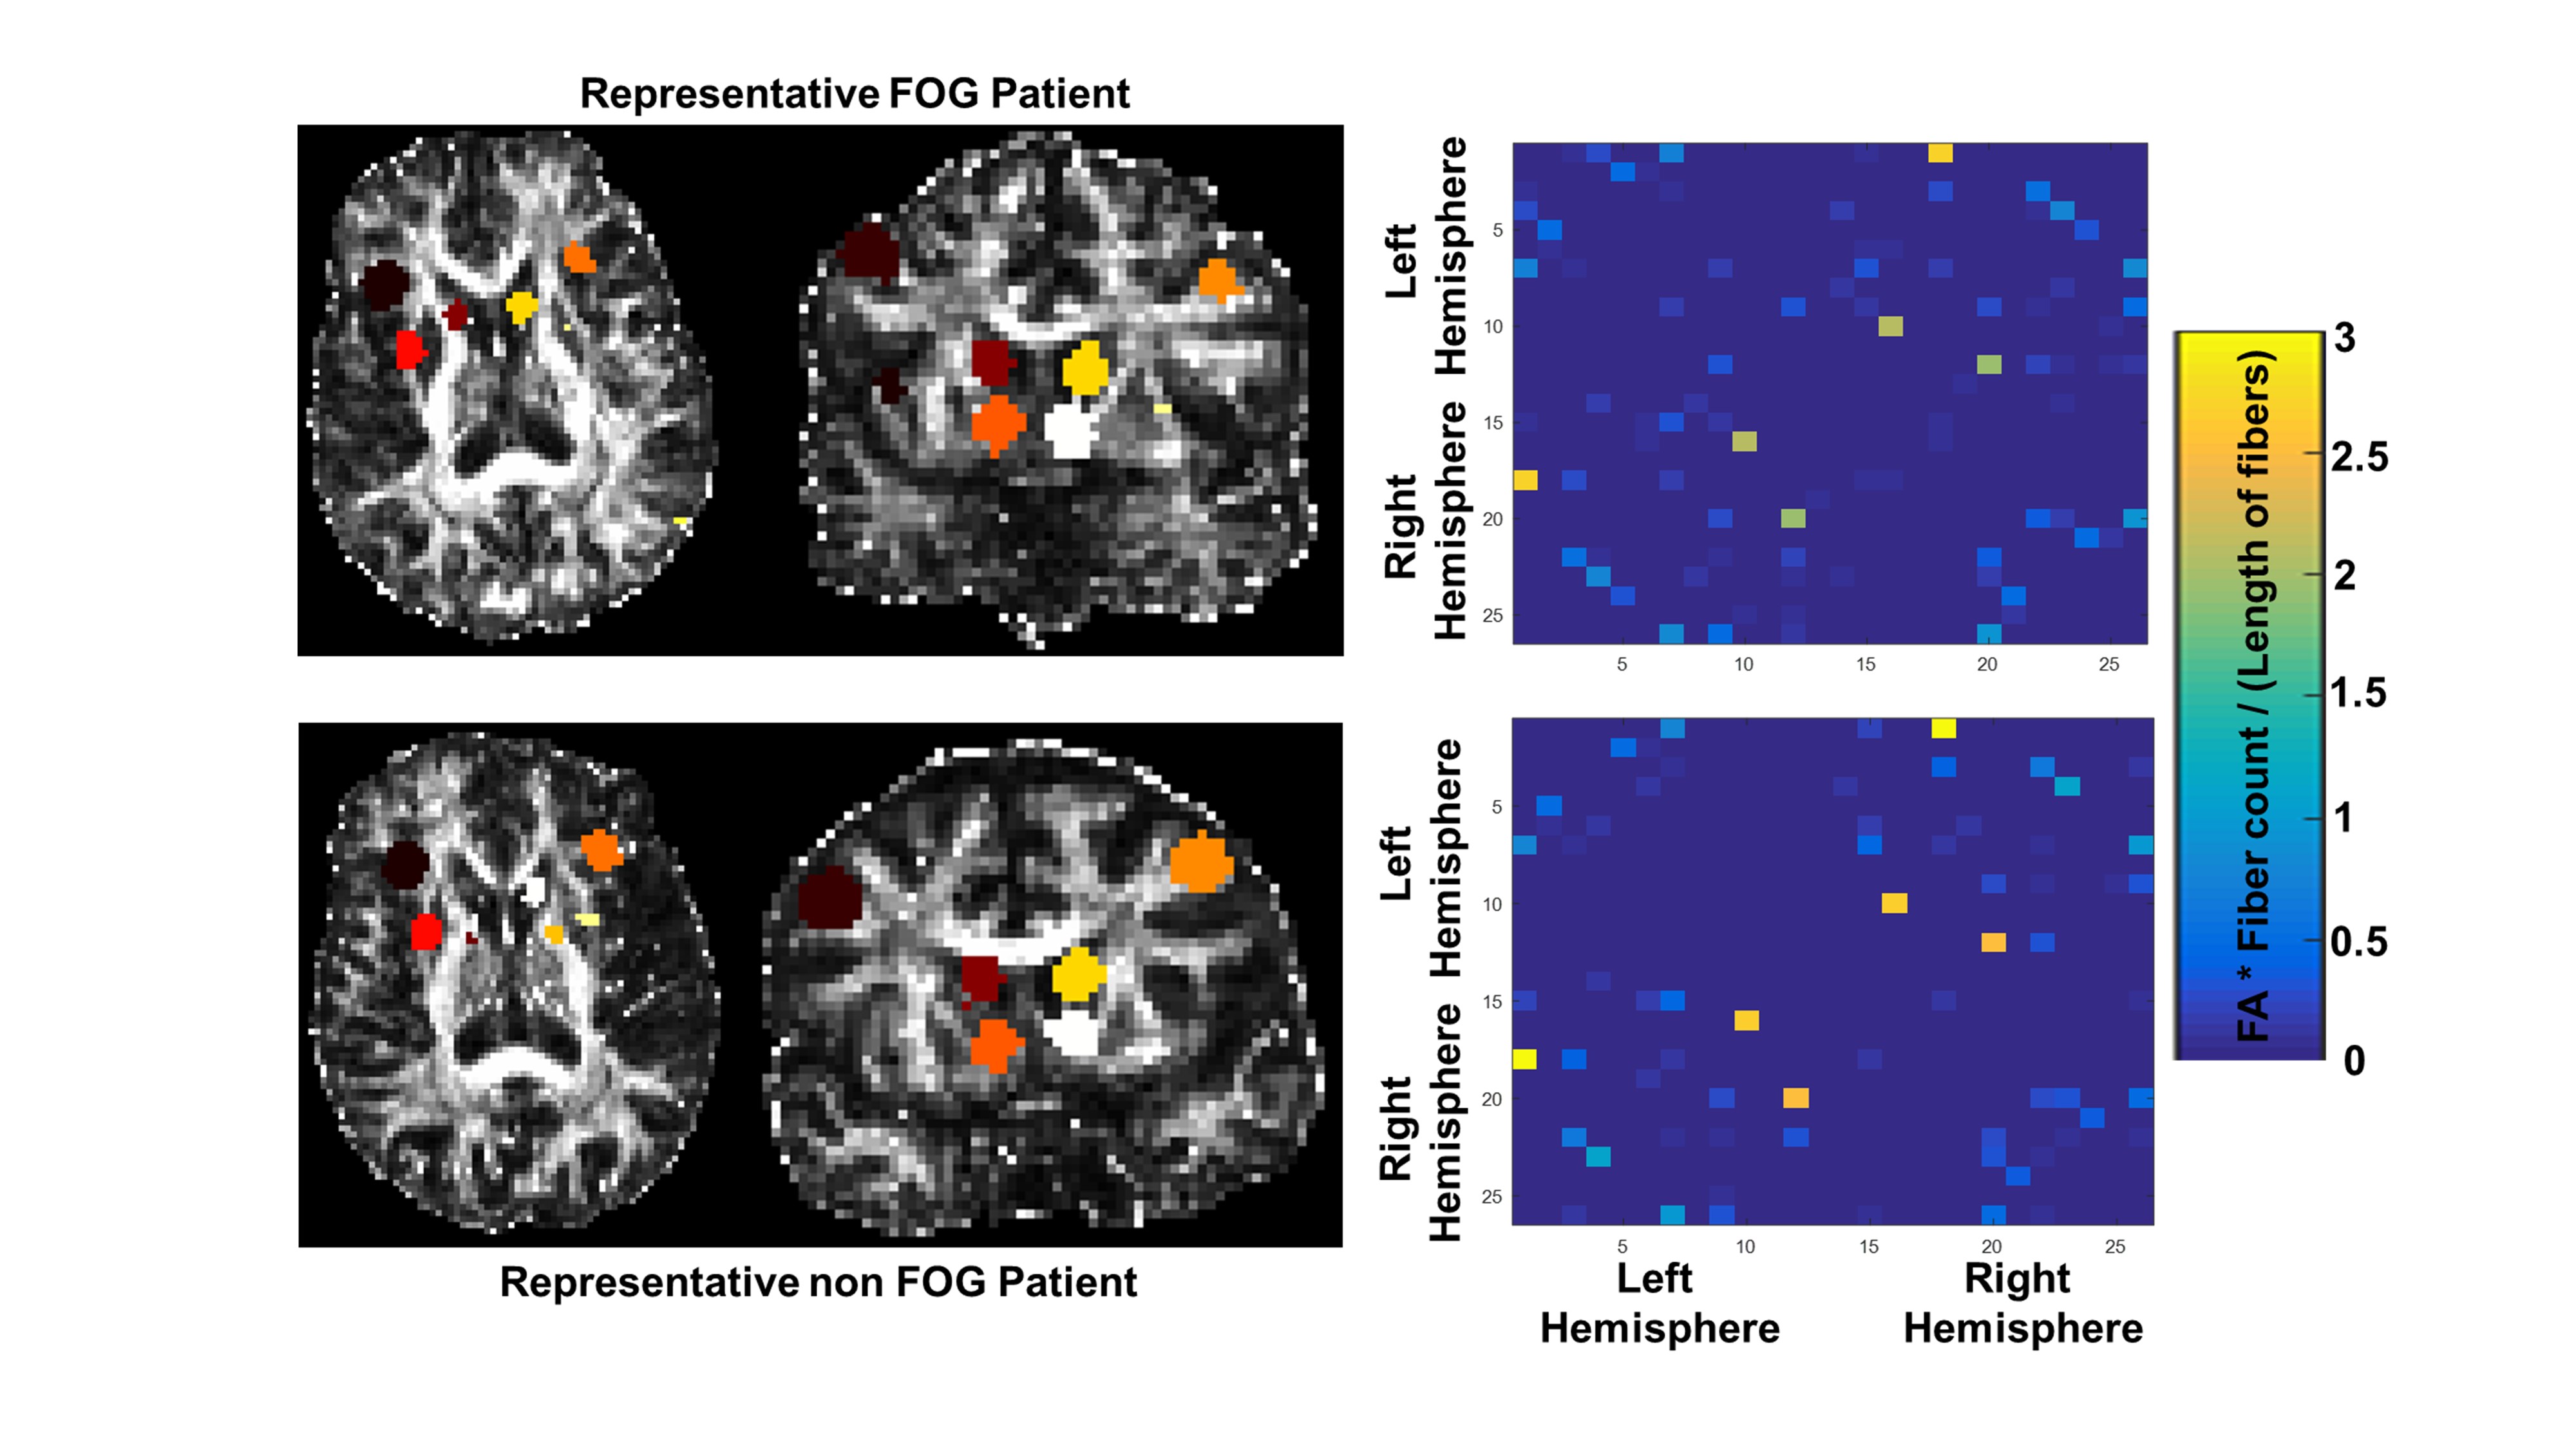
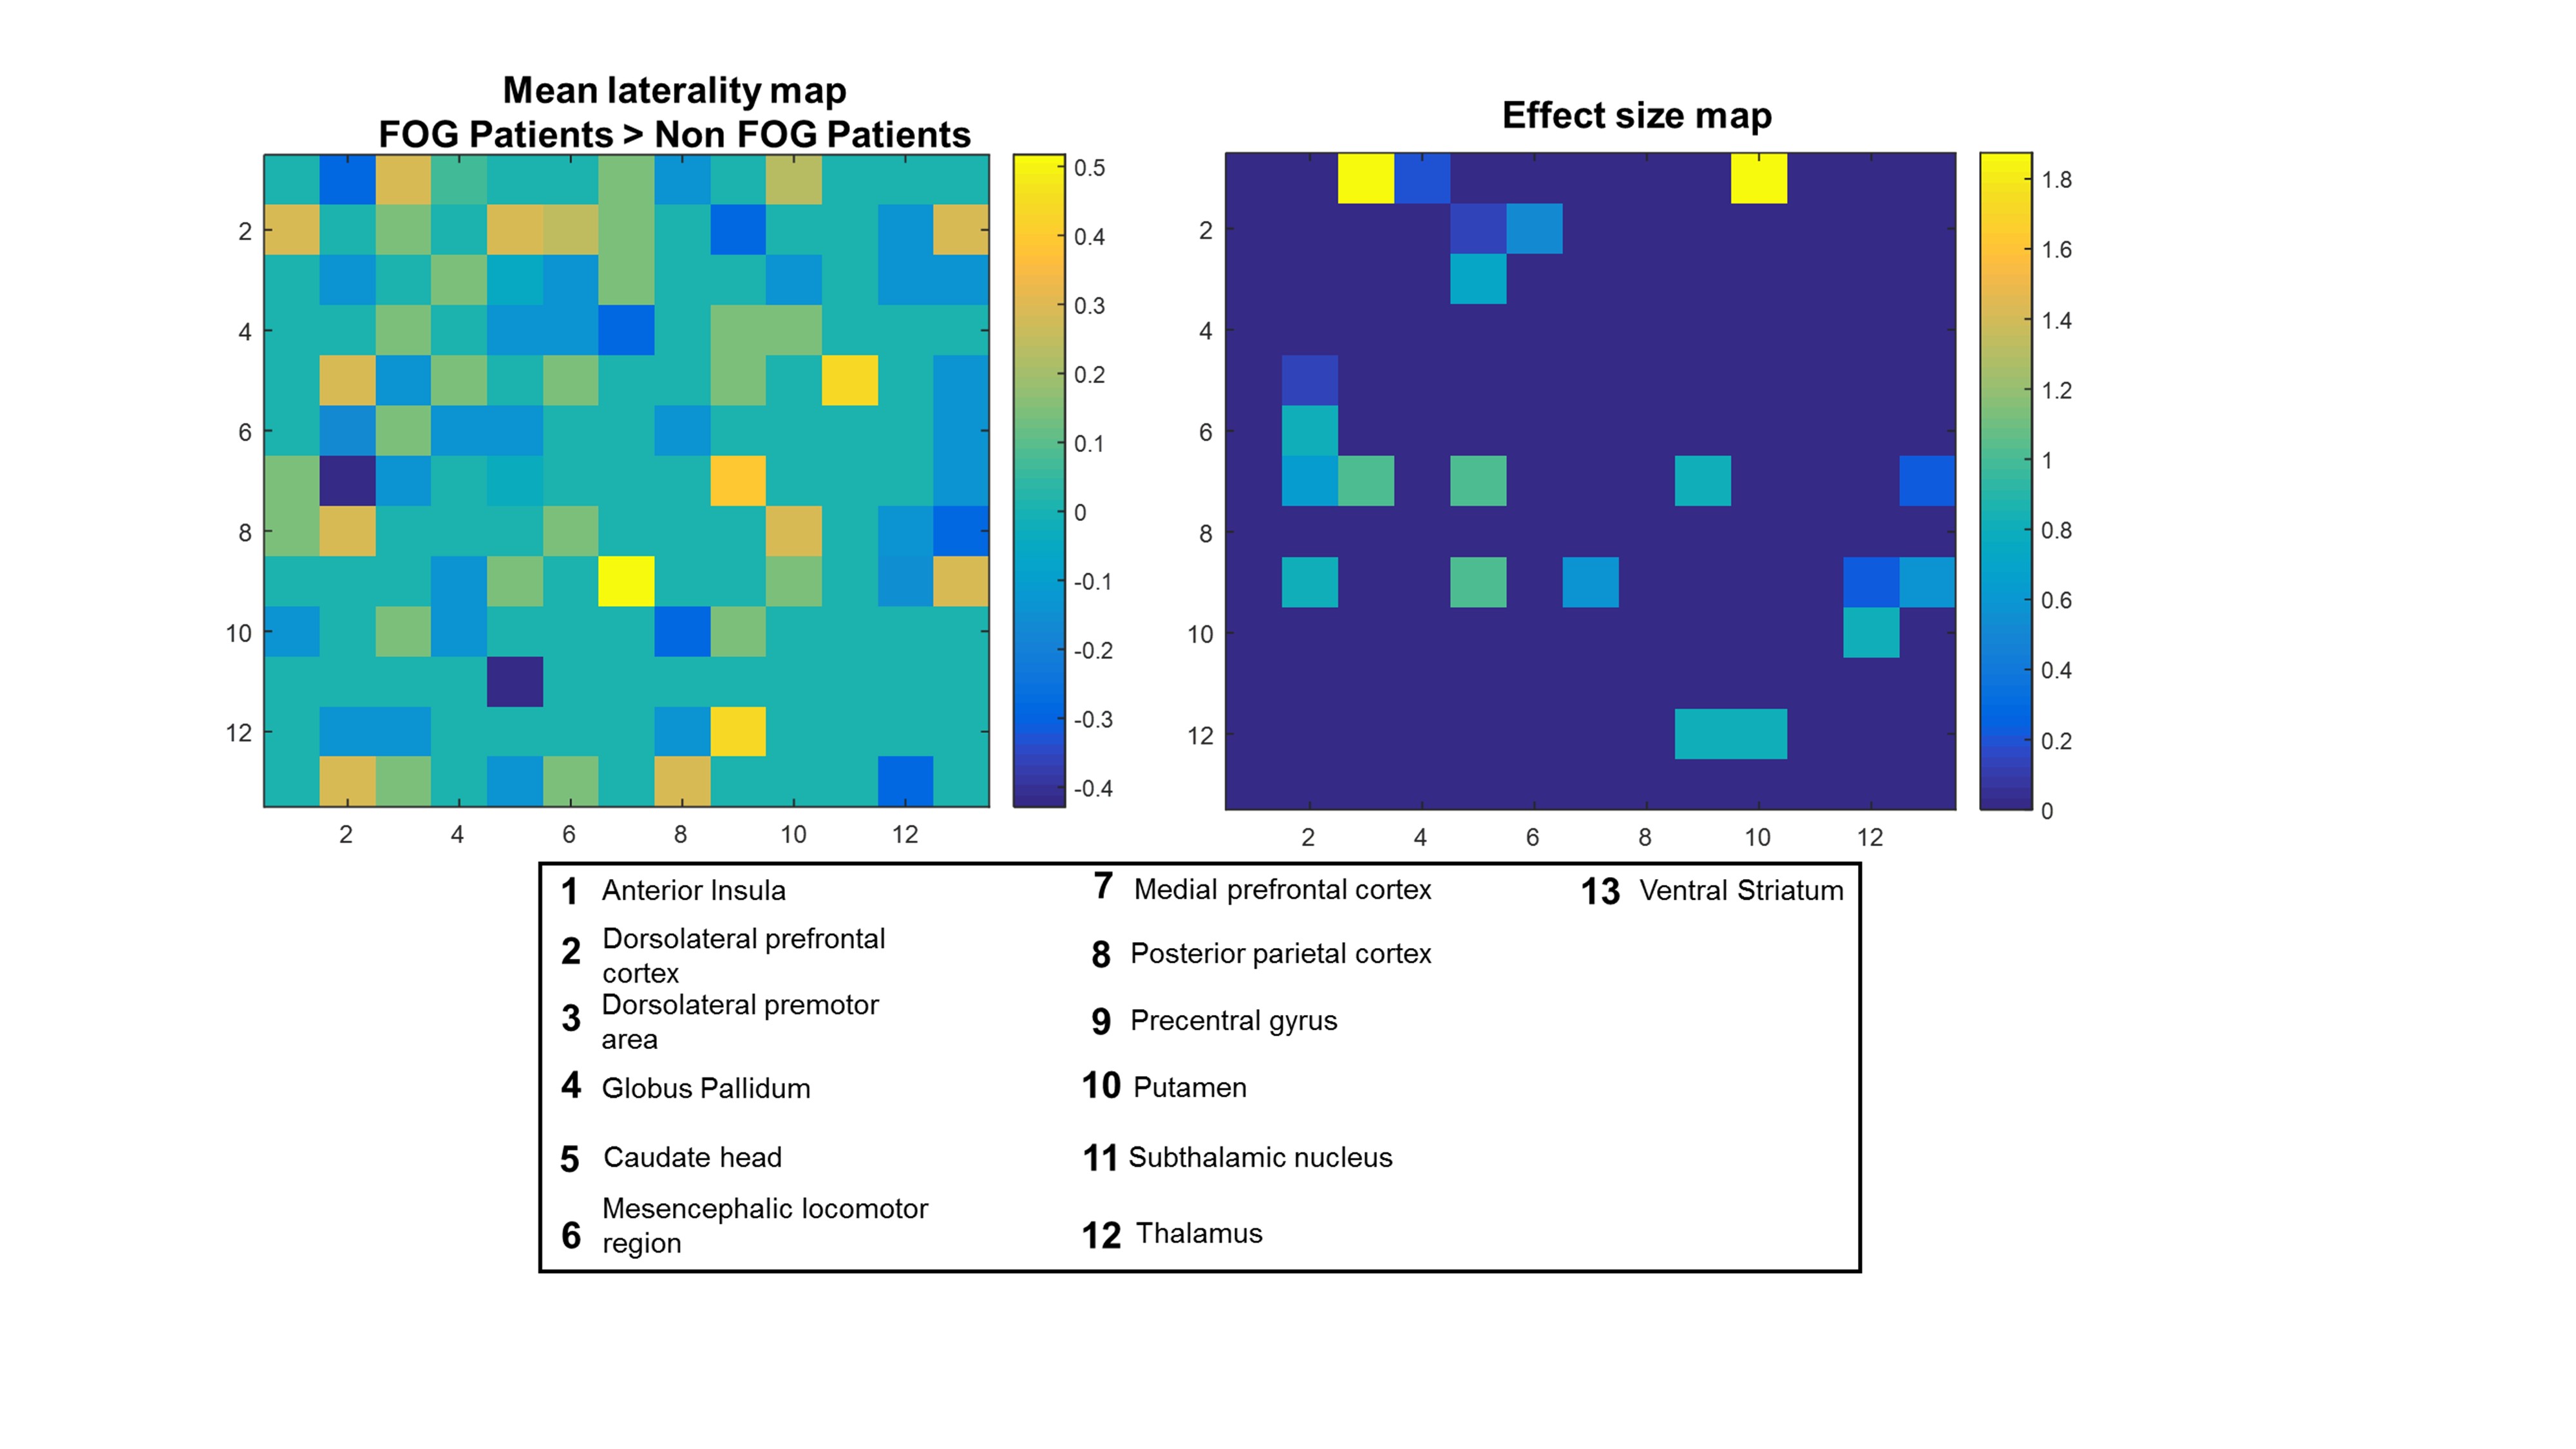
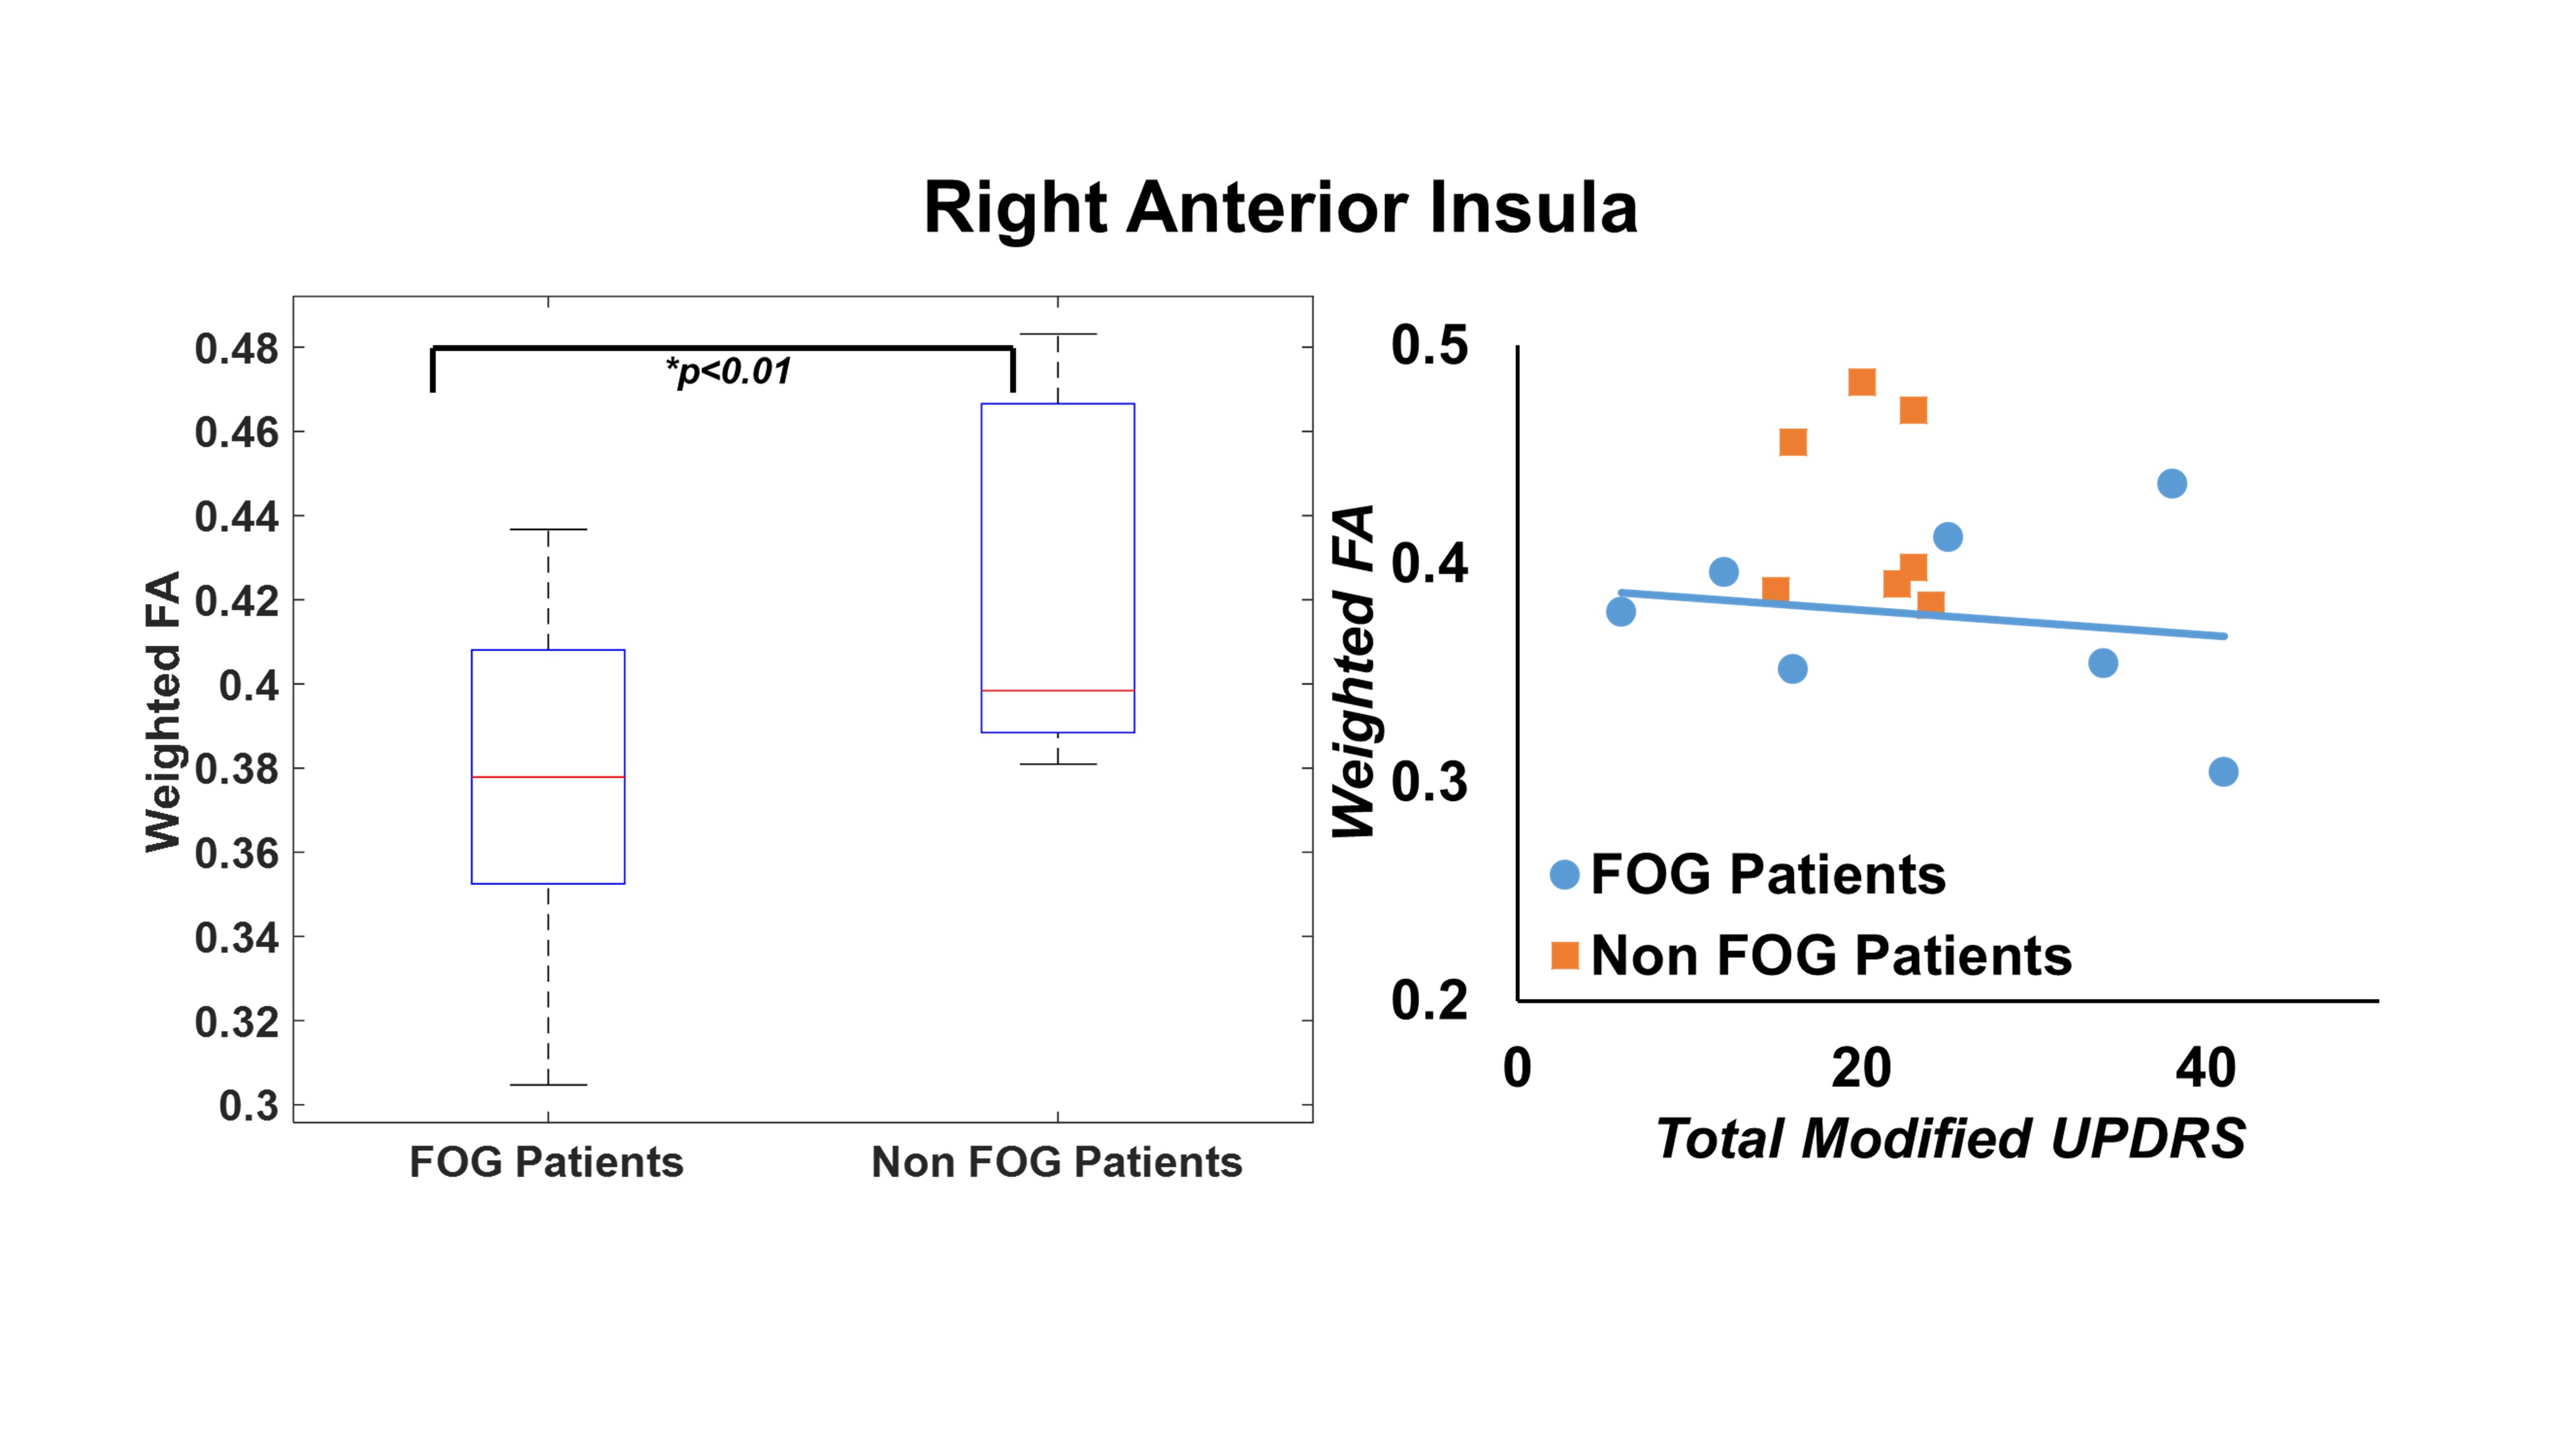
Fig.1 shows the location of the ROIs used in this study in MNI space and left-panel of Fig.2 shows the ROIs for a representative subject in each group. The right-panel of Fig.2 shows that there is a qualitative difference between the structural connectivity patterns between ROIs. However, there was no statistical difference in these patterns as evaluated by NBS. Fig.3 shows that 24.36% and 23.72% of connections have left and right laterality respectively. However, the laterality was not significantly different between the groups. The right-panel of Fig.3 shows that there is a stronger effect (d>0.8) of left-laterality especially involving the premotor area and putamen for PD-FOG and right-laterality for regions involving the thalamus. As shown in Fig.4, only FAwt was found to be significantly lower in the right anterior insula of PD-FOG and was significantly associated with the UPDRS score.Discussion and Conclusion
Our findings suggest that there is an asymmetric left laterality in early PD-FOG but no evidence of laterality involving PPN was found2. A significant association of novel FAwt with UPDRS scores suggest that FAwt could be used as a potential imaging biomarker for PD-FOG.Acknowledgements
The study issupported by the National Institutes of Health (grant number 1R01EB014284 and P20GM109025). PPMI is sponsored and partially funded by The Michael J. Fox Foundation for Parkinson’s Research (MJFF). Other funding partners include a consortium of industry players, non-profit organizations and private individuals (for a full list see http://www.ppmi-info.org/about-ppmi/who-we-are/study-sponsors/).References
1. Nutt JG, Bloem BR, Giladi N, Hallett M, Horak FB, Nieuwboer A. Freezing of gait: moving forward on a mysterious clinical phenomenon. Lancet Neurol 2011; 10: 734–44.
2 Fling BW, Cohen RG, Mancini M, Nutt JG, Fair DA, Horak FB. Asymmetric pedunculopontine network connectivity in parkinsonian patients with freezing of gait. Brain 2013; 136: 2405–18.
3 Pieruccini-Faria F, Ehgoetz Martens KA, Silveira CRA, Jones JA, Almeida QJ. Side of basal ganglia degeneration influences freezing of gait in Parkinson’s disease. Behav Neurosci 2015; 129: 214–8.
4 Lewis SJG, Barker RA. A pathophysiological model of freezing of gait in Parkinson’s disease. Parkinsonism Relat Disord 2009; 15: 333–8.
5 Planetta PJ, Ofori E, Pasternak O, et al. Free-water imaging in Parkinson’s disease and atypical parkinsonism. Brain 2016; 139: 495–508.
6 Mishra V, Guo X, Delgado MR, Huang H. Toward tract-specific fractional anisotropy (TSFA) at crossing-fiber regions with clinical diffusion MRI. Magn Reson Med 2014; 0: 1–12.
7 www.ppmi-info.org.
8 Wang R, Wedeen VJ. TrackVis.org. In: Proc Intl Soc Mag Reson Med. 2007: 3720.
9 Jeon T, Mishra V, Huang H. Effects of cortical regions of interests on tractography and brain connectivity quantification. In: Proc Intl Soc Mag Reson Med. 2016: 2063.
10 Kann S, Zhang S, Manza P, Leung H-C, Li C-SR. Hemispheric Lateralization of Resting-State Functional Connectivity of the Anterior Insula: Association with Age, Gender, and a Novelty-Seeking Trait. Brain Connect 2016; 6: 724–34.
11 Winkler AM, Ridgway GR, Douaud G, Nichols TE, Smith SM. Faster permutation inference in brain imaging. Neuroimage 2016; 141: 502–16.
Figures