3632
Clinical diagnosis based on speech mechanics with dynamic (real time) MRI, functional MRI and acoustics of speech (spectrogram)1Department Otorhinolaryngology & Head-Neck Surgery, AIIMS, New Delhi India, New Delhi, India, 2AIIMS, New Delhi, New Delhi, India, 3Neurology, Fortis Vasant Kunj, New Delhi, DE, India
Synopsis
In evidence based clinical practice, mapping speech production problems is a challenge, further with cognitive impairment in degenerative disease makes the examination and assessments difficult. Visualization of the flexible vocal tract (dynamic MRI), cognitive planning (BOLD activation) and automated acoustic analysis (spectrogram) of speech production in motor degenerative diseases (like Parkinson’s Disease) might reframe the diagnostic evaluations. Empirically dynamic MRI is important technique for articulatory movements when adjunct with cognitive planning (fMRI) and spectrogram analysis may team as sensitive measures in clinical diagnosis. Thus this pilot study was planned to observe the significance.
Purpose
Vocal tract is similar to an inverted L-shaped tube extending from vocal folds to lips with extension to nasal cavity and due to wide range of movements and flexibility of articulators involved (particularly tongue), it is difficult to clinically examine and measure. These skilled motor movements are programmed and controlled by cerebral cortex and basal ganglia which deteriorates gradually in degenerative diseases of central nervous system like Parkinson’s Disease (PD). Clinical diagnosis if supplemented with MRI (spatio-temporal articulatory dynamics), fMRI (BOLD) and automated acoustic feature analysis with support vector machines (SVM) may be promising instrumentIntroduction
Speech production is a complex mechanism involving articulatory movements, with considerable individual and inter-speaker variability. In progressive degeneration these non-coordinated agonist-antagonist muscle groups of oral, nasal and respiratory motor programs deteriorate leading to perceptual features of spectrogram. Knowledge of applied bioacoustics, biosensing and computational modeling would optimize clinical diagnosis1-7Methods
Study compared natural rate syllable production (velar and alveolar) in normal healthy control (n=6) and Parkinson’s Disease (n=6) subjects (age 45-70 years) with acoustic features (spectrogram), real-time dynamic MRI and fMRI. Assessments consisted UPDRS-III, H&Y, Frenchay’s Dysarthria Scale; acoustic analysis of audio-recorded speech and fMRI, dynamic MRI. Speech stimulus involved Hindi syllable production (unaspirated, voiceless and voiced) that were presented as visual stimulus with SuperLab4.2, Cedrus Inc. USA and MR compatible binocular goggles and speech output was recorded by MR compatible microphone (NordicNeuroLab, Norway). MR images were acquired at 1.5T MR scanner (Avanto, Siemens, Germany) using 12-channel head & neck where parameters of dynamic MRI were 2-D single slice using ‘trufi’ sequence with slice thickness flip angle 77°; TR 1.90 ms; TE 1 ms.; echo-span 2.7 ms; bandwidth 1395 Hz/ pixel; phase 40 freq/ s.; slice thickness 10 mm (10mm X 241mm X 360mm); temporal resolution 5 frames per second or 1 frame in 200 ms, acquisition time of 80s. Single-shot echoplanar imaging (EPI) sequence was used for observing cortical BOLD (blood oxygen level dependent) activity, parameters used were TR/TE 4000/44, flip angle 90, slices: 31(slice thickness 5mm with no slice gap), EPI factor 128. To overlay T1-weighted 3D images were acquired with magnetically prepared rapid gradient-echo (MPRAGE) sequence. Processing of dynamic MRI was done with DICOM works and ImageJ softwares. Analysis of BOLD images involved preprocessing and post processing using SPM12 software where second level analysis was done as two sample (uncorrected p<0.001, threshold 5). After noise reduction (Wavepad) spectral acoustic processing was done in wavesurfer, and praat of recorded verbal output (during MRI & outside scanner). Important variables observed were formants F1, F2, F2 transition, voice-onset time, jitter, shimmer, pitch variations, loudness, harmonic distortion, etc. The variables defined in praat were used as features extraction, linear regression and classification in support vector machine (SVM) for computing and automated diagnosis of the two groups (healthy controls and PD)Results and Discussion
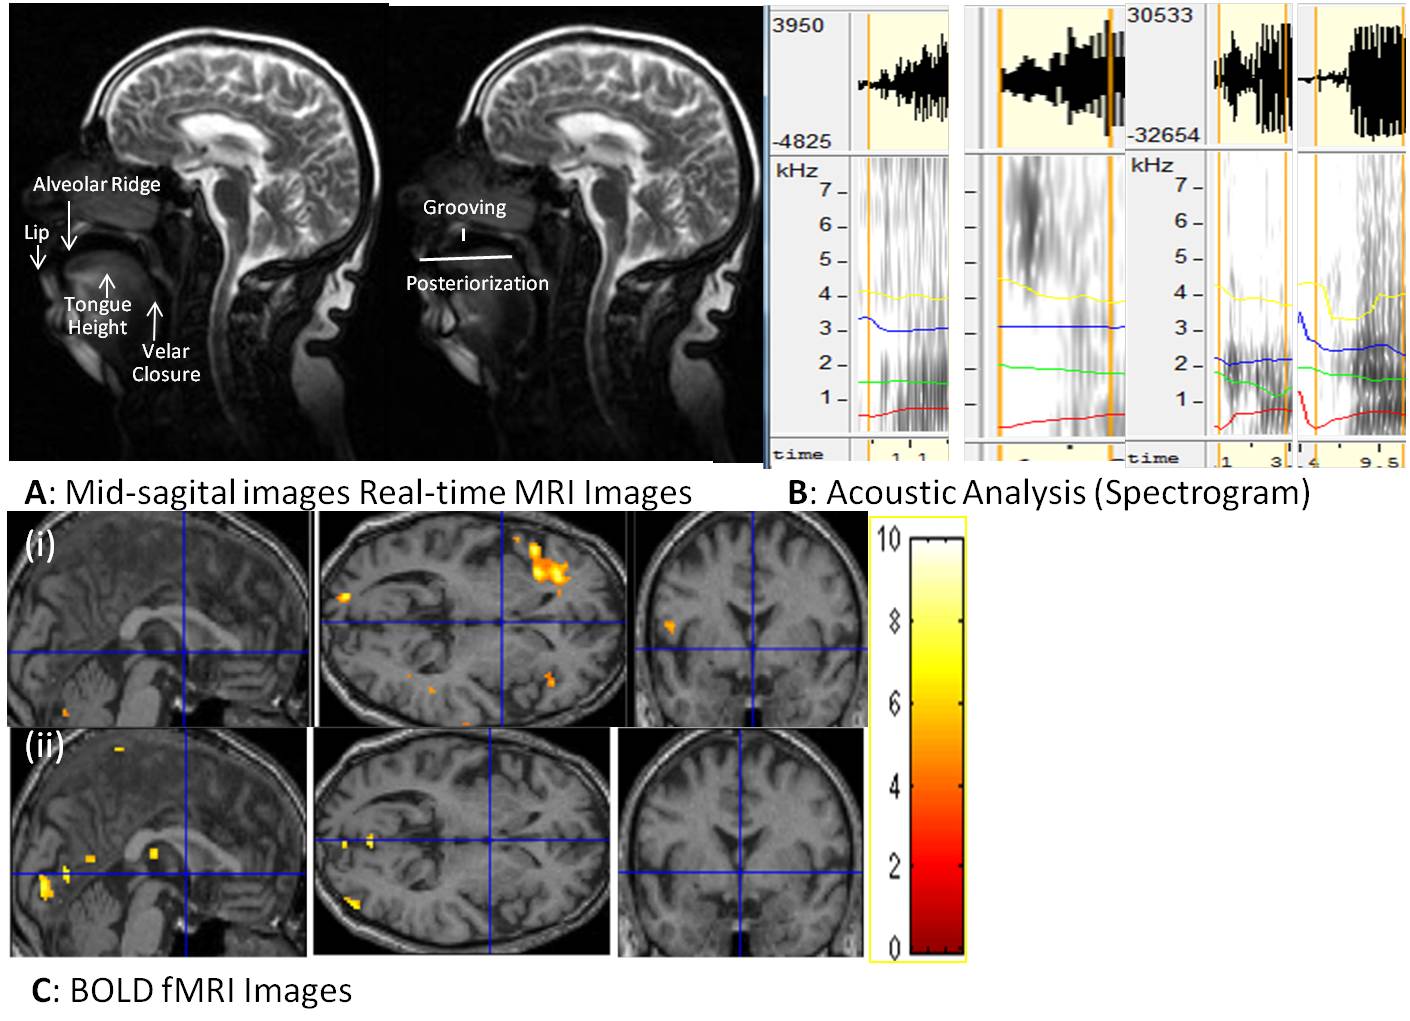
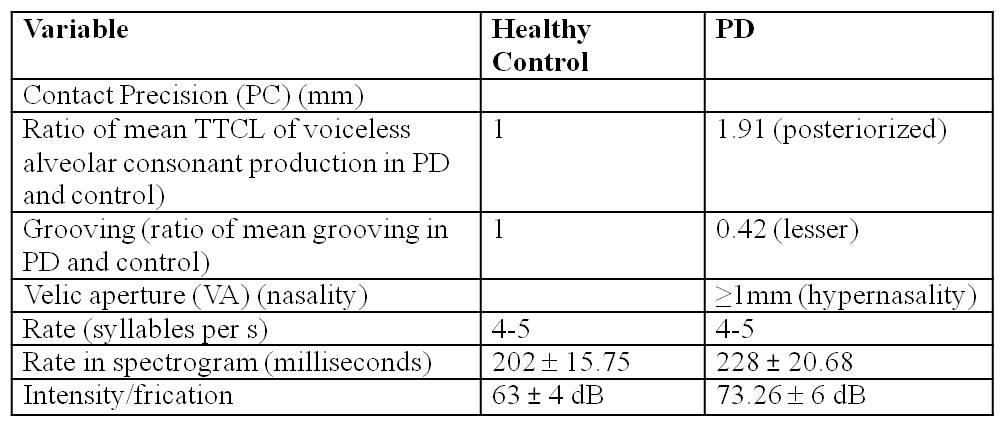
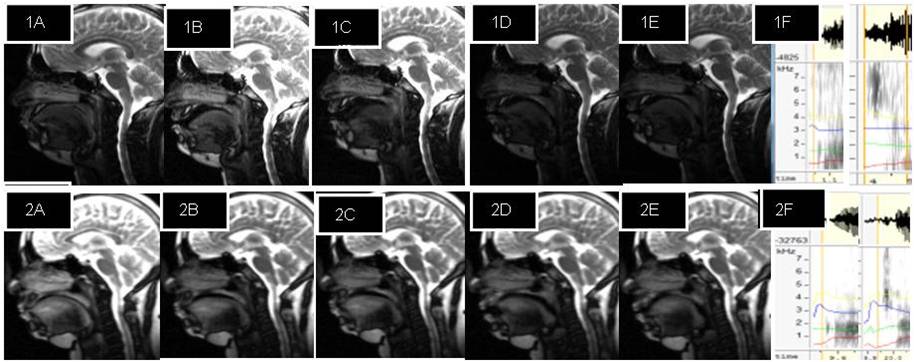
Dynamic MRI show affricate production in PD was posterorized, incomplete imprecise velar constriction (PC³1mm) and lesser tongue body grooving with hypernasality (VA³1mm in PD). Pharyngeal, laryngeal shaping revealed vocal-cord vibration. Acoustic analysis show more intensity or frication (Table1). Rate of speech production calculated was 4-5 sps i.e. equal in PD and healthy controls similar to spectrogram analysis. Comparing BOLD activation of cortical areas it was observed in supplementary motor area (SMA), bilateral inferior frontal gyrus (IFG) and sensory motor areas indicate a greater effort to initiate speech in PD. The classification of PD based on acoustic analysis by SVM had significance of 6.8. Corroborating the information from all the three aspects dynamic MRI, fMRI and automated computation of acoustic parameters adjunct the clinical examination. It can be attributed from this pilot study that dynamic MRI, BOLD activation and automated computation of acoustic feature increased the efficacy and precision of clinical diagnosisConclusion
In speech neuroscience diagnosis augmented with dynamic MRI, fMRI and automated acoustic analysis would be promising clinical futureAcknowledgements
No acknowledgement found.References
1. Bresch E, Kim YC, Nayak K, Byrd D, Narayanan S. Seeing speech: capturing vocal tract shaping using real-time magnetic resonance imaging. IEEE Signal Processing Magazine 25(3):123-132. doi: 10.1109/MSP.2008.918034
2. Kim YC, Proctor MI, Narayanan SS, Nayak KS. Improved imaging of lingual articulation using real-time multislice MRI. J Magn Reson Imaging, 2012 35(4):943-8. doi: 10.1002/jmri.23510.
3. Strohl KP, Butler JP, Malhotra A. Mechanical properties of the upper airway. Compr Physiol. 2012, 2(3):1853-72. doi: 10.1002/cphy.c110053.
4. Toutios A, Narayanan SS. Advances in real-time magnetic resonance imaging of the vocal tract for speech science and technology research. APSIPA Trans Signal Inf Process. 2016, 5. doi:10.1017/ATSIP.2016.5.
5. Ventura SM, Freitas DR, Tavares JM. Toward dynamic magnetic resonance imaging of the vocal tract during speech production. J Voice, 2011 25(4):511-8. doi:10.1016/j.jvoice.2010.01.014.
6. Vorperian HK, Kurtzweil SL, Fourakis M, Kent RD, Tillman KK, Austin D. Effect of body position on vocal tract acoustics: Acoustic pharyngometry and vowel formants. J Acoust Soc Am. 2015, 138(2):833-45. doi: 10.1121/1.4926563.
7. Vos RR, Murphy DT, Howard DM, Daffern H. Determining the relevant criteria for three-dimensional vocal tract characterization. J Voice, 2017. pii: S0892-1997(16)30212-0. doi: 10.1016/j.jvoice.2017.04.001. [Epub ahead of print]
Figures