3631
Automatic analysis of multi-echo GRE and DTI data of Parkinson’s disease patients and control subjects using atlas-based subcortical regions1Medical Imaging, The Ottawa Hospital, Ottawa, ON, Canada, 2Radiology, University of Ottawa, Ottawa, ON, Canada, 3Ottawa Hospital Research Institute, Ottawa, ON, Canada, 4Division of Neurology, University of Ottawa Brain and Mind Research Institute, Ottawa, ON, Canada
Synopsis
Multi-parametric brain MRI longitudinal studies, which result in multiple quantitative parameter maps, can require intense post-processing work and time if several sub-cortical structures need to be analyzed individually on a region of interest (ROI) basis. In this study, we used a brain co-registration process together with a structural subcortical probability atlas for an automated analysis of quantitative MRI data. Patients with a recent diagnosis of Parkinson’s disease (<1 year) and healthy controls underwent brain MRI in a longitudinal study design. Quantitative maps derived from multi-echo GRE and DTI acquisitions were analyzed using this automated post-processing procedure at 3 different time points.
Introduction
Parkinson’s disease (PD) is a chronic and progressive movement disorder, affecting approximately 1% of individuals older than 60 years1. The diagnosis is made clinically based on the presence of characteristic motor features as no diagnostic biomarkers exist for PD. Quantitative MRI techniques have been used to evaluate changes in subcortical structures of PD patients, especially parameter maps derived from DTI and multi-echo GRE imaging (e.g. fractional anisotropy (FA), mean diffusivity (MD), apparent transversal relaxation rate (R2*) and quantitative susceptibility mapping (QSM))2,3. The analysis of these quantitative data maps in several sub-cortical regions requires intense post-processing work, if performed manually on a ROI basis. In this study, we are using a co-registration process to transform parameter maps into a reference brain template (MNI152). The quantitative datasets of PD patients and controls are analyzed in a 1-year longitudinal study (3 time points) using a subcortical probability atlas with 6 different structures.Methods
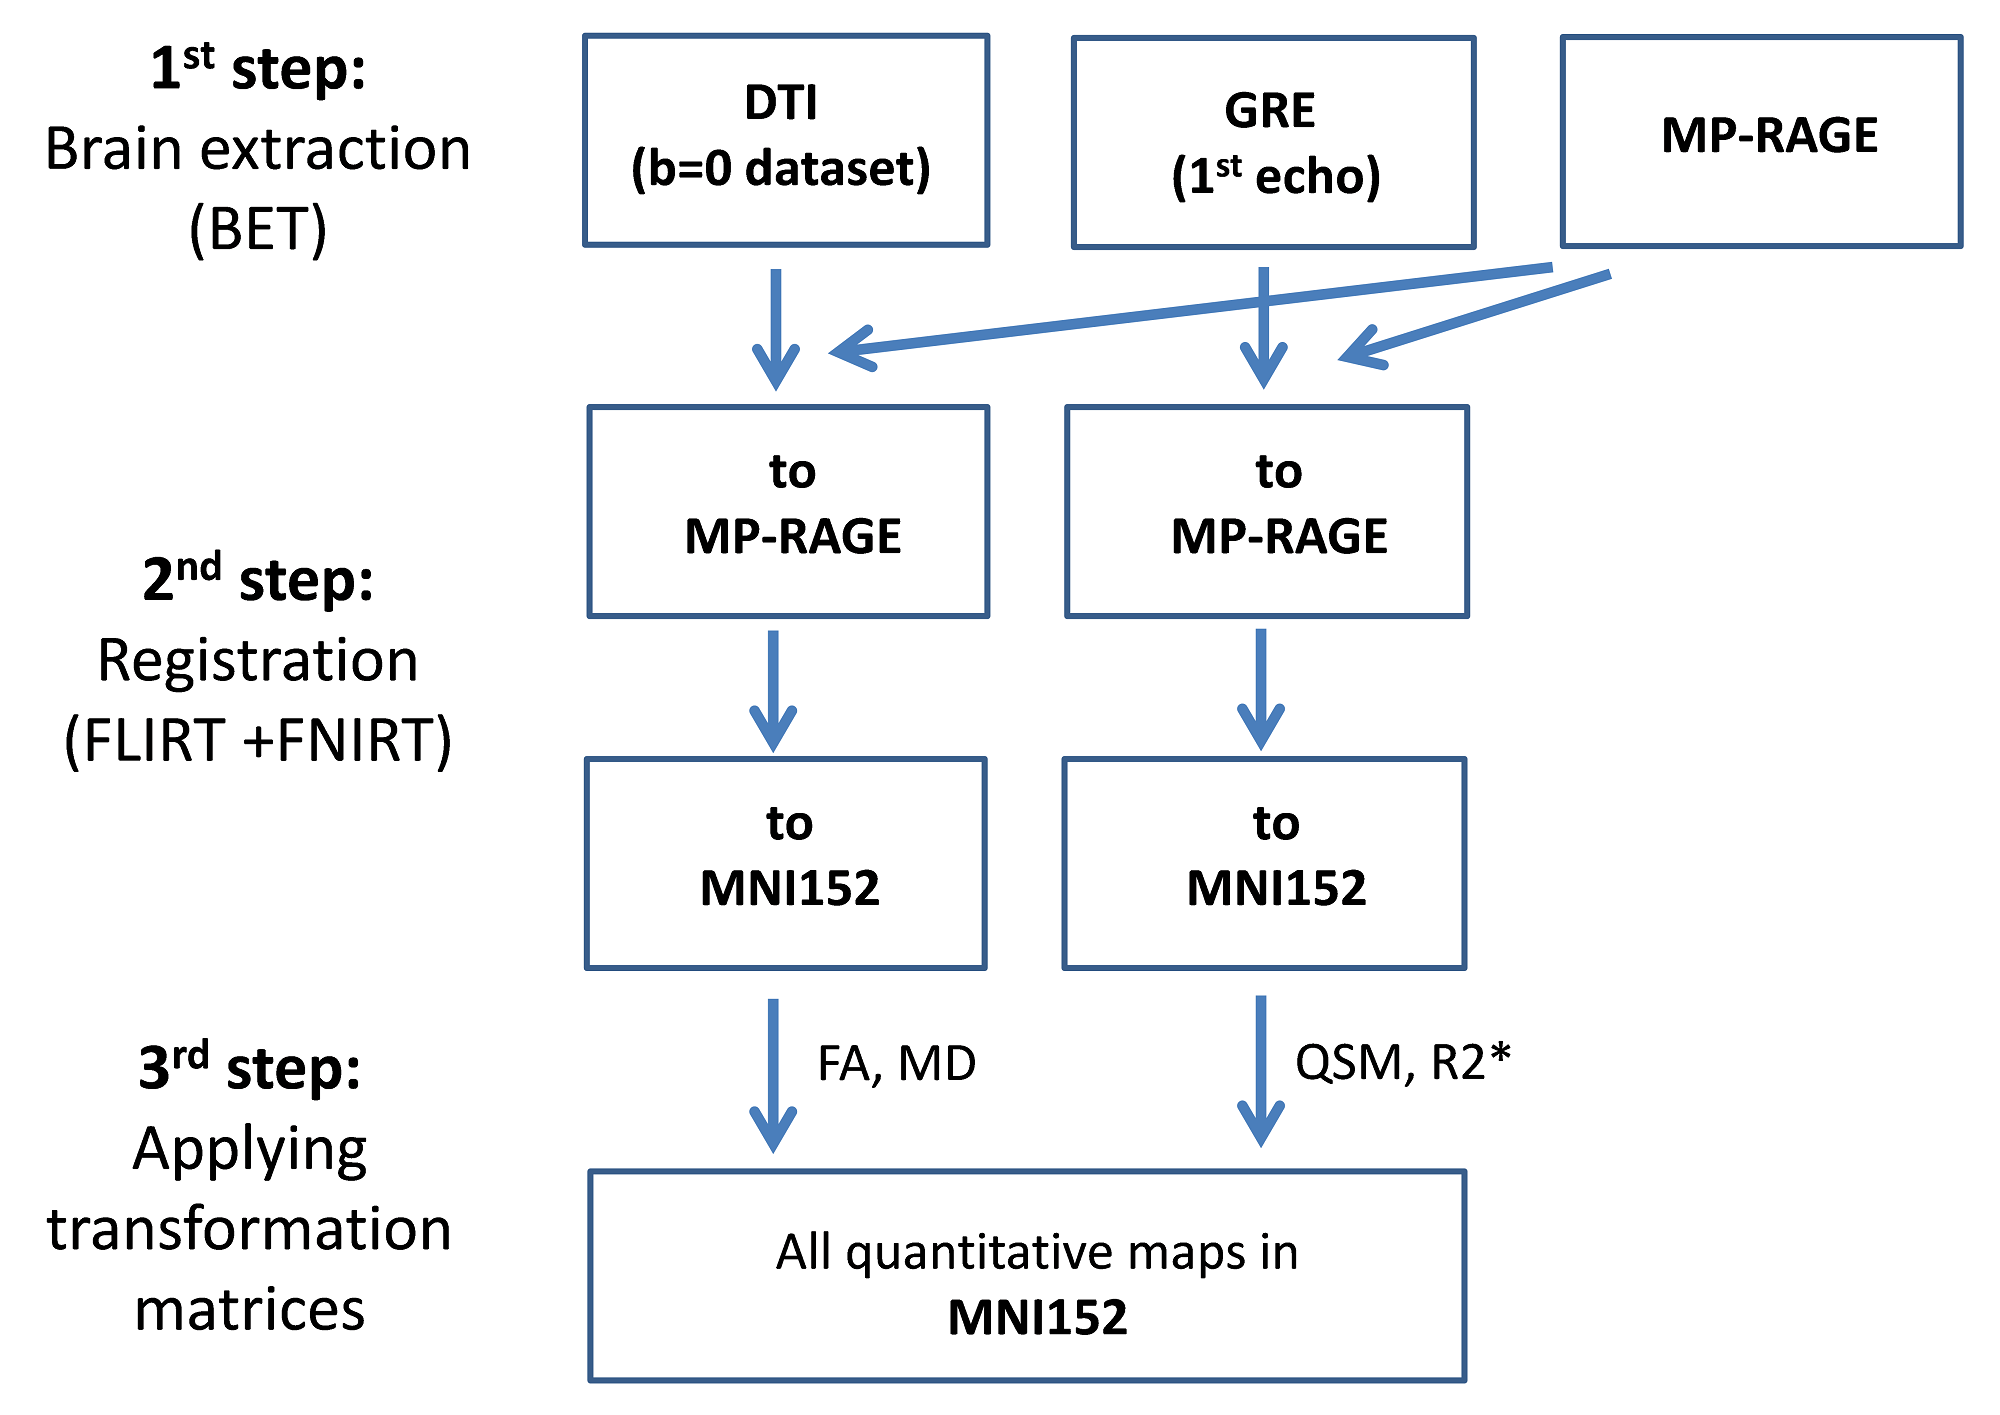
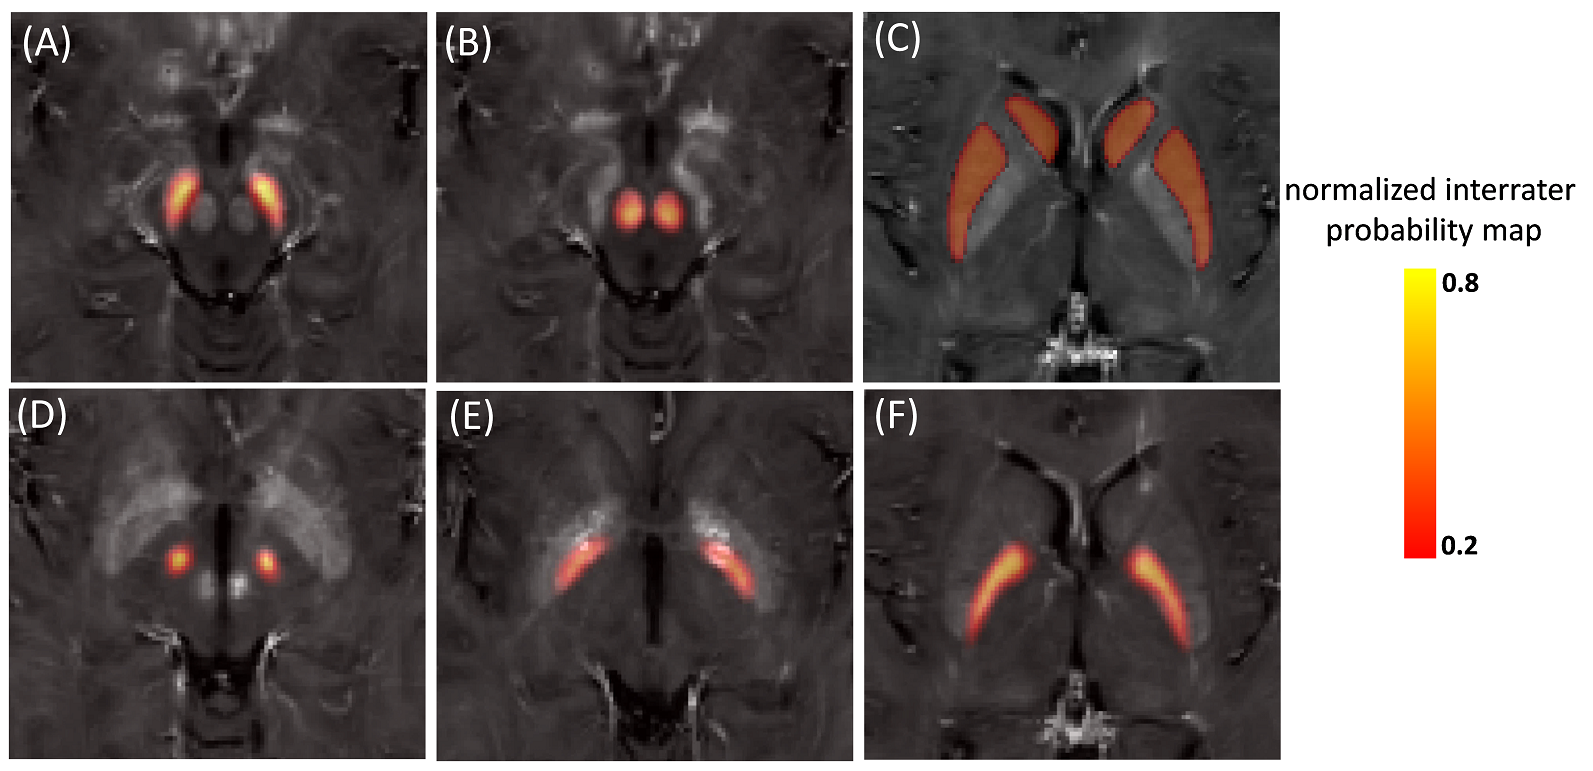
Multi-echo GRE, DTI and MP-RAGE datasets were acquired at 3T (Magnetom Trio, Siemens) from 10 idiopathic PD patients with < 1 year of a PD diagnosis (and <2 years of motor symptom duration) and 10 healthy age- and sex-matched controls. The MRI scans were repeated at 6 and 12 month intervals after the initial scan. Parameters of the 3D multi-echo GRE sequence: TR=44ms, TEs=4.6, 11.2, 18.0, 24.8, 31.6, 38.4ms, FOV=20x20cm2, matrix=256x256, slice=1.5mm, 80 slices. R2* and QSM (using V-SHARP4 and iLSQR5) maps were calculated with MATLAB. For DTI, a diffusion-weighted EPI sequence was used (TR=12s, TE=98ms, FOV=19.2x19.2cm2, matrix=128x128, slice=1.5mm, 76 slices, 30 diffusion directions at b=1000mm2/s) and FA and MD were processed using FSL (EDDY, FDT)6. Co-registration was performed in three steps using FSL6 (Figure 1): (1) Brain extraction. (2) FLIRT and FNIRT registration of the MP-RAGE dataset to the MNI152 space. GRE and DTI (b=0) datasets were first registered to the MP-RAGE dataset and then to the MNI152 space. (3) Transformation matrices were applied to co-register the quantitative maps into MNI152 space. A subcortical probability atlas in MNI152 space including 6 intrinsic volumetric landmarks (substantia nigra (SN), red nucleus (RN), striatum (STR), subthalamic nucleus (STh), globus pallidus pars interna (GPi) and externa (GPe)) was applied to extract the individual quantitative values7. The mean group values from PD patients obtained from the side contralateral to the most parkinsonian hemibody were compared with those from controls (mean from both sides) using a two-tailed t-test. A p-value of <0.05 was deemed significant.Results
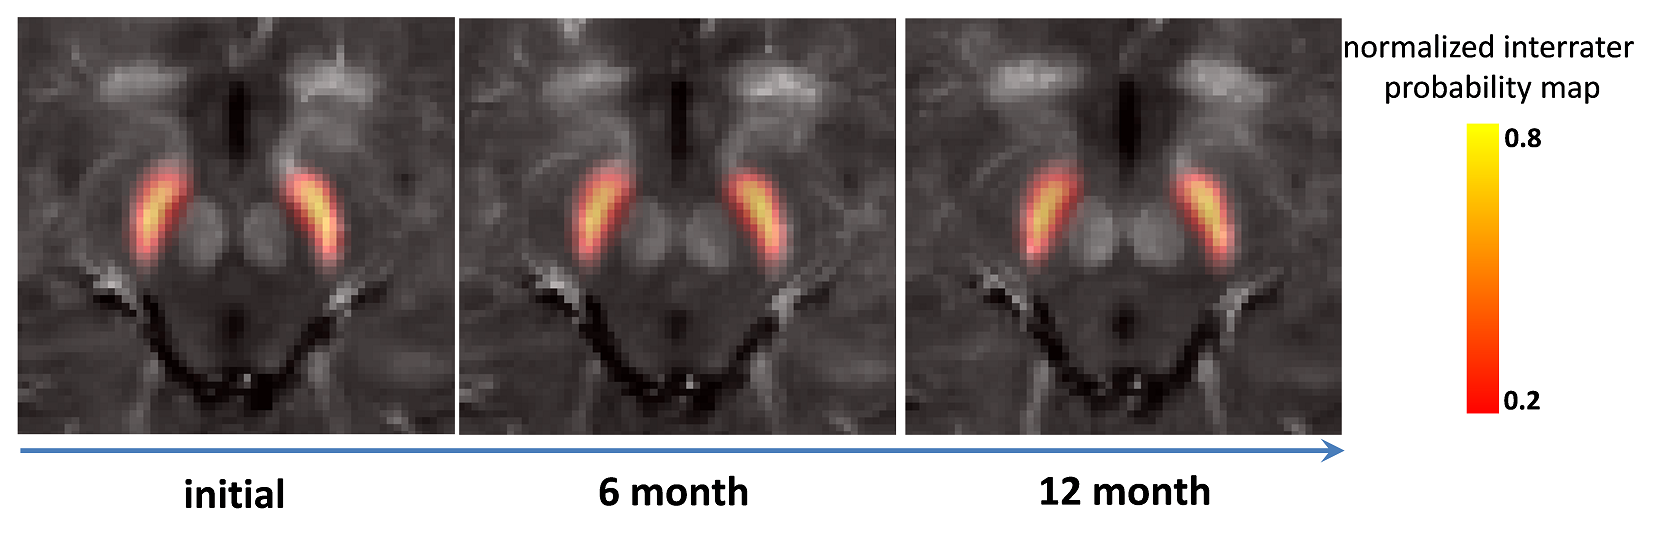
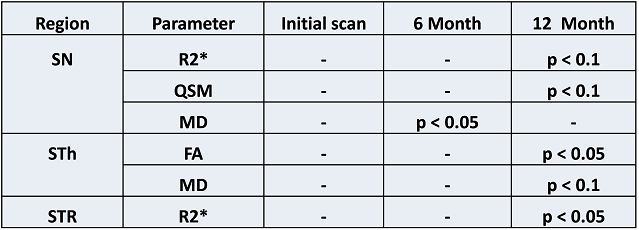
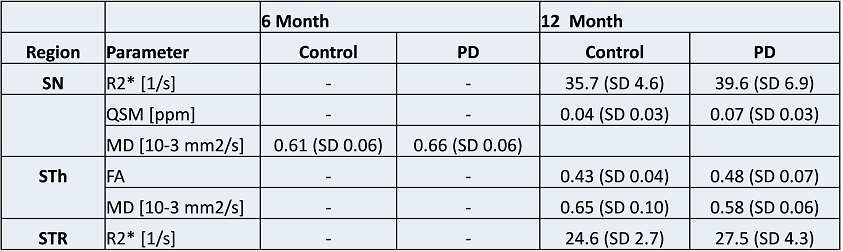
Figure 2 shows the different analyzed subcortical structures on a co-registered R2* map of a PD patient in MNI152 space. Quantitative data from the different structures were extracted by masking the parametric maps with the atlas weighted by its structural probability. The successful co-registration between different longitudinal scans can be seen for a PD subject in Figure 3: The location of the RN and the SN (as a color-coded overlay) are visually in good agreement. Table 1 summarized the significant differences between PD patients and controls. There were no differences at baseline. At the 6 month, MD was significant different in the SN (p<0.05). Table 2 summarizes the corresponding quantitative values. At 12 months, there was a significant difference for R2* and QSM in the SN (p<0.1) and for R2* in STR (p<0.05). Both FA and MD were significant different in the STh.Discussion
This study evaluated quantitative MR maps from 6 different subcortical brain regions using a co-registration and atlas based volumetric analysis approach for PD patients with less than 1 year of a PD diagnosis in comparison with age- and sex-matched healthy subjects. The applied co-registration and analysis pipeline is fully automatic and can help to process quantitative MR brain data without active user interaction for drawing ROIs. Differences in iron-sensitive MRI markers (such as R2* and susceptibility) between subjects groups were found in the SN at 12 months follow up scan, which confirms observations of previous studies2 and raises the question of the sensitivity of iron-sensitive MRI markers for earlier disease duration in PD. Increased R2* in the STN for the PD patients is likely due to increased iron accumulation. Changes in DTI parameters might be also linked to PD as these findings were reported previously8, although in this study differences in SN MD were only significant at the 6-month scan. The atlas approach is restricted to the availability of detailed sub-cortical atlases, where especially for PD research a subdivision of SN into compacta and reticular would be beneficial.Conclusion
Data co-registration and a subcortical atlas based analysis process can help to evaluate large amount of multi-parametric brain MRI data user independently.Acknowledgements
This study was possible due to a grant from the Department of Medicine, University of Ottawa, ON, Canada.References
1. Reeve A, Simcox E, Turnbull D. Ageing and Parkinson's disease: why is advancing age the biggest risk factor? Ageing Res Rev. 2014;14:19-30.
2. Langkammer C, Pirpamer L, Seiler S, et al. Quantitative Susceptibility Mapping in Parkinson's Disease. PLoS One. 2016;11(9):e0162460.
3. Aquino D, Contarino V, Albanese A, et al. Substantia nigra in Parkinson's disease: a multimodal MRI comparison between early and advanced stages of the disease. Neurol Sci. 2014;35(5):753-758.
4. Wu B, Li W, Guidon A, et al. Whole brain susceptibility mapping using compressed sensing. Magn Reson Med. 2012;67(1):137-147.
5. Li W, Avram AV, Wu B, et al. Integrated Laplacian-based phase unwrapping and background phase removal for quantitative susceptibility mapping. NMR Biomed. 2014;27(2):219-227.
6. http://fsl.fmrib.ox.ac.uk/fsl/fslwiki/FSL
7. Wang BT, Poirier S, Guo T, et al. Generation and evaluation of an ultra-high-field atlas with applications in DBS planning. Proc. SPIE 9784. 2016; Medical Imaging: Image Processing, 97840H
8. Atkinson-Clement C, Pinto S, Eusebio A, et al. Diffusion tensor imaging in Parkinson's disease: Review and meta-analysis. Neuroimage Clin. 2017;16:98-110.
Figures