3629
Brain Structural Differences in Healthy LRRK2 G2019S Mutation Carriers: An MR Radiomics Study1The Functional Brain Center, Tel Aviv Sourasky Medical Center, Tel Aviv, Israel, 2Sackler Faculty of Medicine, Tel Aviv University, Tel Aviv, Israel, 3Movement Disorders Unit, Neurological Institute, Tel Aviv Sourasky Medical Center, Tel Aviv, Israel, 4Sagol School of Neuroscience, Tel Aviv University, Tel Aviv, Israel, 5Genetics Institute, Tel Aviv Sourasky Medical Center, Tel Aviv, Israel, 6Department of Psychology, Tel Aviv University, Tel Aviv, Israel, 7Laboratory for Early Markers of Neurodegeneration, Neurology Institute, Tel Aviv Sourasky Medical Center, Tel Aviv, Israel
Synopsis
Structural brain differences in healthy LRRK2-G2019s mutation carriers who are at risk of developing Parkinson's disease (PD) were studied using radiomics analysis of DTI and T1-weighted images. 83 subjects were included: 43 healthy-carriers (HC) and 40 healthy-non-carriers (HNC). 18 statistical parameters were extracted for each modality in 14 subcortical brain regions. Various machine-learning classifiers were tested. The best classification results were obtained using RUSBoosted classifier, with average accuracy 73%, sensitivity 68% and specificity 79%. Radiomics analysis revealed brain differences in HC in comparison to HNC. These results together with the preliminary results among converters support the hypothesis of utilization of structural compensatory mechanisms in this "at risk" cohort.
INTRODUCTION
The G2019S mutation in LRRK2 gene represents the most common pathogenic genetic mutation identified in Parkinson's disease (PD) worldwide, with the highest frequency seen in Ashkenazi Jews and North African Arab Berbers (14% vs. 26% respectively)1,2. Healthy carriers (HC) are considered to have an increased risk for future development of the disease. The aim of this work was to study brain differences in HC of the PD-related G2019S mutation in the LRRK2 gene in comparison to healthy non-carriers (HNC) using radiomics analysis of conventional MRI.METHODS
Participants and MR imaging: 83 Ashkenazi-Jewish subjects were included in this study: 43 HC and 40 HNC. Clinical assessment included the Unified Parkinson's Disease Rating Scale (UPDRS), the Montreal Cognitive Assessment (MoCA), the Beck Depression Inventory (BDI), and the University of Pennsylvania Smell Identification Test (UPSIT). MRI scans were performed on a 3T GE MRI scanner. The protocol included: high-resolution T1 weighted (T1WI) FSPGR imaging and diffusion tensor imaging (DTI) acquired with 19 gradient directions, b-value= 0,1000mm/sec2.
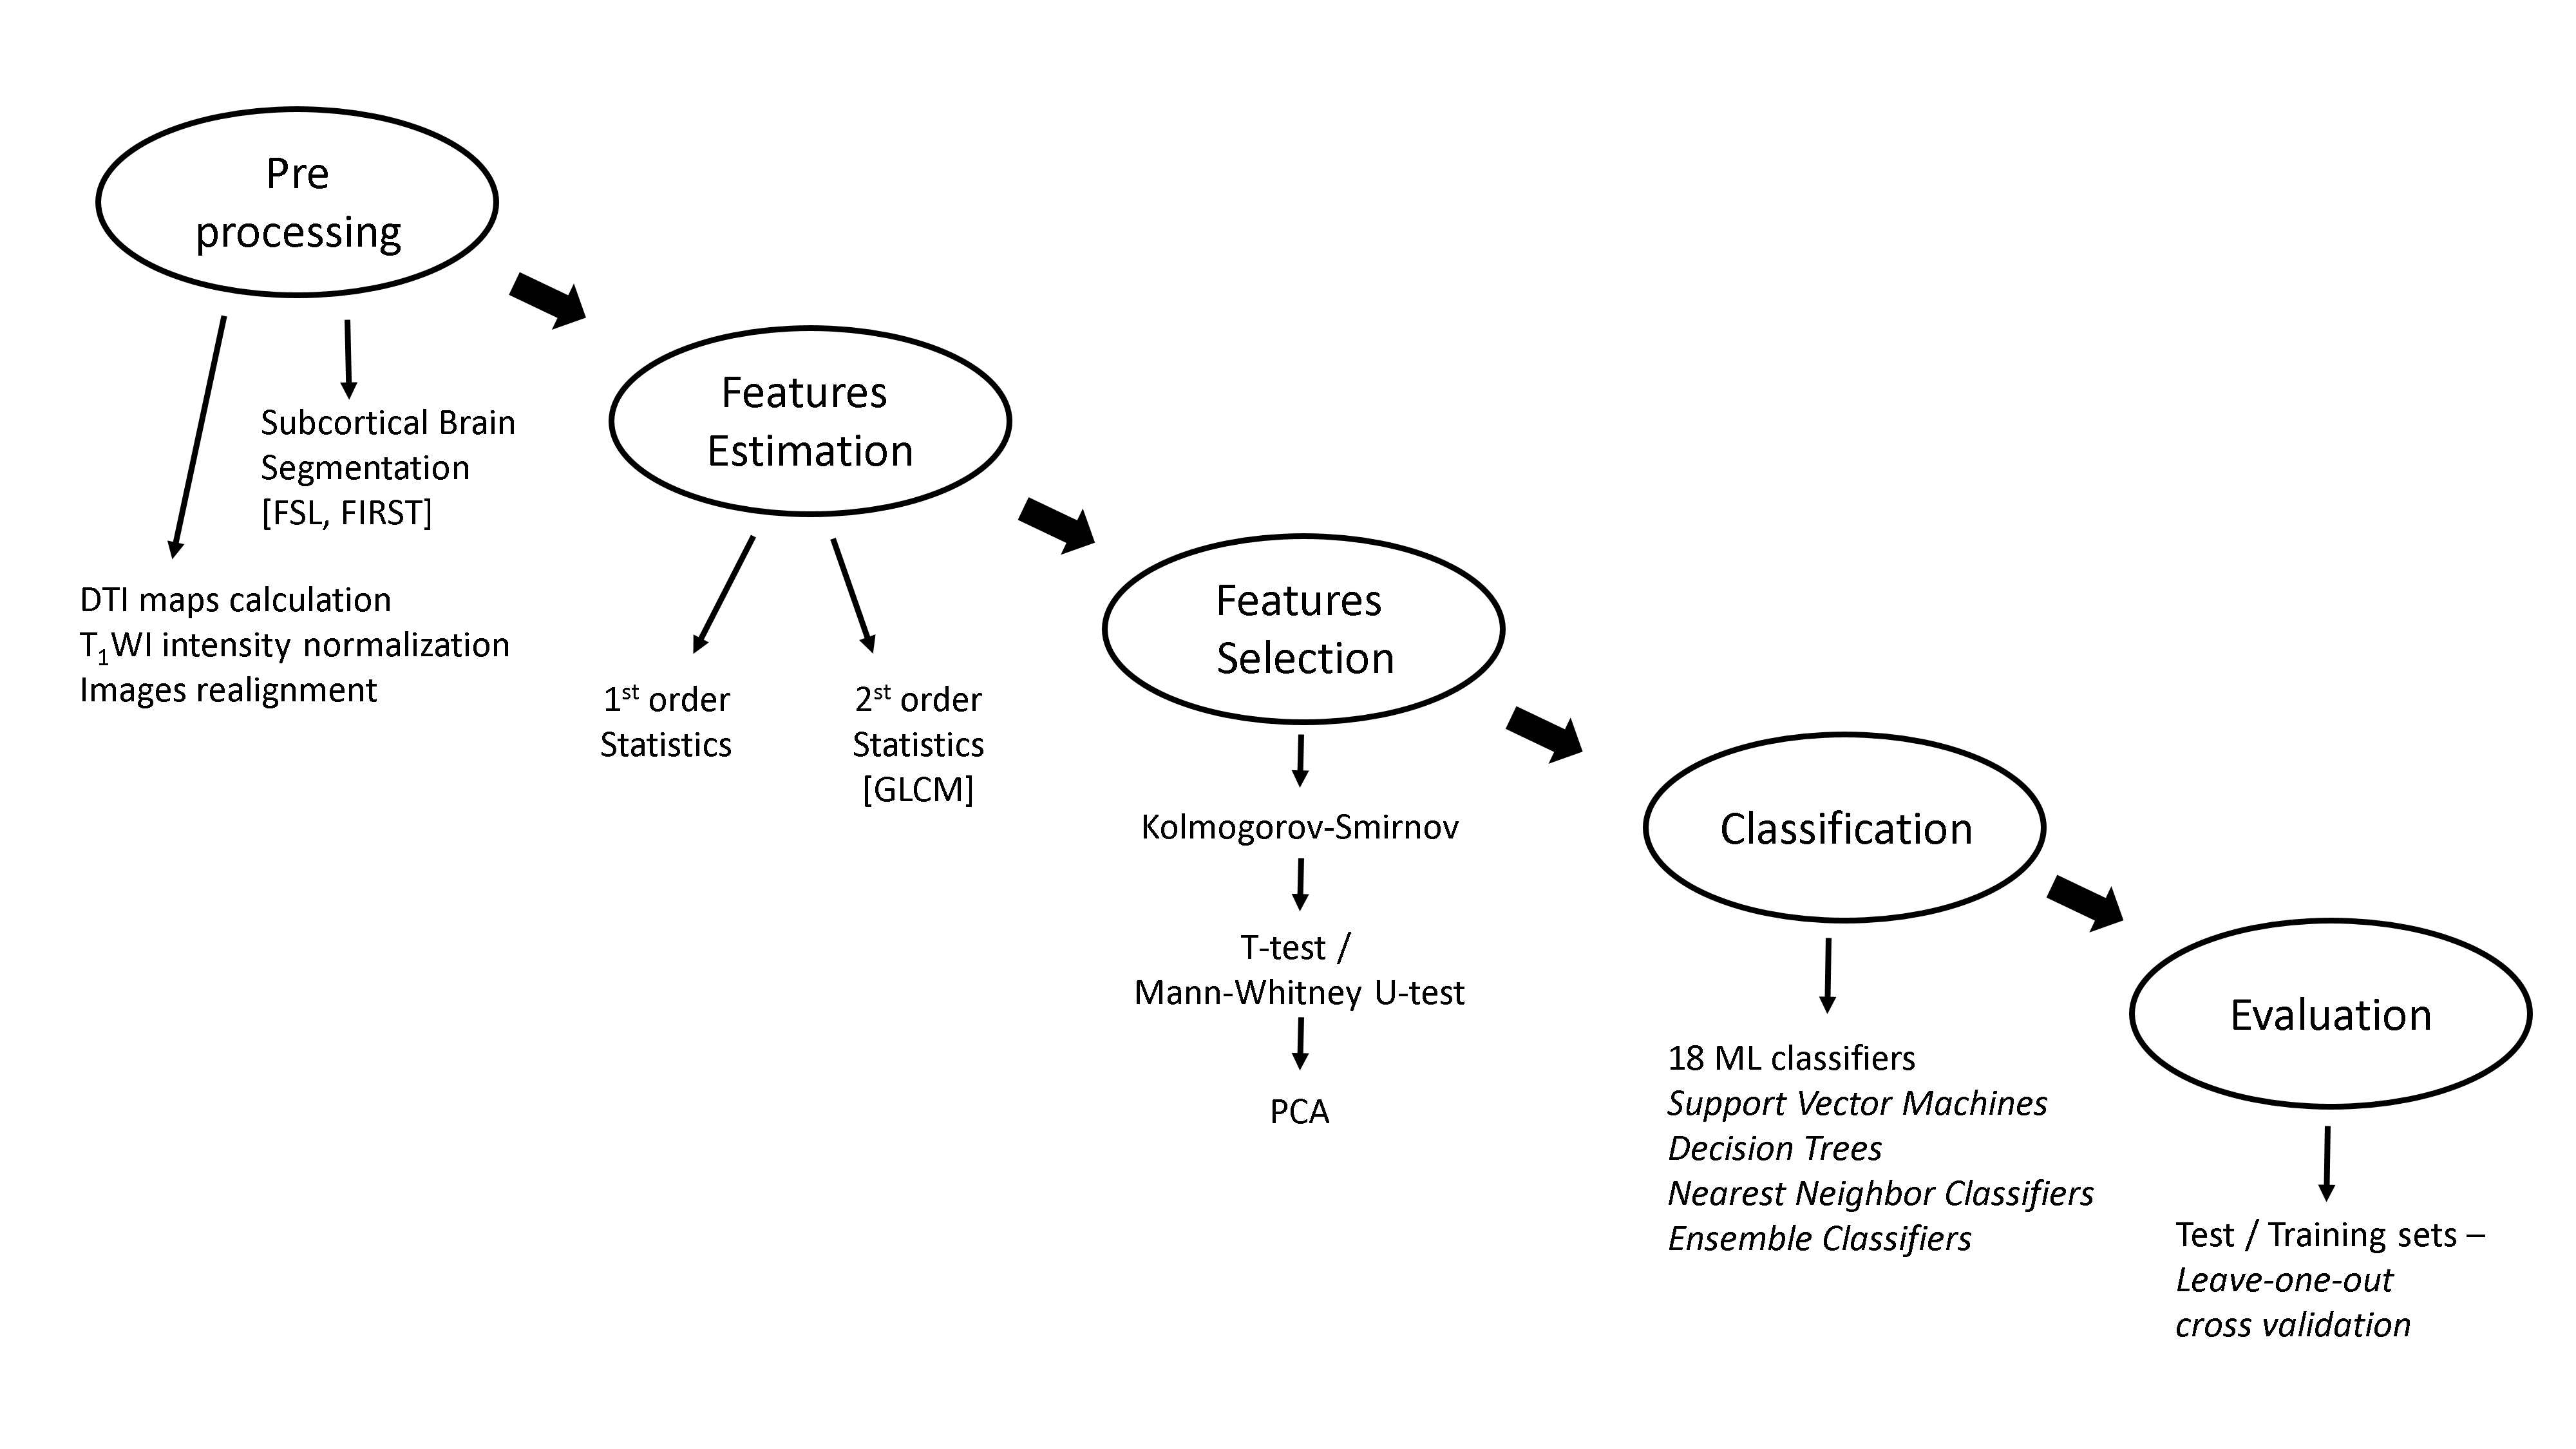
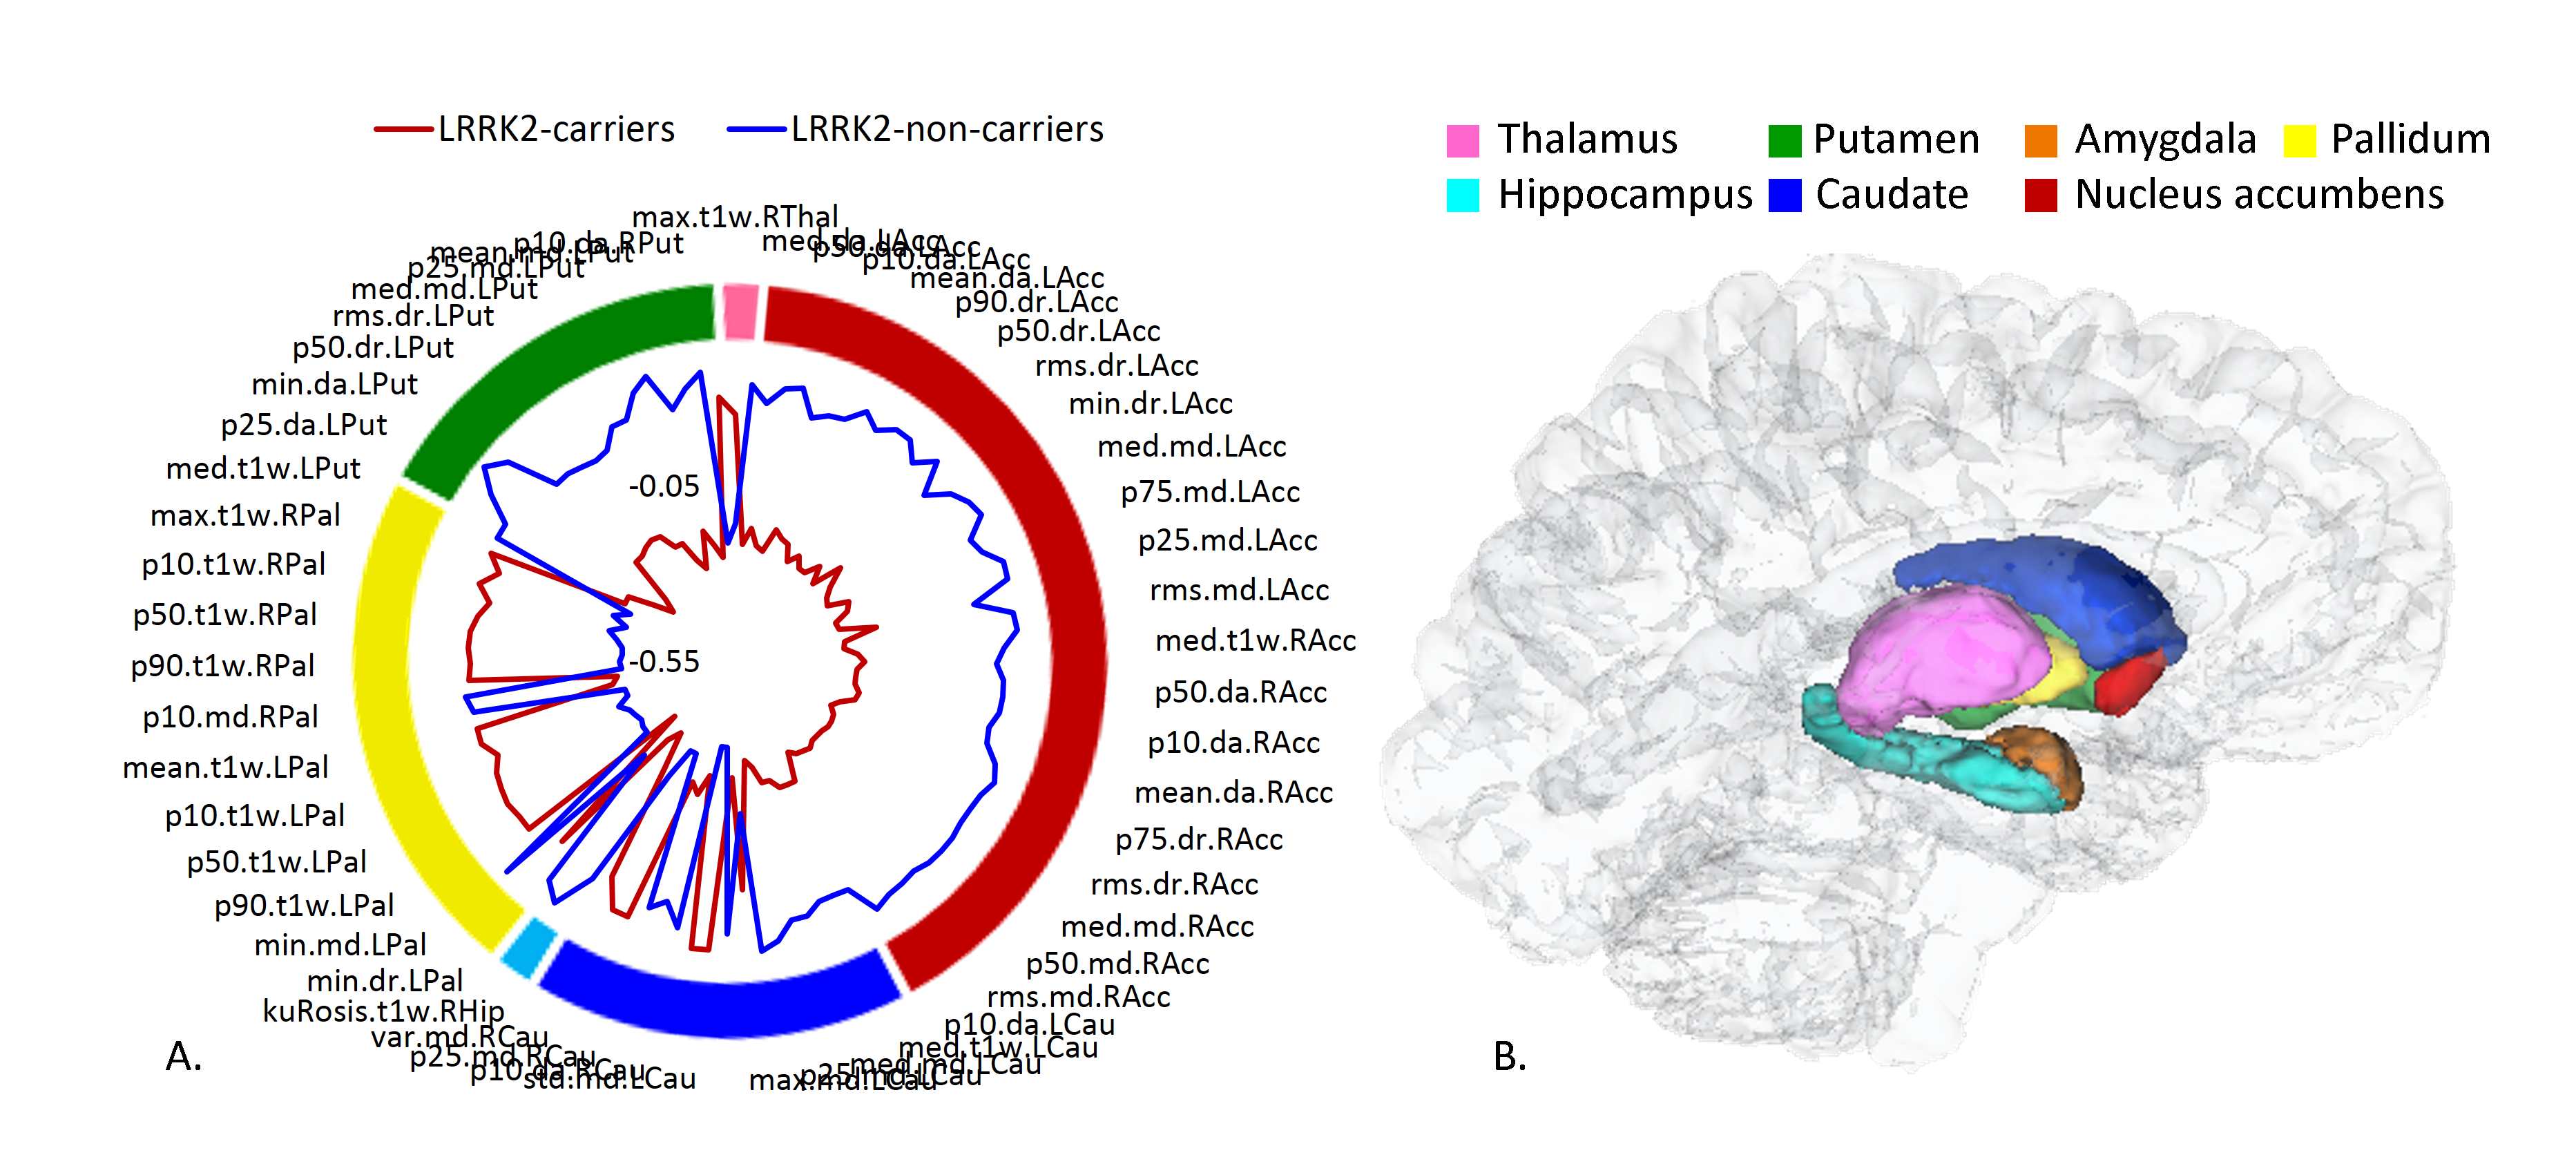
Pre-Processing: Analysis pipeline is illustrated in Figure 1. Analysis was performed using Matlab and FMRIB Software Library (FSL), and included the following: calculating mean, radial and axial diffusivity (MD, Dr, Da) maps from the DTI data using FSL. Intensity normalization of the T1WI was performed relative to the white matter area, which was segmented from the T1WI using FSL automated segmentation tool (FAST). Realignment of all DTI maps to the T1WI was performed using SPM8 rigid-body transformation. 14 subcortical brain structures were extracted based on the 3D T1WI using FSL FIRST segmentation tool: including the right and left thalamus, putamen, pallidum, caudate and nucleus accumbens; hippocampus, and amygdala (Figure 2).
Features Estimation: A total of 18 statistical parameters were extracted for each one of the 14 brain structures and the four MRI modalities, resulting in a total of 1008 features per subject. 14 first order statistical features: mean, variance, median, standard deviation, maximum, minimum, root mean square, 10th,25th,50th,75th and 90th percentiles, kurtosis and skewness; and 4 second order statistical features (Haralick gray level co-occurrence matrix (GLCM) features3): contrast, correlation, energy, and homogeneity.
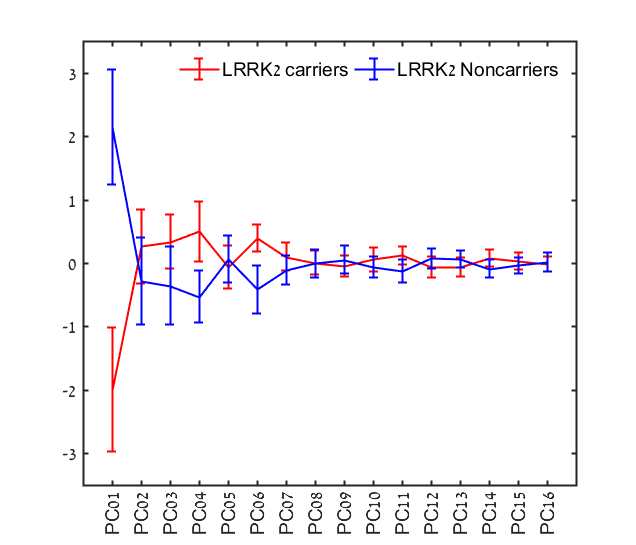
Dimensional reduction: One sample Kolmogorov-Smirnov test was used to test the distribution of each feature. Significant differences between groups were tested using Mann-Whitney U-test / t-test for p<0.05. Principal component analysis (PCA) was applied only to features that were found to be significantly different between groups. Classification into HNC or HC groups: Classification was performed based on the extracted MRI features, using 18 machine learning classifiers including support vector machines (SVM), k-nearest neighbor (kNN), decision trees and ensemble classifiers.
Evaluation: The results were evaluated using a leave-one subject-out partitioning of the training and testing sets. Sensitivity, specificity and accuracy of the classification results were calculated for each classifier.
RESULTS
No significant differences between groups were detected for age, gender, neuro-cognitive and clinical assessments (MoCA scores, UPDRS, UPSIT, and BDI). All scores were within normative values, indicating no prodromal impairments. Using Mann-Whitney U-test / t-test analysis, 103 features showed significant differences between groups and were used as an input for the PCA analysis. All 103 features were first order statistical features. Surface chart of the features significantly differentiating between groups and their locations is given in Figure 2. Significantly lower diffusivity and higher T1W values were detected in most cases in the HC group, demonstrating higher tissue organization in this group. Following PCA, 16 components were found to explain 95% of the variance, and were further used as an input for classification (Figure 3). The best classification results were obtained using RUSBoosted trees classifier, with average accuracy of 73%, sensitivity of 68%, and specificity of 79%, for differentiating between HC and HNC. Three HC were diagnosed with PD about two years following their MR scan. When excluding these subjects and re-analyzing the data, the best results were obtained using RUSBoosted trees classifier, with average accuracy of 75%, sensitivity of 73%, and specificity of 78%.DISCUSSION & CONCLUSION
This study demonstrates brain differences among HC of the G2019S mutation in the LRKK2 gene in comparison to HNC using radiomics analysis in several MRI parameters. These differences suggest a brain structure endophenotype in this "at risk" cohort, with a trend of changes indicating higher tissue organization. Studying differences between HC and HNC may improve our understanding regarding endophenotype of G2019S-LRRK2 carriers and the pathological mechanism of PD at the prodromal phase of the disease.Acknowledgements
To Tuvia Genut and Faina Vitinshtein for performing the MRI scans and to Vicki Myers for editorial assistanceReferences
- Farrer M. et al. LRRK2 mutations in Parkinson disease. Neurology, 2005. 65(5): p. 738-40.
- Orr-Urtreger A. et al. The LRRK2 G2019S mutation in Ashkenazi Jews with Parkinson disease: is there a gender effect? Neurology, 2007. 69(16): p. 1595-602.
- Haralick R.M. et al. Textural features for image classification. IEEE Transactions on systems, man, and cybernetics, 1973(6): p. 610-621.
Figures