3624
Whole-brain MRSI for Quantification of Metabolite Markers of Inflammation and Neuronal Integrity in HIV-1 Clade C Infection1University of Miami, Miami, FL, United States, 2Radiodiagnosis and Imaging, Postgraduate Institute of Medical Education and Research, Chandigarh, India, 3Internal Medicine, Postgraduate Institute of Medical Education and Research, Chandigarh, India
Synopsis
HIV-1 enters the brain early in the course of infection and its replication continues despite use of combination anti-retrovirals (cART), causing chronic neuroinflammation, resulting in mild-to-moderate HIV-associated neurocognitive disorders in up to 50% of infected individuals. HIV-1 virus can be found throughout the brain of infected individuals, however, its maximum viral loads were found in the basal ganglia, frontal and medial temporal lobes, and hippocampus.1 We evaluated the use of a whole-brain proton MR spectroscopic imaging (MRSI) method at 3Tesla to better characterize the metabolite changes within the whole brain as a result of HIV infection.
Purpose
To utilize a whole-brain MRSI method for quantification of metabolite markers of inflammation and neuronal integrity at the hemispheric lobar and 47 anatomic ROI levels from individuals with HIV-1 clade C infection.Methods
We acquired MR data from individuals with HIV-1 clade C infection and cART naïve (n=15, 35±7 years, 11 males) and a group of healthy controls for comparisons (n=10; age: 33±5 years, 9 males). The data were acquired at 3T. The protocol used include whole-brain MRSI (TR/TE:1550/17.6 ms; 135 mm slab, Tacq=17 minutes) and T1-MRI (MPRAGE, 1 mm isotropic) sequences.
The data were processed and analyzed at the hemispheric lobar and 47 anatomic ROI level using MIDAS.2,3 Our metabolite spectral fit included prior information4 for N-acetyl aspartate (NAA), total-creatine (Cre), total-choline (Cho), and myo-inositol (m-Ins) among others. A modified AAL atlas5 with 47 ROIs was used. Our data processing included segmentation of the T1-MRI into gray matter (GM), white matter (WM) and CSF, and co-registration of T1-MRI and water-reference SI. We controlled the spectral quality of data included for analysis6 by limiting spectra with linewidths ≤12 Hz and by including data from voxels with tissue volume of ≥70%. We calculated five metabolite ratios, namely, NAA/Cre, Cho/Cre, m-Ins/Cre, m-Ins/Cho, and Cho/NAA. Group comparisons used ANCOVA with age as covariate and a p <0.05 for significance.
Results and Discussion
Hemispheric lobar level analysis
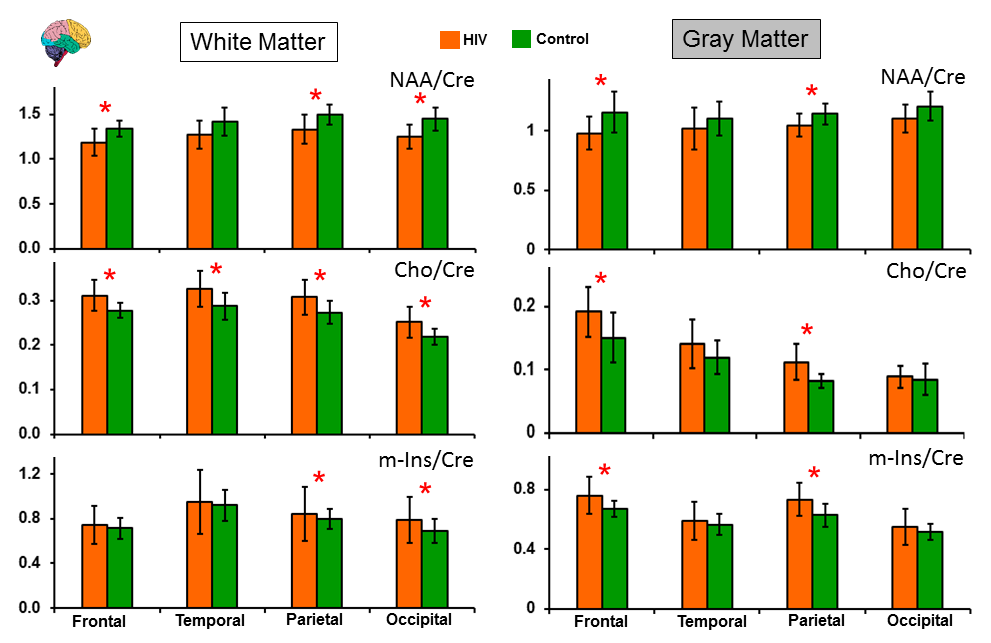
Figure 1 shows the metabolite ratios of HIV+ and control groups in WM and GM of the right side brain lobes (Similar trends were found in the left side lobes, so data not shown). In WM of HIV+ group, significant changes include reduced NAA/Cre (a marker of neuronal integrity) in the frontal, parietal and occipital lobes, increased Cho/Cre (a marker of neuronal inflammation) in all lobes, increased m-Ins/Cre (a marker of neuronal inflammation) in parietal and occipital lobes. In GM of HIV+ group, significantly reduced NAA/Cre in frontal and parietal lobes, increased Cho/Cre in frontal and parietal lobes, and increased m-Ins/Cre in frontal and parietal lobes were found. In HIV+ group, a trend of reduced NAA/Cre and trends of increased Cho/Cre and m-Ins/Cre are seen across all the lobes for WM and GM.
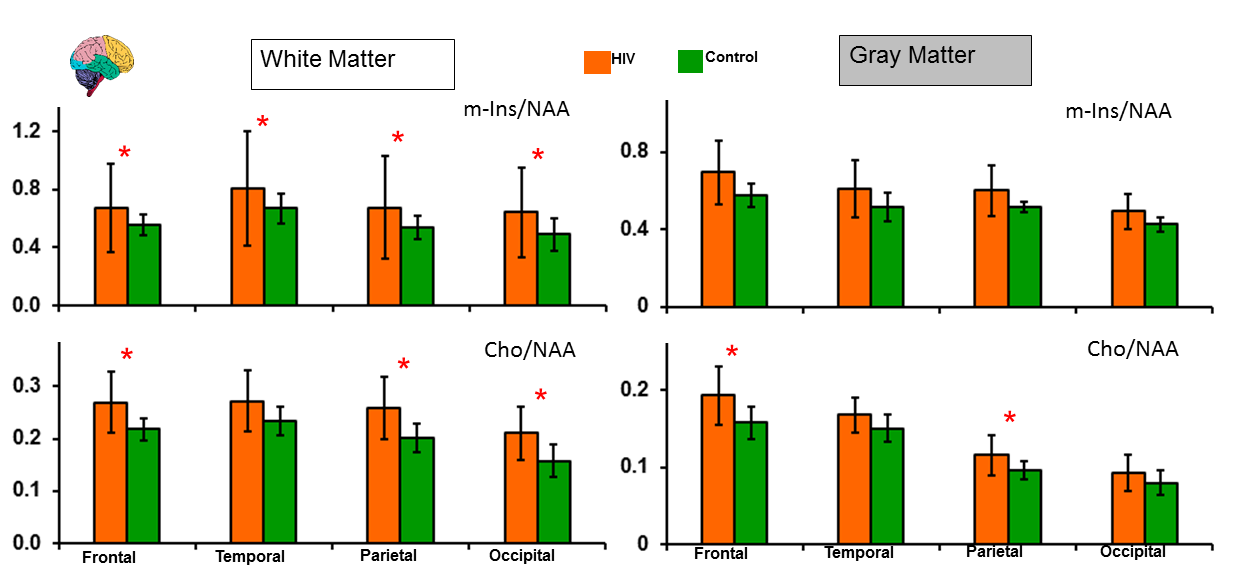
In Figure 2 are shown m-Ins/NAA and Cho/NAA in the right side brain lobes of both the groups (Similar trends were found in the left side lobes, so data not shown). These ratios capture both the neuro-inflammatory (i.e., increased m-Ins and Cho) and neuronal integrity (decreased NAA) changes. Since changes in the metabolites of these pathological processes vary in opposite directions, these ratios are expected to provide a higher sensitivity to find significant changes between the groups. As seen in Figure 2, m-Ins/NAA in all lobes, Cho/NAA in frontal, parietal and occipital lobes in WM, and Cho/NAA in frontal and parietal lobes in GM showed significant changes.
Uniform trends of either increased (for m-Ins/NAA, Cho/NAA, Cho/Cre and m-Ins/Cre) or decreased (for NAA/Cre) metabolite ratios across all lobes indicate that the cerebrum as a whole is affected in HIV infection. Relatively higher standard deviations seen for the metabolite ratios in both WM and GM for the HIV+ group (Figure 1 and 2) may indicate variable degrees of inflammation across the HIV+ individuals.
47-ROI level analysis
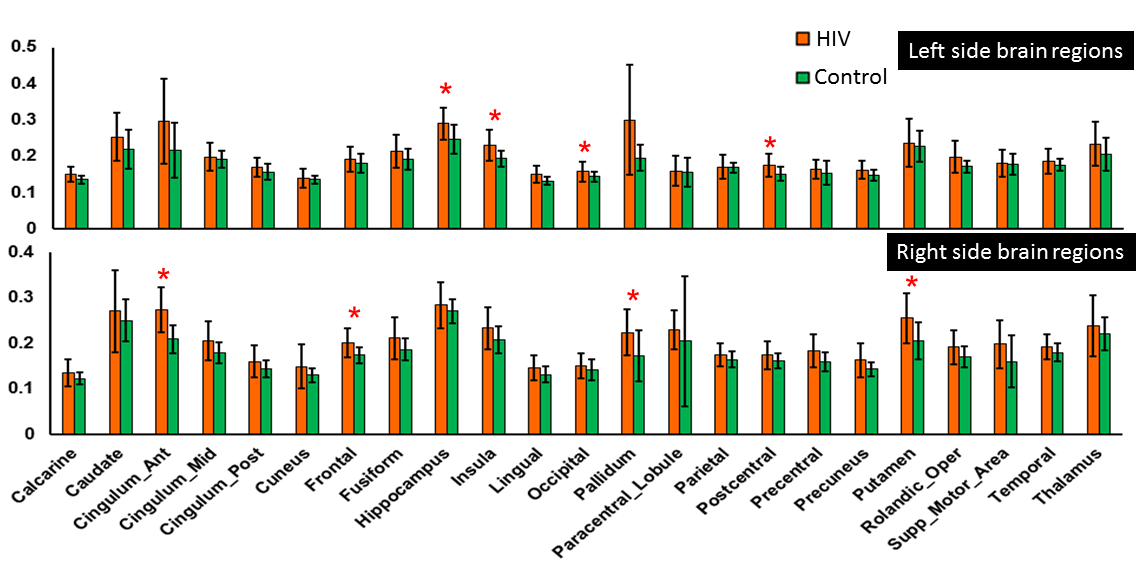
We found significantly altered markers of neuro-inflammation (i.e., Cho/Cre, m-Ins/Cre) and neuronal integrity (i.e., NAA/Cre) in several ROIs in the HIV+ group compared to controls. Figure 3 shows a trend of increased Cho/NAA in the HIV+ group across 46 cerebral regions (data from the cerebellum region were not analyzed) compared to controls. This trend, observed at the finer anatomical level, confirms the trend seen at the lobar level (see Figure 2), and also indicates that the inflammatory and neuronal integrity changes (i. e., increased Cho/NAA), due to HIV-1 infection, occur across all anatomical brain regions of HIV-1 clade C individuals. Furthermore, the relatively higher variability (i.e., SD) in the HIV+ group compared to controls, may indicate that individuals in the HIV+ group are at varying degrees of infection.
The whole-brain MRSI and data analysis used here show their potential utility for understanding spatio-temporal evolution of neuropathogenesis in HIV-1 and other infections.
Acknowledgements
Supported by Burroughs-Wellcome Fund and NIH R01 NS094043.References
1. Nath A. Eradication of human immunodeficiency virus from brain reservoirs. J Neurovirol. 2015;21(3):227-234.
2. Maudsley AA, Darkazanli A, Alger JR, Hall LO, Schuff N, Studholme C, Yu Y, Ebel A, Frew A, Goldgof D, Gu Y, Pagare R, Rousseau F, Sivasankaran K, Soher BJ, Weber P, Young K, Zhu X. Comprehensive processing, display and analysis for in vivo MR spectroscopic imaging. NMR Biomed. 2006;19(4):492-503.
3. Maudsley AA, Domenig C, Govind V, Darkazanli A, Studholme C, Arheart K, Bloomer C. Mapping of brain metabolite distributions by volumetric proton MR spectroscopic imaging (MRSI). Magn Reson Med. 2009;61(3):548-559.
4. Govindaraju V, Young K, Maudsley AA. Proton NMR chemical shifts and coupling constants for brain metabolites. NMR Biomed. 2000;13(3):129-153.
5. Tzourio-Mazoyer N, Landeau B, Papathanassiou D, Crivello F, Etard O, Delcroix N, Mazoyer B, Joliot M. Automated anatomical labeling of activations in SPM using a macroscopic anatomical parcellation of the MNI MRI single-subject brain. Neuroimage. 2002;15(1):273-289.
6. Govind V, Gold S, Kaliannan K, Saigal G, Falcone S, Arheart KL, Harris L, Jagid J, Maudsley AA. Whole-brain proton MR spectroscopic imaging of mild-to-moderate traumatic brain injury and correlation with neuropsychological deficits. J Neurotrauma. 2010;27(3):483-496.
Figures