3622
Structural analysis of m.3243A>G patients using 3D anatomical MRI brain scans1Institute of Neuroscience, Newcastle University, Newcastle upon Tyne, United Kingdom, 2Wellcome Mitochondrial Research Centre, Newcastle upon Tyne, United Kingdom, 3Newcastle upon Tyne Hospitals (NUTH), Newcastle upon Tyne, United Kingdom, 4Magnetic Resonance Centre, Newcastle upon Tyne, United Kingdom, 5Institute of Cellular Medicine, Newcastle University, Newcastle upon Tyne, United Kingdom
Synopsis
Symptoms associated with mitochondrial disease are heterogeneous and unpredictable. 17 m.3243A>G patients and 24 controls had 3D anatomical MRI brain scans, which were analysed to test the hypothesis that there are structural differences in patients that may potentially be used as biomarkers to predict symptoms. Results indicate head size is a possible surrogate biomarker for susceptibility to seizure-mediated strokes, but more detailed analysis did not provide any specific markers. Thinning of the cortex in the temporal poles appears to be directly related to the presence of the m.3243A>G point mutation and is an area to investigate further.
Introduction
Mitochondrial DNA disease is a collection of diseases caused by mutations and deletions within mitochondrial DNA that affect cellular energy production processes. Symptoms are heterogeneous and may affect virtually any part of the body, with any age of onset1. The m.3243A>G point mutation is the most common cause of mitochondrial disease in the adult population and makes up 80% of those diagnosed with the devastating MELAS syndrome, characterised by seizure-mediated strokes2. This work utilised 3D anatomical T1-weighted MRI scans to assess the hypothesis that there are structural brain differences in m.3243A>G patients that may provide predictive biomarkers of symptoms.Methods
Patients were recruited through a project investigating stroke-like episodes in m.3243A>G patients. Of 17 patients recruited, 10 had not experienced stroke-like episodes, and were classed as carriers, while seven had, and were classed as symptomatic. All patients were scanned on a Siemens 3T scanner using a 3D T1w anatomical protocol: GR; TR = 14.0 ms; TE = 4.1 ms; Flip Angle = 25°; isotropic 1mm3 voxels. 24 age and gender matched controls were also included in the study.
The anatomical scans were segmented into grey and white matter, and cerebral spinal fluid, using the FSLVm6_64 FAST algorithm3 to obtain global volumetric values. Total parenchymal and total intracranial volumes were also calculated. Cortical thicknesses were measured using cortical parcellation and the Desikan-Killiany Atlas in FreeSurfer 5.34-8. Lobe, and lobe region, values are means across the areas as labelled by the Atlas. Outputs were randomly manually checked to verify consistency and accuracy.
Statistical analysis was carried out using 2-sample t-tests and linear regression against age in MiniTab 17.1.0.
Results
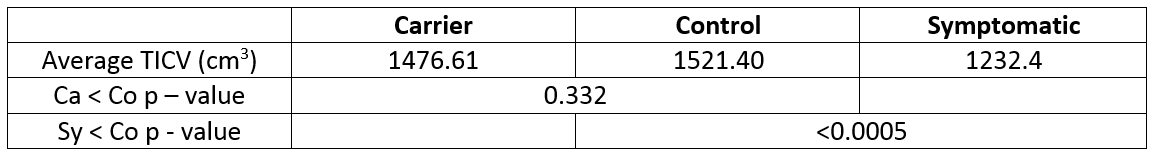
A clear difference in total intracranial volume was found between the control and symptomatic group, but there was no significant difference between carriers and controls (Table 1).
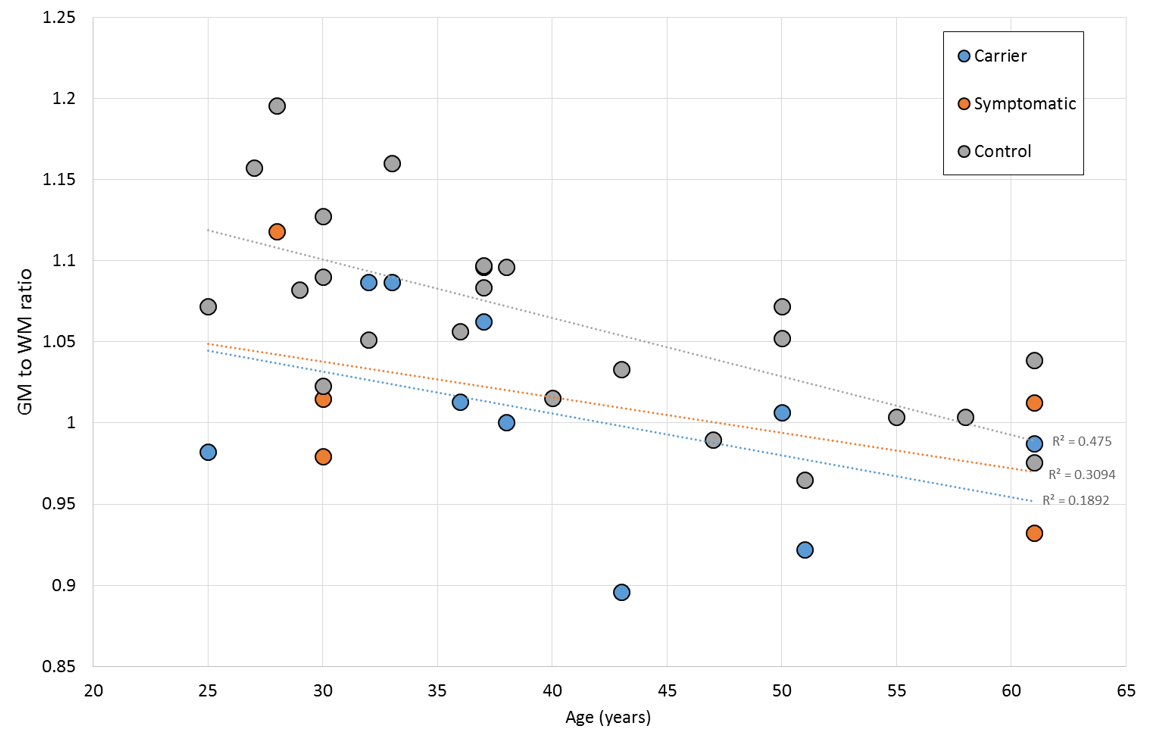
Figure 2 indicates a global difference in grey to white matter ratio, which may be of importance.
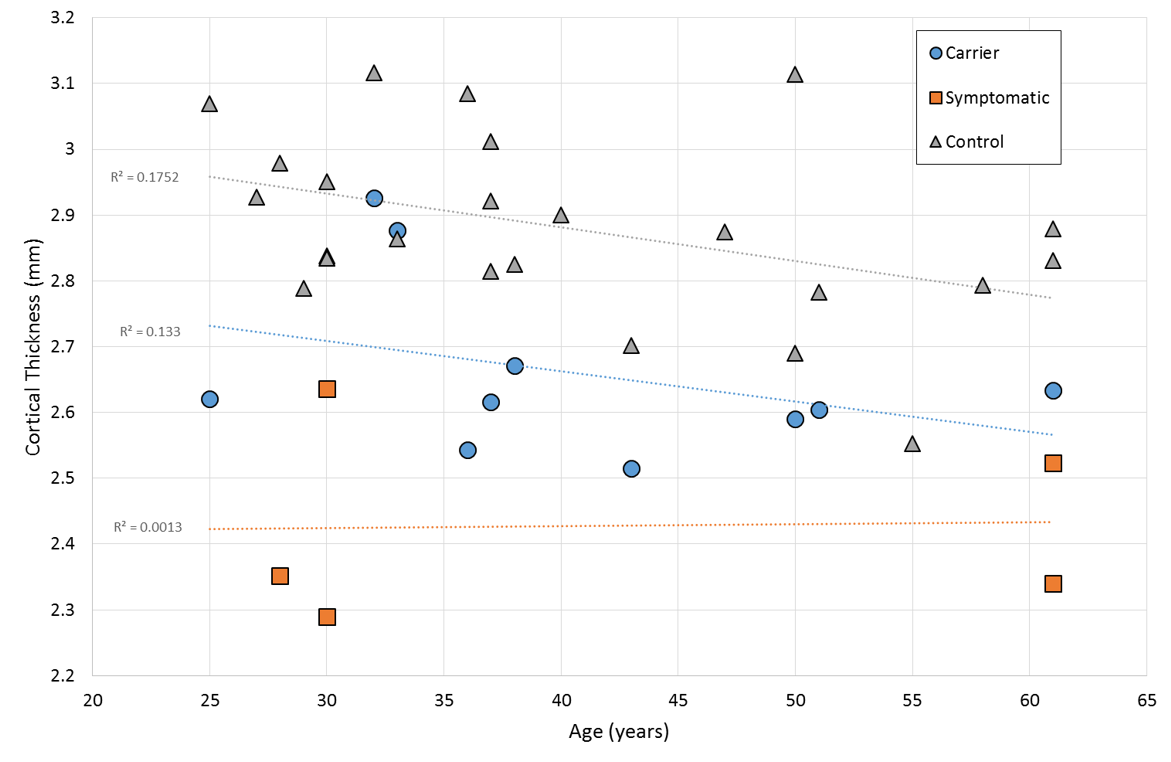
Figure 3 reports temporal lobe cortical thickness which gives a relatively clean differentiation between groups. Cortical thickness in all other lobes was not significantly different between carrier and control groups. The regression against age shows a weak correlation in the control and carrier groups, but with no significant difference between them. The symptomatic group also have atrophy as a major factor and so regression against age is more indicative of atrophy progression.
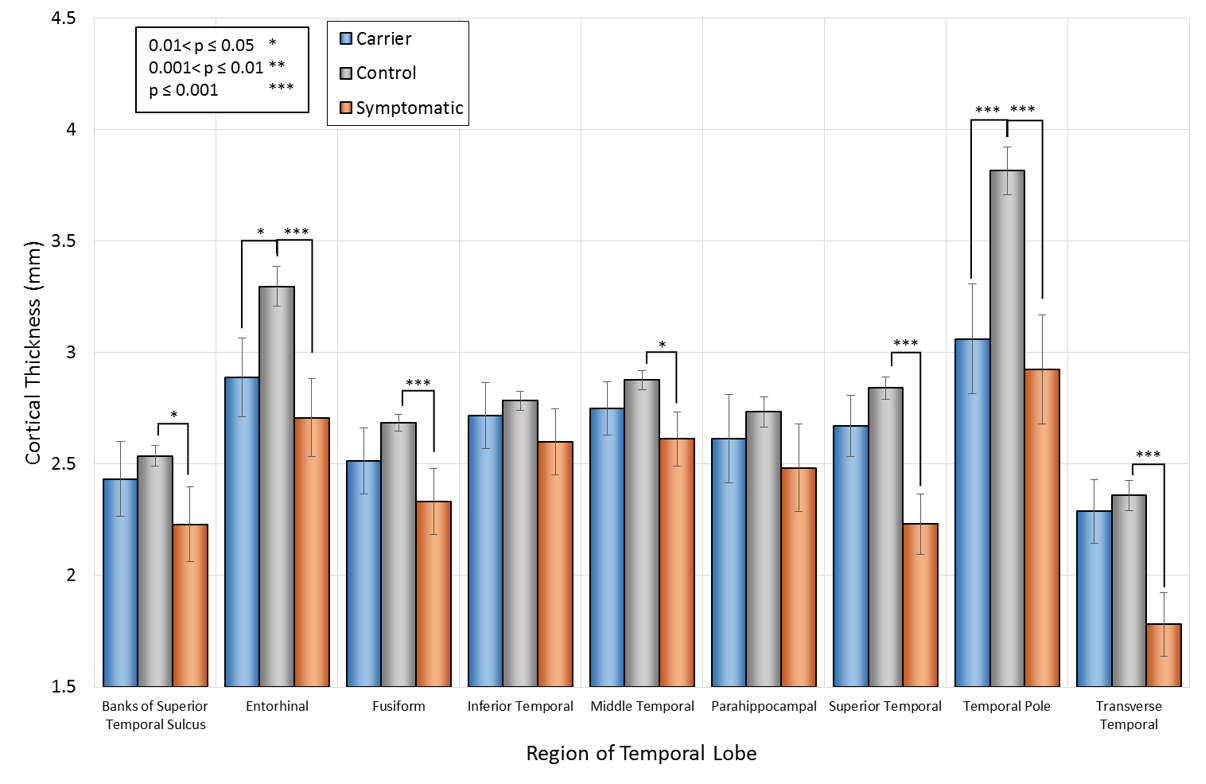
Figures 3 and 4 show the cortical thickness for the full temporal lobe, and a breakdown of the temporal lobe regions, compared to controls respectively. The temporal pole shows a highly significant difference in cortical thickness between patients and controls of almost 1mm. Even in completely asymptomatic patients one of the temporal poles is significantly thinned (patients aged 32 and 33).
Discussion
The only results to show clear structural differences between the carrier group and the symptomatic group was overall head size. Anecdotal clinical evidence supports the observation from Table 1 that m.3243A>G carriers with particularly short stature and small heads are more likely to suffer from stroke-like episodes, in addition to other severe symptoms. Seizure mediated stroke/metabolic stroke in patients with the m.3243A>G point mutation typically first present before the age of 409 and this measure may help to more easily identify those at greater risk. Further work is required to increase the sample size, for which legacy scans may be useful, to validate this finding.
To date it has not been clear whether there are specific differences in the brains of m.3243A>G carriers in general compared to healthy controls. This study has highlighted that there are some significant differences observed in all m.3243A>G patients, whether symptomatic or not. The ratio of grey to white matter volume is very similar in both carriers and symptomatic patients, irrespective of stroke-like episodes and associated atrophy, and this ratio is smaller than for controls. This indicates that there are some fundamental differences in the brains of m.3243A>G patients that, if understood, may offer insights into symptom onset.
The thinning of the temporal poles in all patients indicates that this is highly likely to be related to the genetic diagnosis of the m.3243A>G point mutation. The effects of the thin temporal pole cortex is currently unknown and further investigation of this area is required to ascertain whether there are additional changes in association with this.
Conclusion
Head size may be a surrogate marker for susceptibility to stroke-like episodes. There do not appear to be any other specific structural markers for stroke-like episode susceptibility, but the temporal pole appears to be affected by the m.3243A>G point mutation and requires further investigation.Acknowledgements
Thanks go to all of the patients involved in this study for providing unwavering support to help us gain a greater understanding of this disease.References
1. Schapira, A. H. Mitochondrial disease. Lancet. 2006; 368 : 70-82
2. Goto, Y., Nonaka, I., Horai, S. A mutation in the tRNALeu(UUR) gene associated with the MELAS subgroup of mitochondrial encephalomyopathies. Nature. 1990; 348 : 651-653
3. Zhang, Y., Brady, M., Smith, S. Segmentation of brain MR images through a hidden Markov random field model and the expectation-maximization algorithm. IEEE Trans. Med. Imag. 2001; 20 (1) : 45-57
4. Dale, A. M., Fischl, B., Sereno, M. I. Cortical surface-based analysis. I. Segmentation and surface reconstruction. Neuroimage. 1999; 45 (3) : 867-879
5. Fischl, B., Sereno, M. I., Dale, A. M. Cortical surface-based analysis. II. Inflation, flattening, and a surface-based coordinate system. Neuroimage. 1999; 9 (1) : 195-207
6. Fischl, B., Dale, A. M. Measuring the thickness of the human cerebral cortex from magnetic resonance images. Proc. Natl. Acad. Sci. U.S.A. 2000; 97 (20) : 11050-11055
7. Fischl, B., Salat, D. H., Busa, M., et al. Whole brain segmentation: automated labeling of neuroanatomical structures in the human brain. Neuron. 2002; 33 (2) : 341-355
8. Fischl, B., van der Kouwe, A., Destrieux, C., et al. Automatically parcellating the human cerebral cortex. Cereb. Cortex. 2004; 14 (3) : 11-22
9. DiMauro, S., Hirano, M. MELAS. GeneReviews [Internet]. 2001 (updated 2013); https://www.ncbi.nlm.nih.gov/books/NBK1233/
Figures